Method 1 – Using an Exponential Formula to Calculate Bacterial Growth Rate in Excel
Bacteria in cultures follow exponential growth. From experiments, we get the formula to calculate the growth rate. The Growth Rate (µ) formula is
µ = ((log10 N - log10 N0) 2.303) / (t - t0)Here,
N = Number of Bacteria at t second
No = Number of Bacteria at to second
t = a particular time in the growth period
to = starting time of bacteria culture
Step 1: Write the formula in any blank cell (i.e., E6).
= ((log10 N - log10 N0) 2.303) / (t - t0)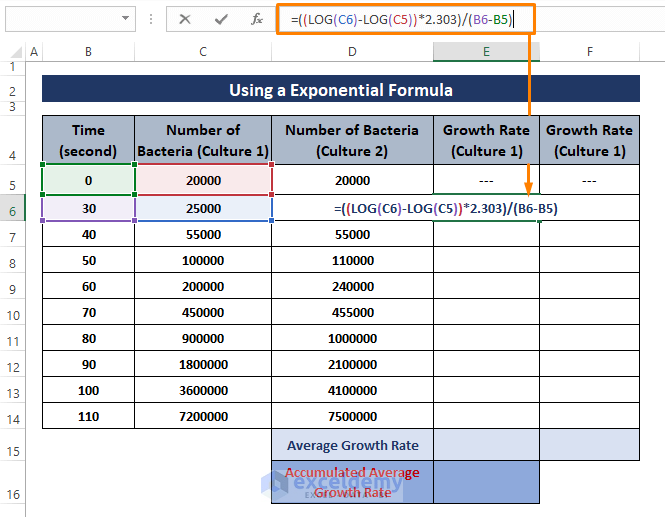
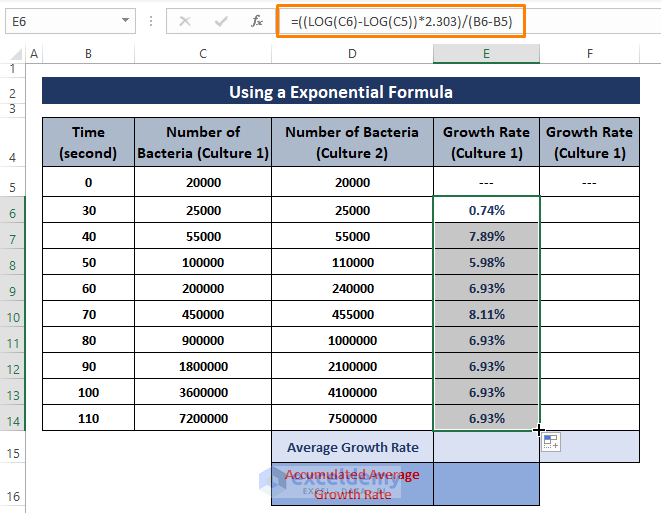
Step 2: Press ENTER, Drag the Fill Handle to display the Growth Rate for Bacteria Culture 1 as depicted in the image below.
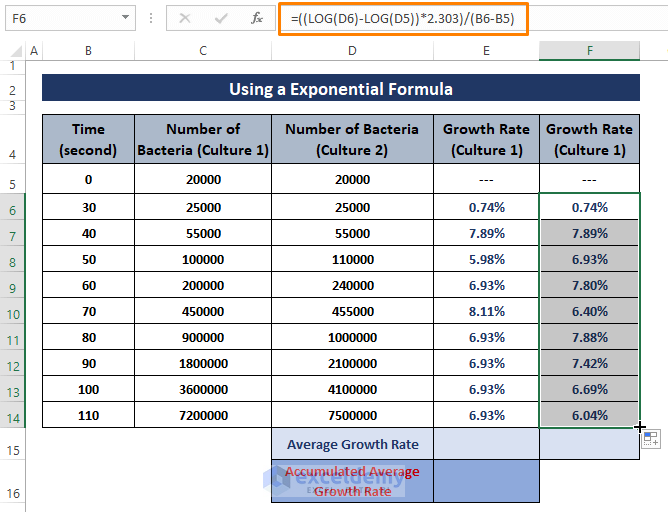
➤ Repeat Steps 1 and 2 in order to bring out the Growth Rate for Bacteria Culture 2 similar to the picture below.
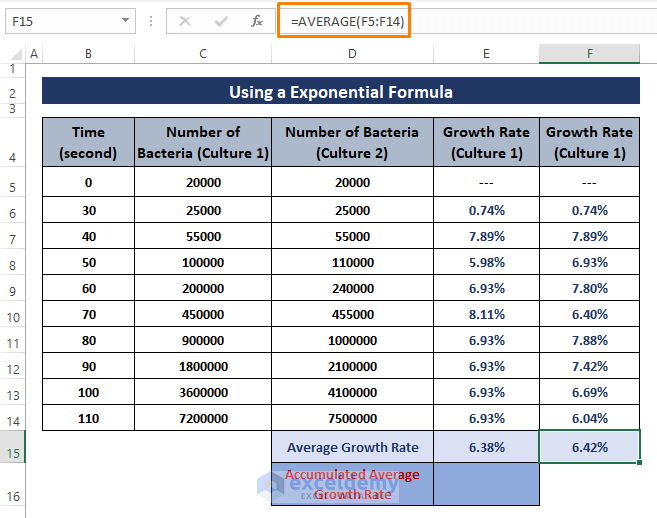
Step 3: After getting the Growth Rate percentages for Bacteria Culture 1, apply the AVERAGE function. The AVERAGE function calculates the average Growth Rate percentages out of those resultant percentages.
Type the below formula
=AVERAGE(E5:E14)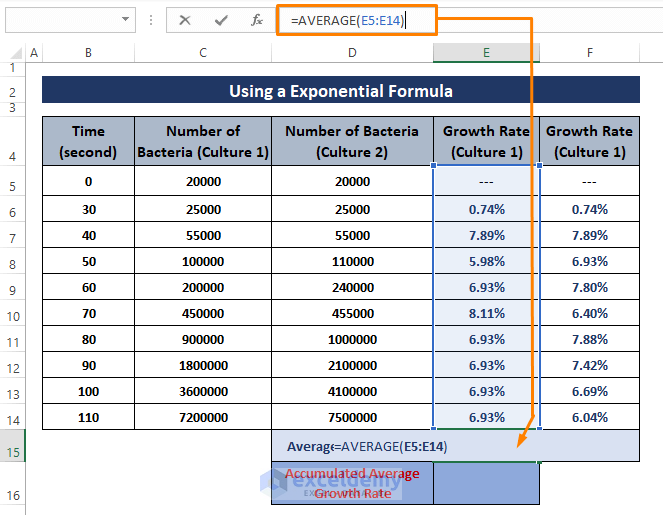
➤ Following Step 3, apply the AVERAGE formula to calculate the average Growth Rate of bacteria in Culture 2.
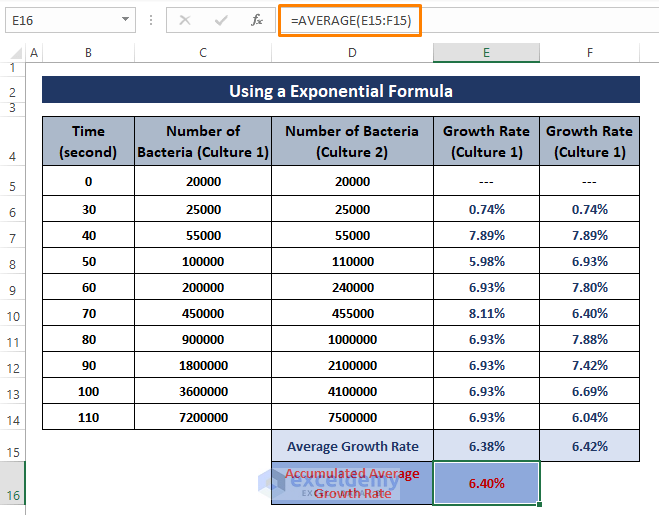
Step 4: Combine the two average Growth Rates into an Accumulated Average Growth Rate using an AVERAGE formula. Use the formula written below
=AVERAGE(E15:F15)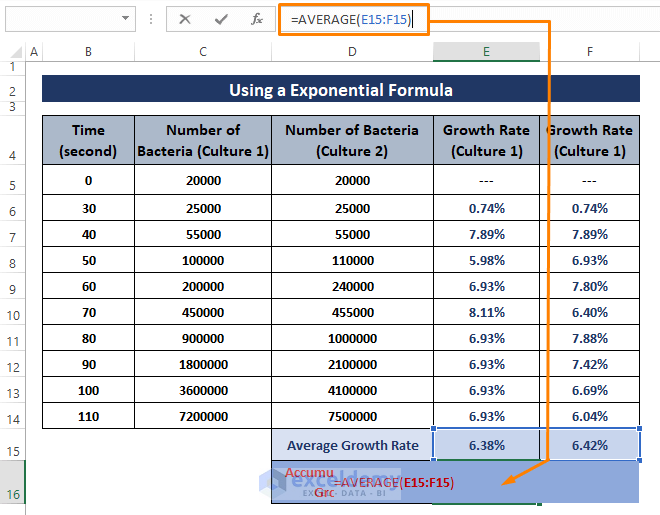
Step 5: Hit the ENTER key, and you get the Accumulated Average Growth Rate for the two Bacteria Cultures.
Calculating a bacterial culture’s Growth Rate requires experimental data, and the formula must be compatible with the bacteria’s characteristics. We calculate the Bacterial Growth Rate using a typical empirical formula. Use yours that is compatible with the bacteria’s characteristics.
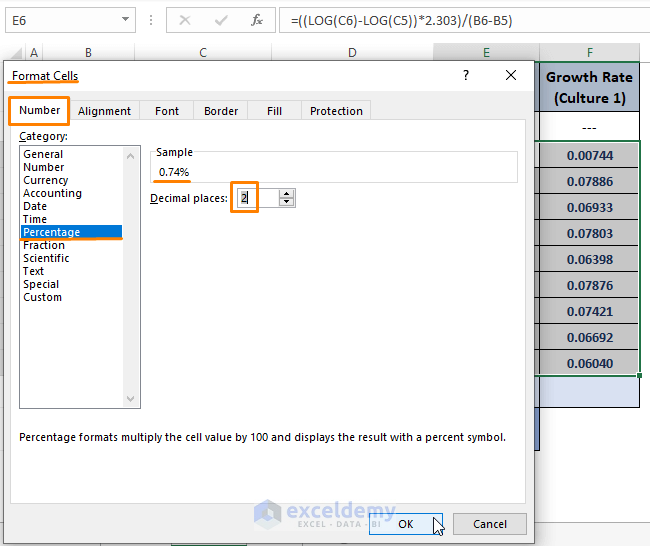
To display the Growth Rate in percentages, you have to pre-formatted the cell in percentage Category from the Format Cells window.
➤ Select a range of cells then Press Keyboard shortcuts CTRL+1 altogether to bring out the Format Cells window. Select the Number section > Choose Percentage as Category > Assign the number of Decimal Places you want your data in.
Click OK.
Method 2 – Using Chart Method to Display the Growth Rate
We used an Exponential Formula to calculate the Growth Rate of a Bacteria Culture. Use the dataset to display a Curve Chart from where we extract the Exponential Formula. By looking at the formula, find out the Growth Rate for each Bacteria Culture. The typical Exponential Formula of Bacteria Culture is
y=b*emxIn the formula,
y = yielding number of bacteria after x time.
b = Constant.
m = Bacteria Growth Rate
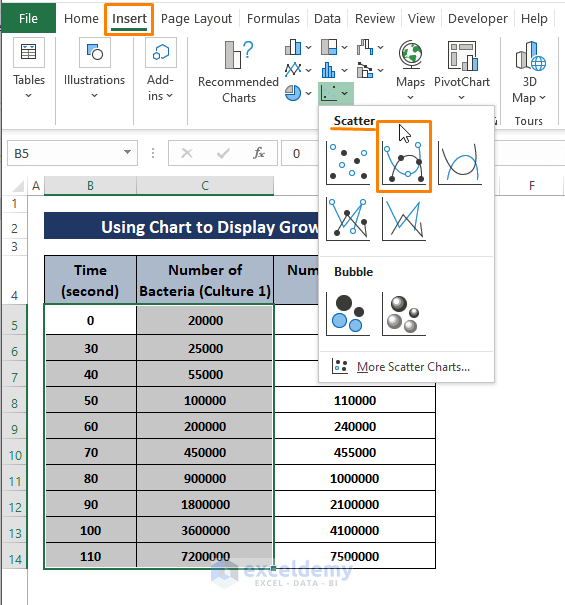
Step 1: Select the two columns (i.e., Time vs Number for Bacteria Culture 1). Then Go to the Insert tab > Select a Chart Type (shown in the screenshot) from Scatter options (from the Charts section).
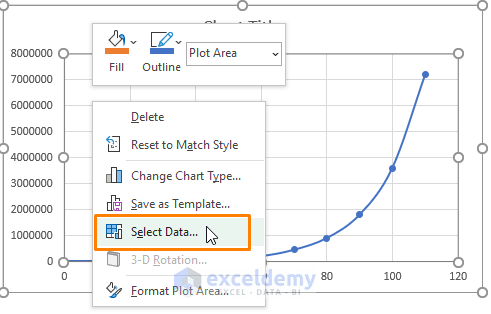
Step 2: The Chart appears Right Click on the Chart. The Context Menu pops up. From the Context Menu, Select Select Data from the options.
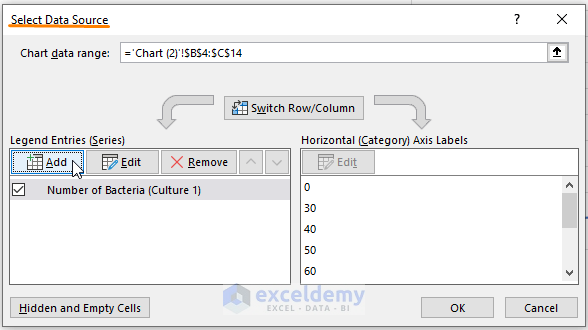
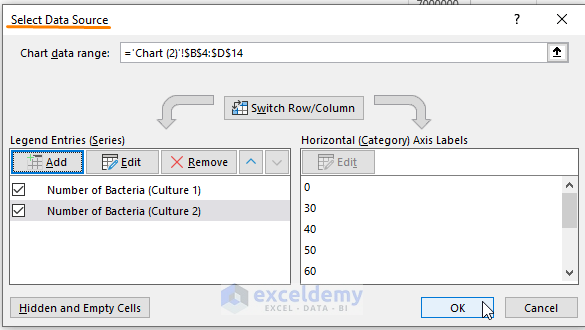
 Step 3: The Select Data Source window appears. There is an added data source already. Add the bacteria culture 2 entries as another data source. Click on Add in the Select Data Source window.
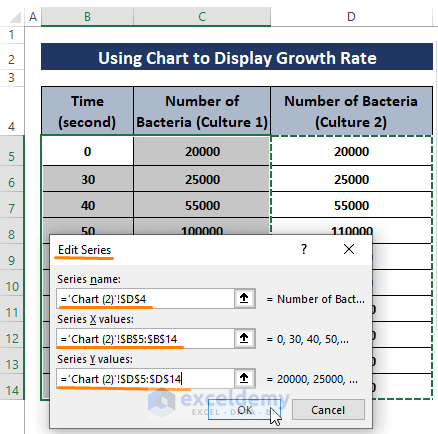
Step 4: The Edit Series window opens up. Insert the respected data in Series X and Y values. Give the Series a Name (i.e., Number of Bacteria (Culture 2)).
Click OK.
Step 5: Clicking OK on the Edit Series dialog box takes you to the Select Data Source window again. The two data sources mean you’ll have two Curves on the Chart of the two equations.
Click on OK.
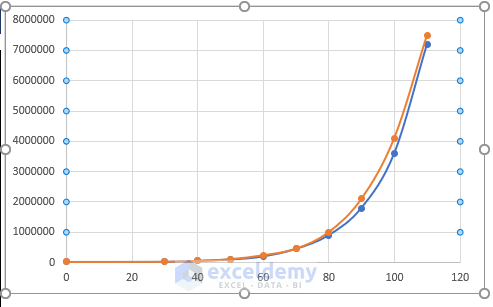
➤ Your expectations, you have two Curves on the Chart. One is there for Culture 1 and the other for Culture 2 as depicted in the following image.
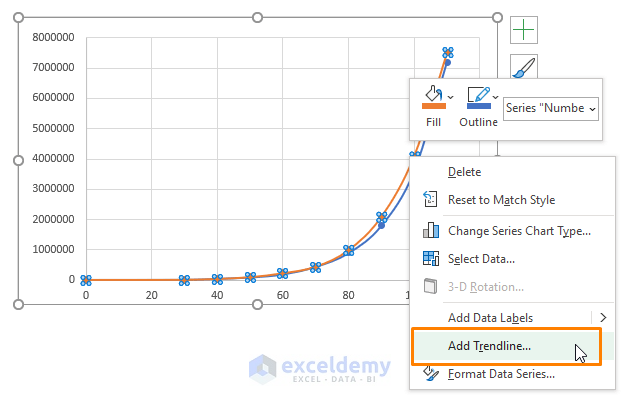
Step 6: As we want to insert the formulas for each Curve. Click on any curve (i.e., Orange Colored) then Right Click on it.
The Context Menu appears. From the Context Menu, Select Add Trendline.
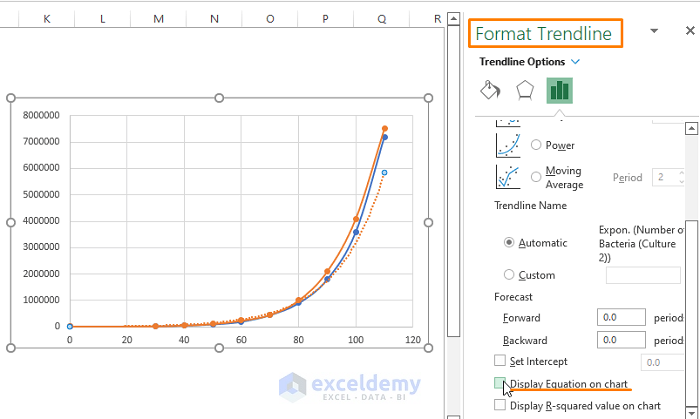
 Step 7: The Format Trendline side common box appears. From the Format Trendline command box, Choose Exponential as Trendline Options. Scroll Down.
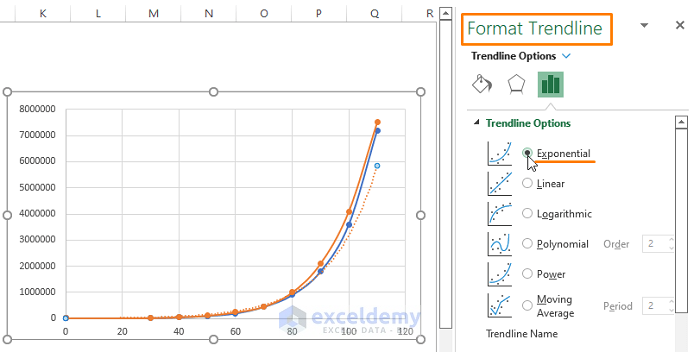
Step 8: See an option saying Display Formula on Chart. Check the option as shown in the picture below.
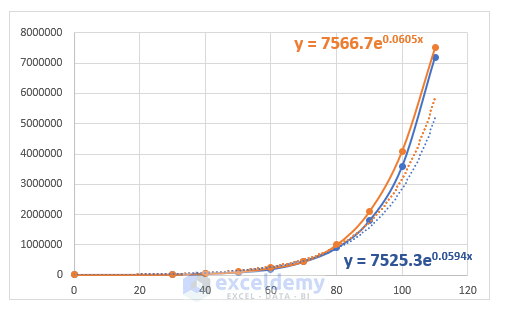
Step 9: Repeat Step 6, 7, and 8 for the Blue Colored curve and you get the exponential equations in the same colors for both Curves.
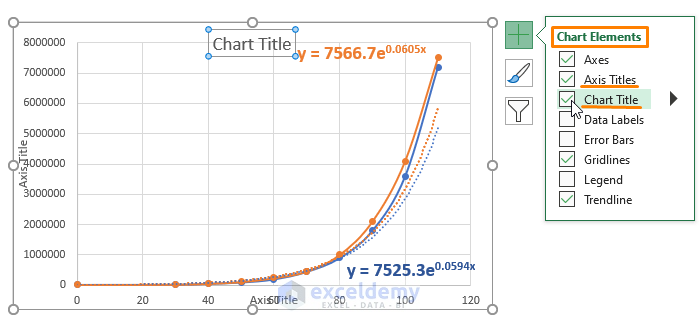
 ➤ Add the Chart and Axis title, click on the big PLUS Icon button. A couple of options appear, Tick the Axis and Chart Title to display them on the chart.
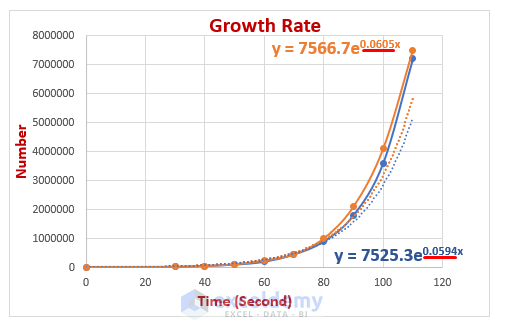
 ➤ Assign suitable titles for the Chart and Axis Title. The entire chart looks similar to the image below.
 You see the equations (i.e., y=7566.7e0.0605x and y=7525.3e0.0594x) for both data sources. By comparing the equations to the typical Exponential Equation (i.e., Y=b*emx ), you can say that the Growth Rate of the Bacteria Culture 1 and 2 are 0.605 or 6.05% and 0.0594 or 5.94% respectively.
Find the Growth Rate just by acquiring the equations.
Download Excel Workbook
Related Articles
- How to Calculate Reverse Percentage in Excel
- How to Calculate Grade Percentage in Excel
- Calculate Excel percentage difference between two numbers
- Subtract a Percentage in Excel
<< Go Back to Excel GROWTH Function | Excel Functions | Learn Excel
Get FREE Advanced Excel Exercises with Solutions!
