In statistics, Variance gives the measurement of how the numbers of data are distributed around the mean/expected value, and measures the distribution by looking at all the data points. In this article, we will analyze different methods and functions for calculating variance in Excel.
Introduction to Variance
Normally, variance is the difference between an expected and actual result. In statistics, the variance is calculated by dividing the square of the deviation about the mean by the number of the population. To calculate the deviation from the mean, the difference of each individual value from the arithmetic mean is taken, and then all the differences are summed up.
Classification of Variance
Variance can be classified into 3 categories:
- Percentage Variance
- Population Variance
- Sample Variance
In this tutorial, we will learn to calculate all of them using different methods.
How to Calculate Variance in Excel: 3 Handy Approaches
We will use both the manual process and built-in Excel functions to calculate the variance.
Method 1 – Using the ABS Function to Calculate Percentage Variance
In the first approach, we will calculate the percentage variance between two numbers in Excel using the ABS function. The main formula for determining percentage variance is:
Variance = (New value-Original value)/Original value
If the original value is greater than the new value, we will get a negative result. To avoid the negative result, we will use the function ABS in the formula, which makes the negative number positive. So the formula will become:
Variance = ABS(New value-Original value)/Original value
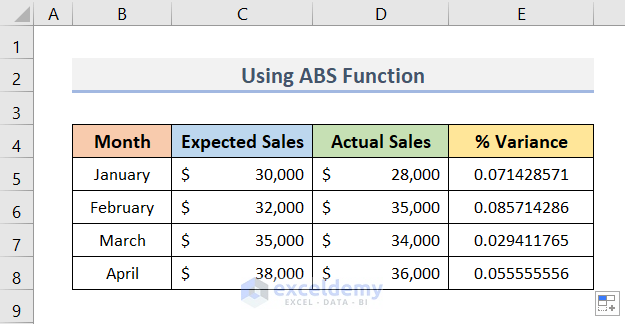
Suppose we have a dataset (B4:E8) that contains the Expected & Actual Sales for some months. We need to calculate the % Variance of those Expected & Actual Sales.
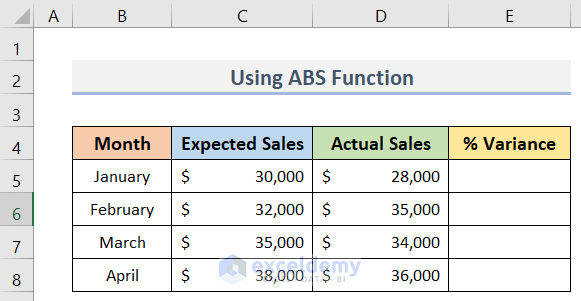
Steps:
- Select cell E5.
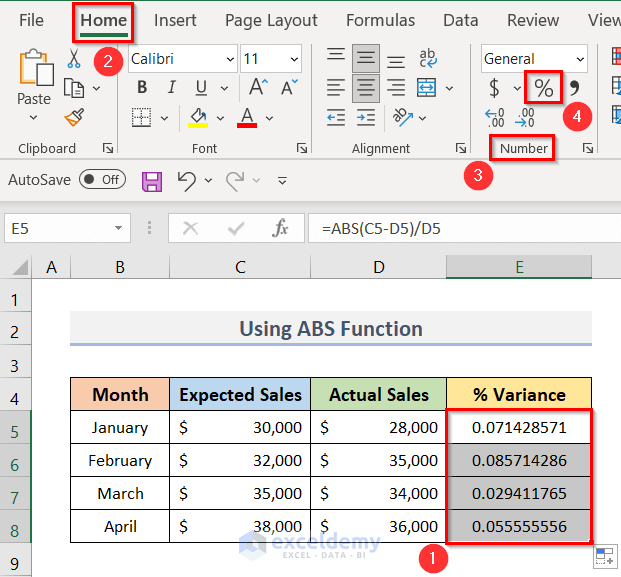
- To calculate the variance, enter the following formula in cell E5:
=ABS(C5-D5)/D5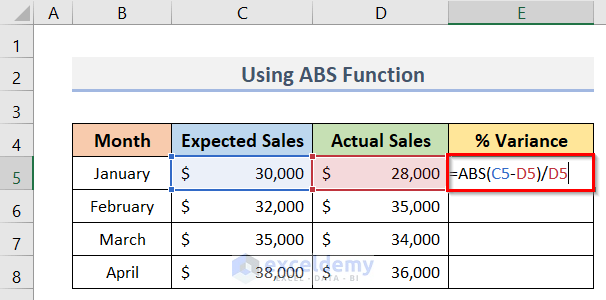
- Press Enter.
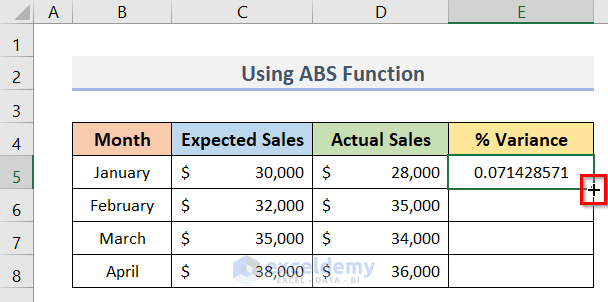
- Double-click on the plus (+) sign located at the bottom right corner of cell E5 to AutoFill the rest of the cells (see screenshot).
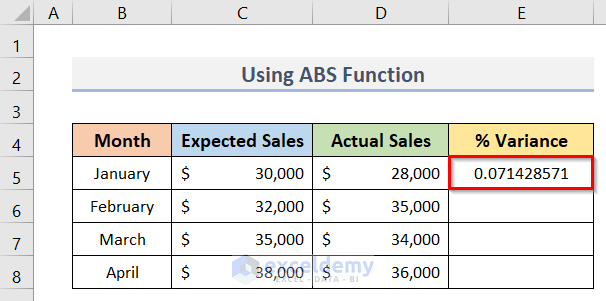
Hence, we will get all the variances (E5:E8). In the following picture, we can see that the variances are decimal numbers, but we need a percentage variance.
- To get the variances in percentage format, select range E5:E8 > go to the Home tab > Number group > click on the ‘%’ symbol.
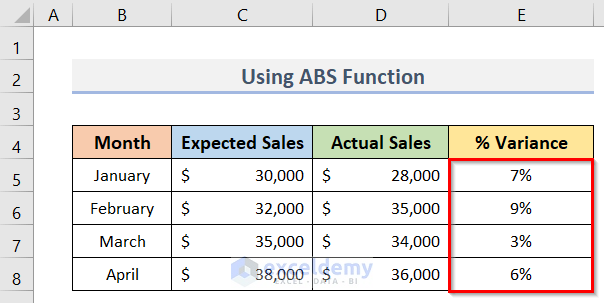
We have the percentage variances (E5:E8) like in the screenshot below.
Read How to Calculate Mean Variance and Standard Deviation in ExcelMore: How to Do Variance Analysis in Excel
Method 2 – Calculating Population Variance in Excel
Now, we will calculate population variance in Excel. First we’ll apply manual calculation and then use built-in Excel functions. The two approaches are explained below.
2.1 – Manual Calculation
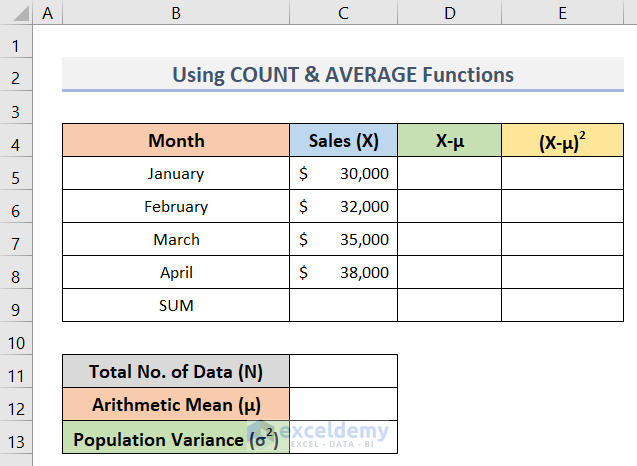
Suppose we have a dataset containing the Sales values in some months (see the screenshot below). Now, we need to calculate the population variance of the Sales (C5:C8) in cell C13. We will use the COUNT, AVERAGE & SUM functions to do so.
The main formula for calculating population variance is:
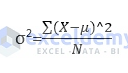
Here,
- μ is the arithmetic mean.
- X is the individual value.
- N is the size of the population.
- σ2 is the population variance.
First, we’ll calculate the population variance manually.
Steps:
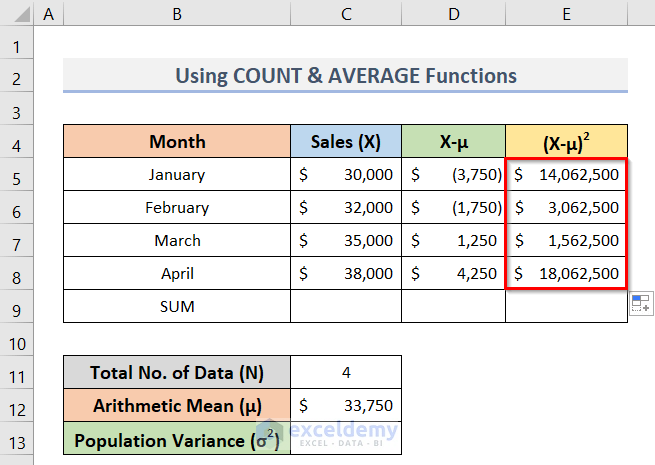
- For easier calculation, make two helper columns for (X-μ) and (X-μ)2.
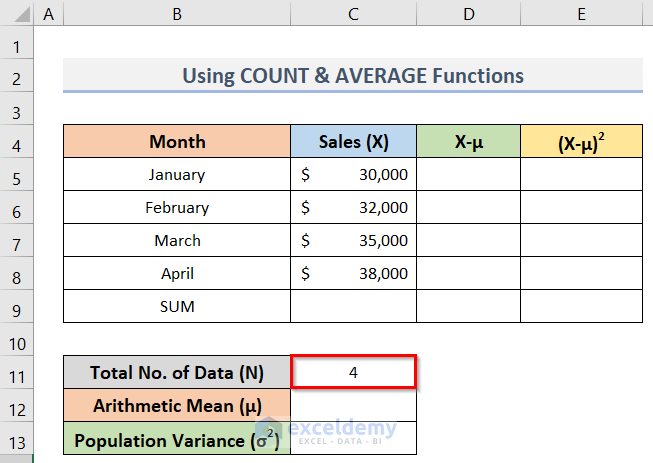
- To calculate the total number of data, use the following formula in cell C11:
=COUNT(C5:C8)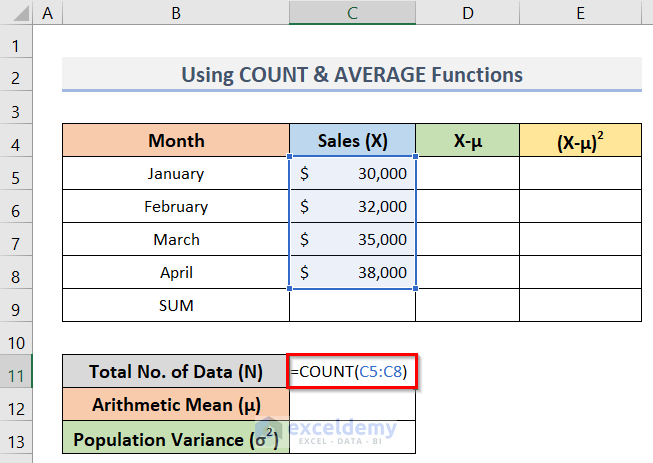
- Press Enter.
The resultant value in cell C11 will be N for the above formula for the population variance.
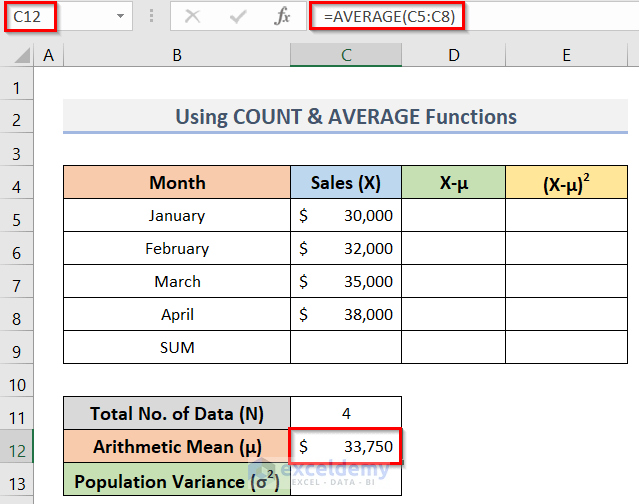
- To calculate the arithmetic mean for the individual values, enter the following formula in cell C12:
=AVERAGE(C5:C8)- Press Enter to return the result.
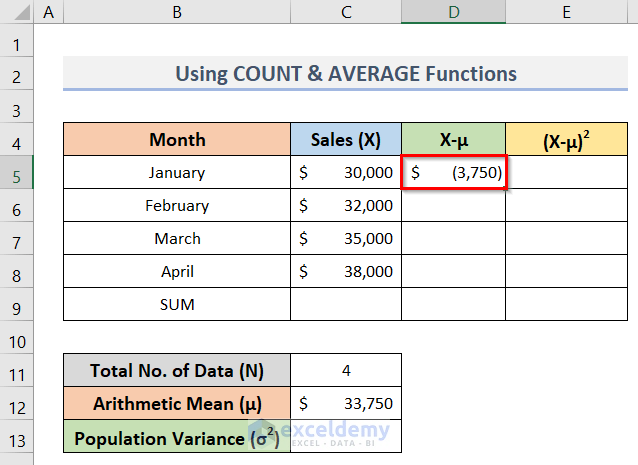
- To calculate the deviation about the mean (X-μ), enter the formula below in cell D5:
=C5-$C$12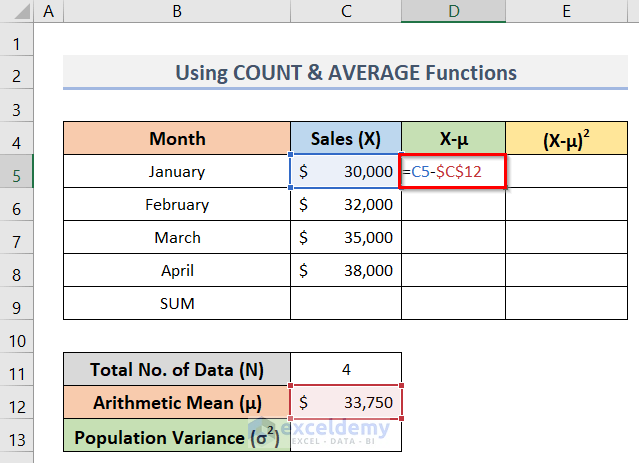
- Press Enter to find the result.
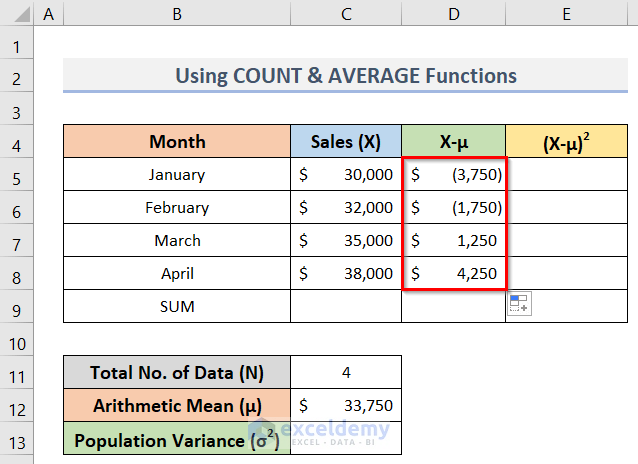
- Drag the Fill Handle to copy the formula down to cell D8.
- To square the deviation about the mean (X-μ), enter the following formula in cell E5:
=D5^2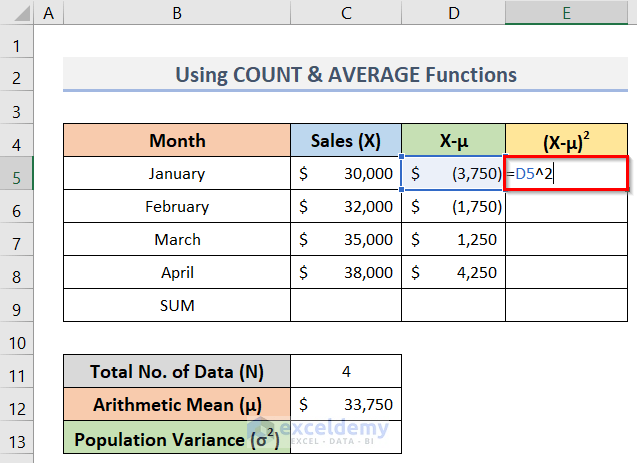
- Press Enter.
- Drag the Fill Handle down to cell E8 to copy the formula.
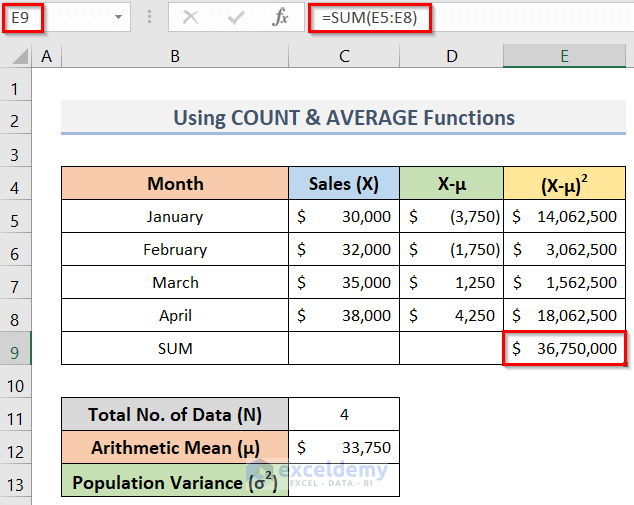
- Calculate the sum of the square of the deviation about the mean (X-μ)2 using the formula below in cell E9:
=SUM(E5:E8)- Press Enter to get the sum.
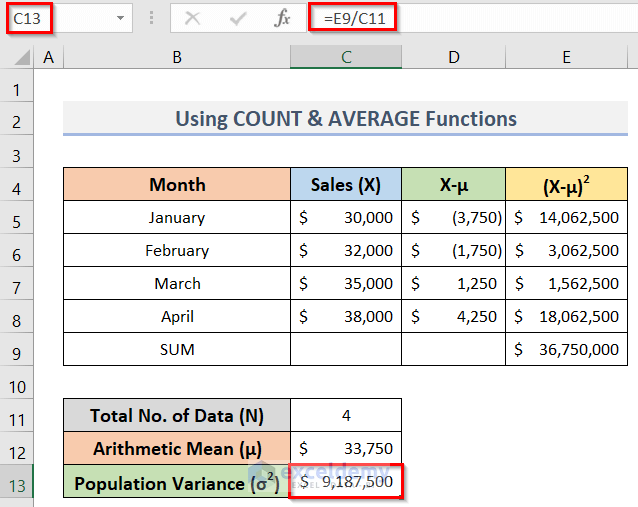
Finally, we calculate the population variance by dividing the square of the deviation about the mean (X-μ)2 by the total number of data (N).
- To do so, enter the formula below in cell C13:
=E9/C11- Press Enter to return the desired output.
2.2 – Using Built-in Excel Functions
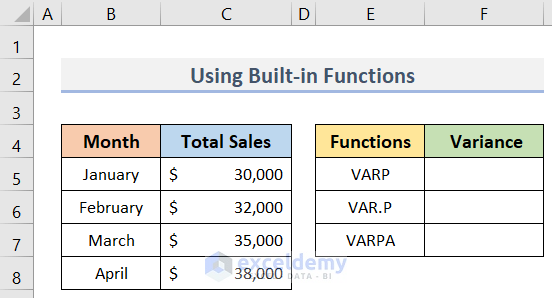
Assuming we have a dataset (B4:C8) containing the Total Sales in some months, we will use 3 built-in Excel functions to calculate the population variance of the sales: the VARP function, the VAR.P function & the VARPA function.
VARP Function
The VARP function is a built-in Excel function that can calculate the population variance at once. The steps for finding the population variance are below.
Steps:
- Select cell F5.
- To get the population variance of the Total Sales, enter the following formula in cell F5:
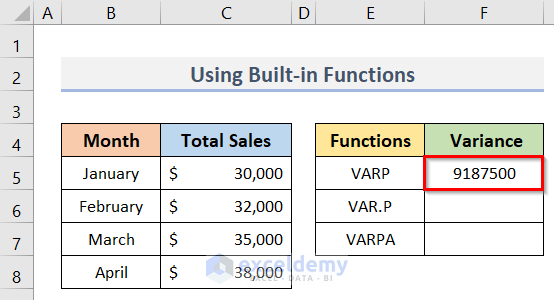
=VARP(C5:C8)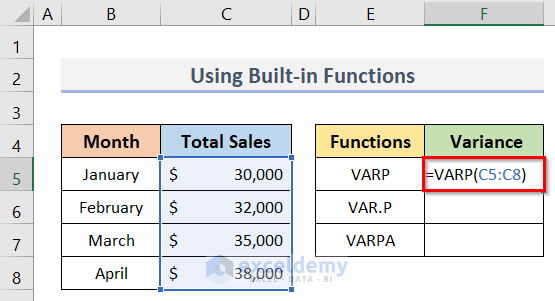
- Press Enter.
The desired population variance is returned in cell F5.
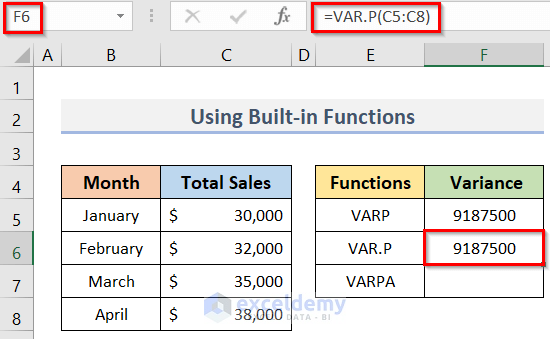
VAR.P Function
This function returns the variance from a whole population, and the logical and text values are ignored.
Steps:
- Select cell F6.
- Calculate the population variance using the formula below:
=VAR.P(C5:C8)- Press Enter to see the result in cell F6.
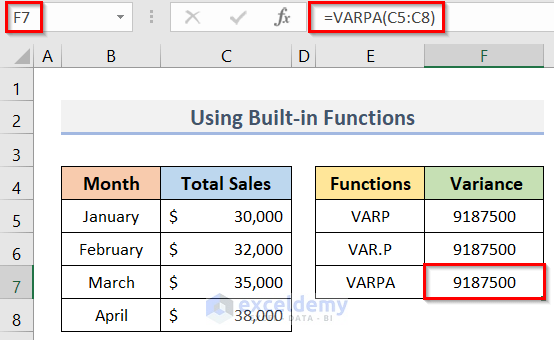
VARPA Function
This function evaluates the logical and text values in the calculation.
Steps:
- Activate cell F7.
- To get the population variance, enter the following formula in the selected cell (F7):
=VARPA(C5:C8)- Press Enter.
The final output is like in the picture below.
Read More: How to Calculate Coefficient of Variance in Excel
Method 3. Determining Sample Variance in Excel
Now we’ll calculate the sample variance in Excel using two approaches: applying manual calculation and then calculation with built-in Excel functions.
3.1 – Calculating Manually
For calculating the sample variance manually, the following formula is used:
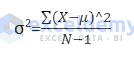
Here,
- μ is the arithmetic mean.
- X is the individual value.
- N is the size of the population.
- σ2 is the sample variance.
We will use the same dataset used for calculating the population variance manually in Method 2.1. There is only one difference between the previous formula (population variance) and this, namely that the sample formula has a denominator of N-1 where previously the denominator was N.
The whole calculation in Excel will be almost the same. The only difference will be dividing the square of the deviation about the mean (X-μ)2 by (N-1) instead of N. So with the same values of data, the sample variance is always greater than the population variance. The following picture shows the result (in cell C13) and the necessary data table for the calculation of sample variance.
In this case, we inserted the following formula in cell C13:
=E9/(C11-1)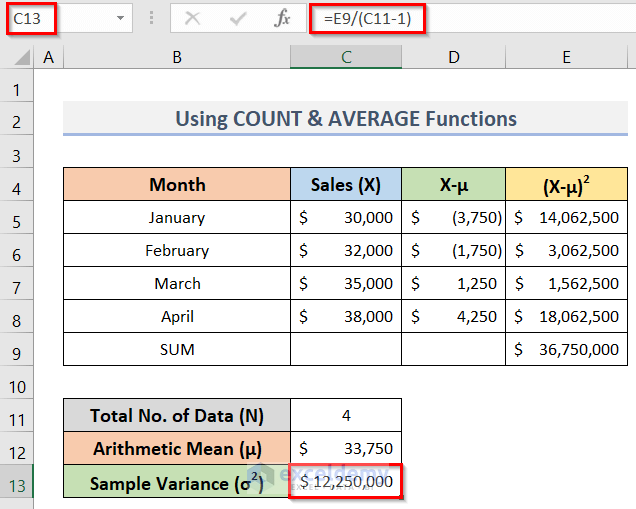
Read More: How to Calculate Pooled Variance in Excel
3.2 – Assigning Built-in Excel Functions
We will now calculate the sample variance using three built-in Excel functions: the VAR function, the VAR.S function and the VARA function. To illustrate this method, we will use the Excel dataset (B4:C8) below, containing the Total Sales of the corresponding months.
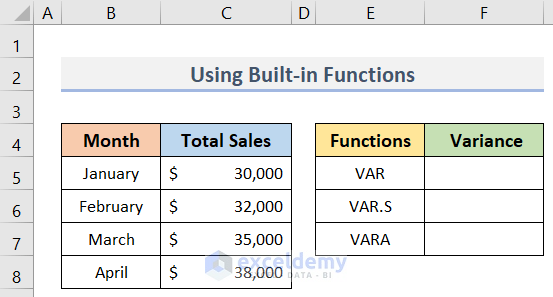
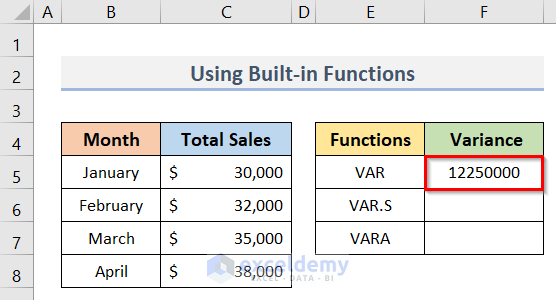
VAR Function
The VAR function is the earliest built-in function in Excel to evaluate variance from a sample. All Excel versions from 2000 through 2019 include this function.
Steps:
- Select cell F5.
- To calculate the sample variance, enter the following formula:
=VAR(C5:C8)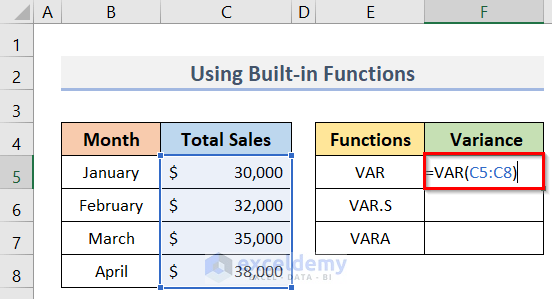
- Press Enter.
The result is returned in cell F5.
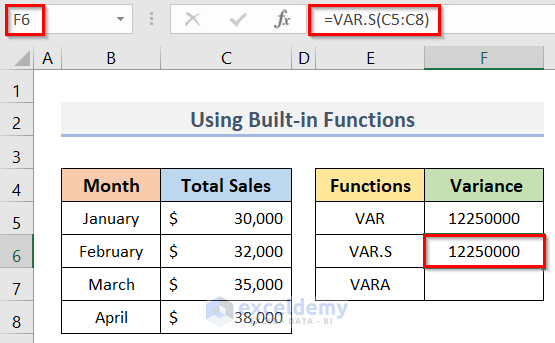
VAR.S Function
The VAR.S function is the updated version of the VAR function in Excel, and can also be applied to determine the sample variance.
Steps:
- Enter the formula below in cell F6:
=VAR.S(C5:C8)- Press Enter.
The result is returned in cell F6.
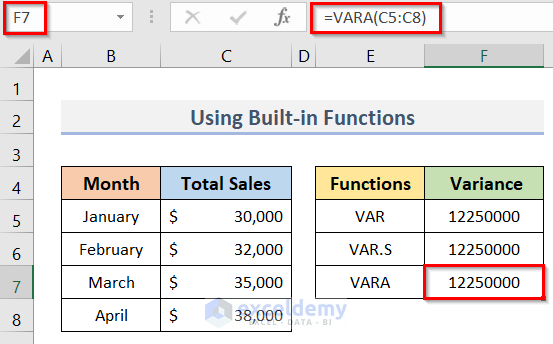
VARA Function
This function calculates the sample variance from a list of numbers and logical text values.
Steps:
- To calculate the sample variance, enter the following formula in cell F7:
=VARA(C5:C8)- Press Enter.
The sample variance is returned.
Things to Remember
Before using the built-in Excel functions to evaluate variance in Excel, there are several factors to consider:
- For population data sets, the more recent function, VAR.P, should be used instead of VARP.
- Similarly, for calculating sample variance, VAR.S should be used in the first case, even if VAR and VAR.S are functionally equivalent.
- If you include a text string as a value in a variance formula, refer to it in another cell.
Download Practice Workbook
Calculate Variance in Excel: Knowledge Hub
- How to Calculate Mean Variance and Standard Deviation in Excel
- How to Find the Variance of a Probability Distribution in Excel
- How to Apply Variance Formula in Excel to Get Plus-Minus Results
- How to Calculate Semi Variance in Excel
- How to Calculate Budget Variance in Excel
- How to Calculate Variance of Stock Returns in Excel
- How to Do Price Volume Variance Analysis in Excel
- How to Calculate Schedule Variance Using Excel Formula
- Budget vs Actual Variance Formula in Excel
- How to Calculate Variance Inflation Factor in Excel
- How to Calculate Portfolio Variance in Excel
- How to Create Minimum Variance Portfolio in Excel


the formula you have for How to Calculate Percentage Variance in Excel is written Variance = ABS(new value-original value)/original value. But in the example is ABS(new value-original value)/new value. so what is it?
Hi Pete, you are right!
Variance= ABS(new value-original value)/original valueis the correct one.We are really grateful for your precious feedback. We have updated the Excel file and main content accordingly.
Best Regards.
-ExcelDemy team.