In general, variance is one of the most useful topics in statistics and is widely used to calculate stock returns in the stock market. Moreover, it gives you a measurement of how the data is spread around the mean. It calculates the distribution by looking at all the data. In this article, I will show you 2 easy ways to calculate the variance of stock returns in Excel. However, if you are curious about it, download our practice workbook and follow us.
What is Variance?
The measure of a dataset’s variability, known as variance, shows how far apart the various values are from one another. Normally, the variance is calculated by dividing the square of the difference in the mean by the number of the population. However, its mathematical definition is the average of the squared deviations from the mean. Thus, we can represent the mathematical expression of sample variance as a formula. In sample variance, a sample is a chosen number of samples taken from a population.
Variance ( σ2 ) = Σ (X – µ)2 / (N-1)
Here,
X – Individual value
µ – Arithmetic Mean
N – Total number of observations
How to Calculate Variance of Stock Returns in Excel: 2 Easy Ways
This section of the article will teach you two simple and tricky ways to calculate the variance of stock returns in Excel. Moreover, I should not mention that I have used the Microsoft Excel 365 version for this article; you can use any other version according to your convenience. For the purpose of demonstration, I have used the following sample dataset.
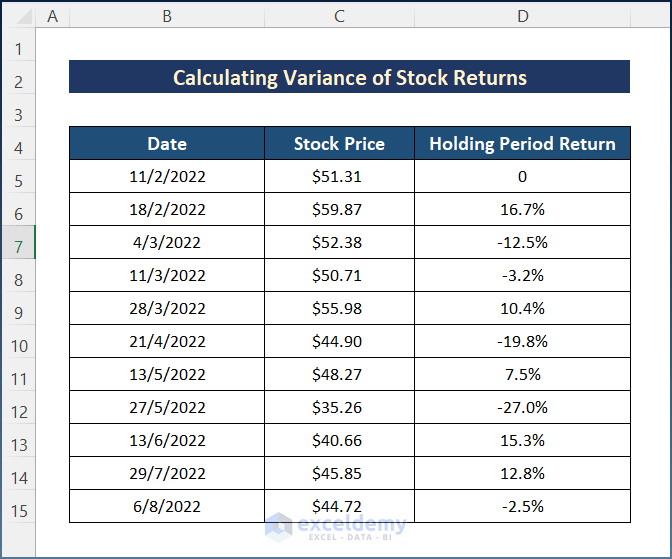
Here, you can calculate the Holding Period Return manually using the following formula:
=(C6-C5)/C5
Write the formula in cell D6 and apply the AutoFill tool to the entire column.
1. Calculate Variance of Stock Returns in Excel with VAR.S Function
In this example, I will apply the VAR.S function in order to calculate the variance of stock returns. It is the easiest process to complete the task. However, go through the steps below to do it easily.
📌 Steps:
- Initially, select cell C17 and write down the following formula.
=VAR.S(D5:D16)
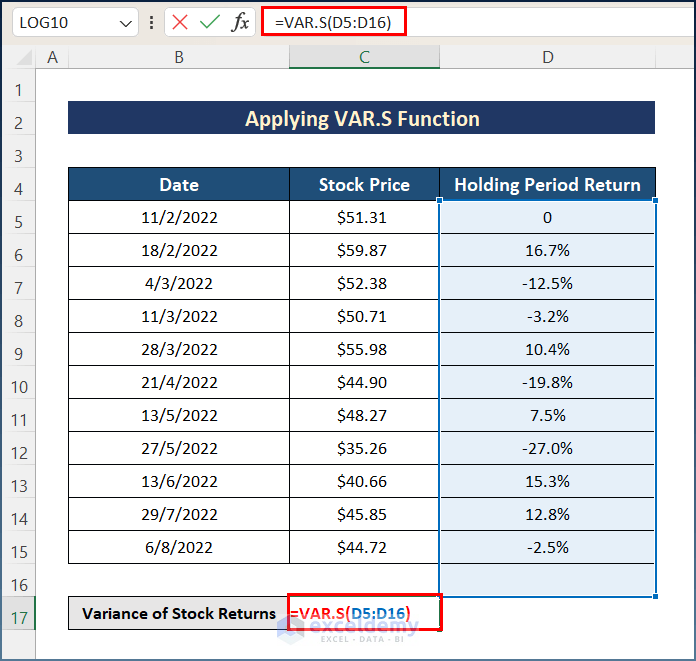
- Lastly, hit the Enter key to find the variance of stock returns.

Read More: How to Calculate Semi Variance in Excel
2. Create Basic Formula to Calculate Variance of Stock Returns in Excel
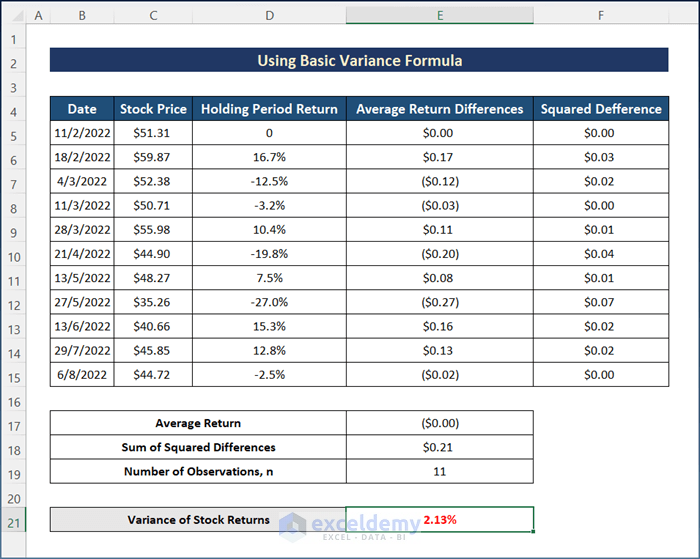
Furthermore, you can use the basic variance formula to calculate the variance of stock returns in Excel. In this case, I have used the general formula of the variance. However, I have utilized the previous dataset to calculate the variance. Hence, go through the below steps.
📌 Steps:
- Firstly, click on cell E17 and write the following formula.
=AVERAGE(D5:D15)

Here, I have used the AVERAGE function for the calculation.
- Secondly, select cell E5 and enter the formula below.
=D5-$E$17

- Thirdly, use the AutoFill tool for the whole column, and you will get Average Return Differences.

- Again, write the following formula on cell F5 and use the AutoFill tool in order to find the Squared Difference.
=E5^2

- After that, find the Sum of Squared Differences using the formula below on cell E18.
=SUM(F5:F15)

Here, I have used the SUM function.
- Now, press Enter and use the following formula to find the Variance of Stock Returns.
=E18/(E19-1)

- Finally, press the Enter key to get the final result.
Read More: How to Do Price Volume Variance Analysis in Excel
Download Practice Workbook
You can download the workbook used for the demonstration from the download link below.
Conclusion
These are all the steps you can follow to calculate the variance of stock returns in Excel. Hopefully, you can now easily create the needed adjustments. I sincerely hope you learned something and enjoyed this guide. Please let us know in the comments section below if you have any queries or recommendations.
Related Articles
- How to Calculate Budget Variance in Excel
- Budget vs Actual Variance Formula in Excel
- How to Calculate Variance Inflation Factor in Excel
- How to Calculate Schedule Variance Using Excel Formula
- How to Calculate Portfolio Variance in Excel
- How to Create Minimum Variance Portfolio in Excel
<< Go Back to Calculate Variance in Excel | Excel for Statistics | Learn Excel
Get FREE Advanced Excel Exercises with Solutions!
