Undoubtedly, calculating the schedule variance is a quintessential part of any project since it can be the difference between the success and failure of the project. Fortunately, Microsoft Excel can do most of the heavy lifting for you. With this intention, this article shows a step-by-step guide on how to calculate schedule variance formula in Excel. Moreover, we’ve also included a schedule variance calculator and lastly, we’ll also learn to compute the schedule variance percentage in Excel.
What Is Schedule Variance (SV)?
First and foremost, let’s acquaint ourselves with the term schedule variance.
In layman’s terms, schedule variance measures the difference between the actual advancement and the expected advancement of the project, hence it is an indication of the project’s performance.
For one thing, schedule variance lets a project manager quickly determine whether a project is on course by providing a helpful statistic. Additionally, it can also indicate possible issues early in the project.
Formula to Calculate Schedule Variance
The formula to calculate the schedule variance is as follows:
Schedule Variance (SV) = Budget Cost of Work Performed (BCWP) - Budget Cost of Work Scheduled (BCWS)
Here, a positive value of SV indicates the project is ahead of time whereas, a negative value of SV represents the project is behind schedule.
How to Calculate Schedule Variance Using Formula in Excel: 3 Easy Steps
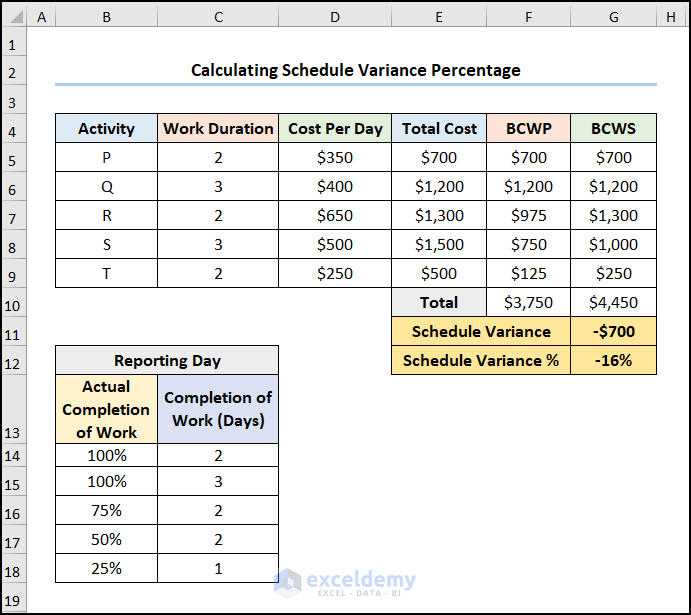
In this situation, consider the Project Management dataset shown in the B4:D9 cells which shows the Activity, the Work Duration in days, and the Cost per Day respectively. Additionally, we have the Reporting Day table in the B11:C17 cells which contains the percentage of Actual Completion of Work and the Completion of Work in days. Therefore, let’s glance at the steps below with easy and simple illustrations.

Here, we have used the Microsoft Excel 365 version, you may use any other version according to your convenience.
📌 Step 1: Calculate the Total Cost
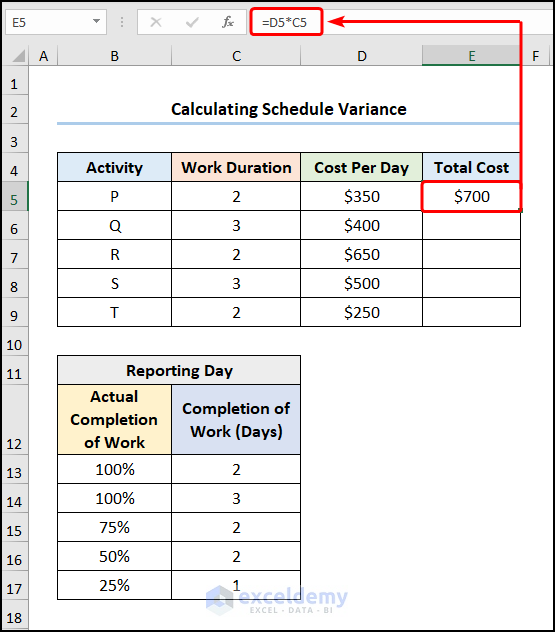
To begin with, we’ll calculate the Total Cost by multiplying the Work Duration in days by the Cost per Day in USD. So, just follow along.
- First, go to the E5 cell >> enter the formula given below.
=D5*C5
Here, the C5 and D5 cells refer to the Work Duration of 2 days and the Cost per Day of $350 respectively.
- Then, use the Fill Handle Tool to copy the formula into the cells below.
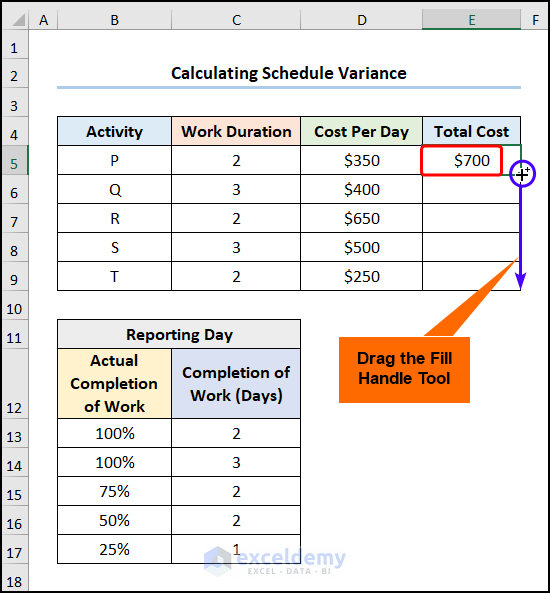
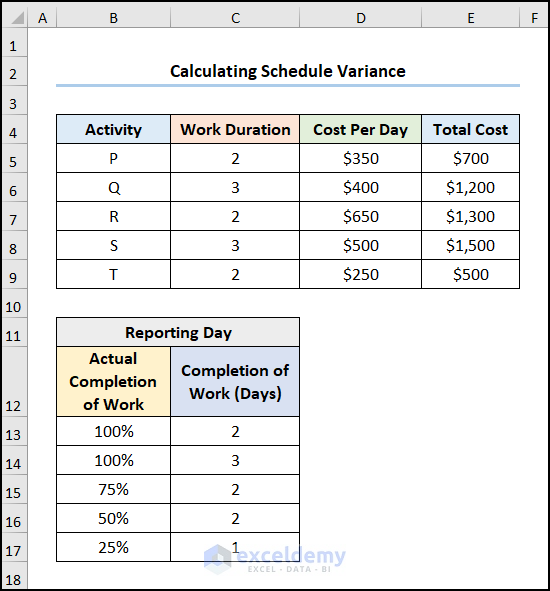
Now, your results should look like the image given below.
Read More: How to Calculate Semi Variance in Excel
📌 Step 2: Obtain BCWP and BCWS Values
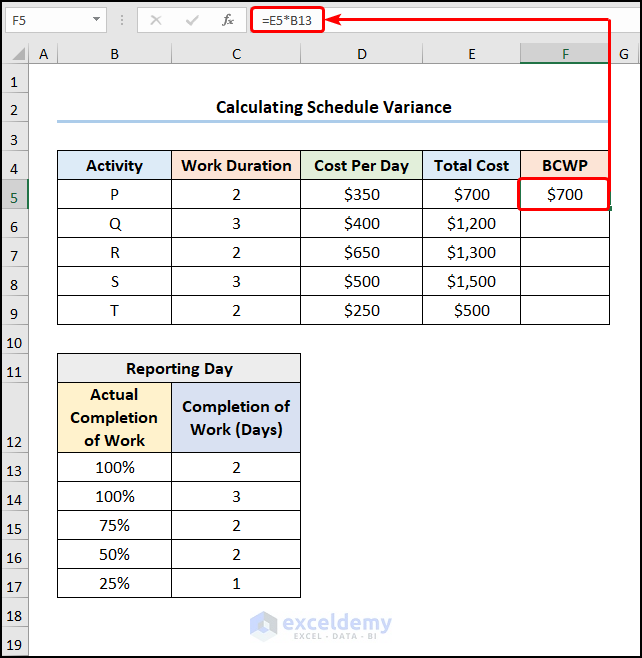
At this time, we’ll obtain the Budget Cost of Work Performed (BCWP) by computing the products of Total Cost and Actual Completion of Work (%) and the Budget Cost of Work Scheduled (BCWS) by multiplying the Cost Per Day and Completion of Work (Days) for the corresponding Activity.
- Second, move to the F5 cell >> type in the equation given below.
=E5*B13
In this equation, the B13 and E5 cells represent the Actual Completion of Work and the Total Cost.
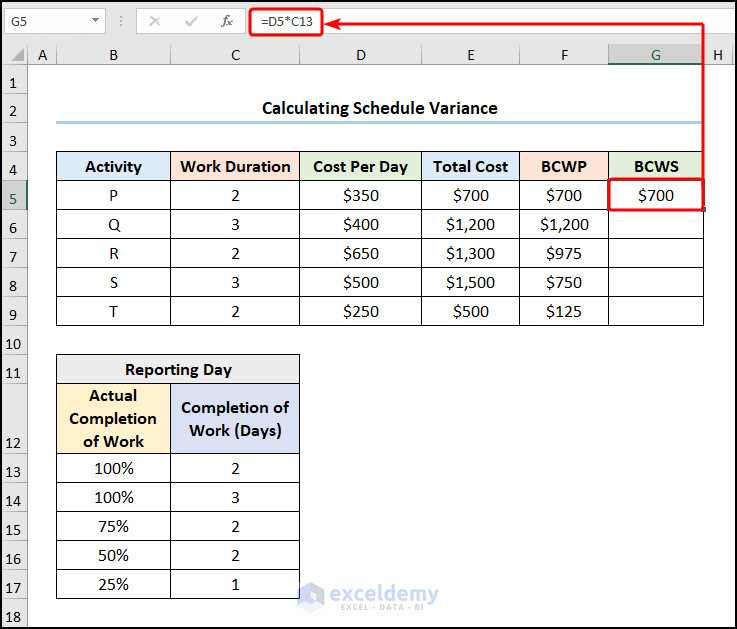
- In a similar style, navigate to the G5 cell >> insert the following expression.
=D5*C13
In this case, the C13 and D5 cells point to the Completion of Work and the Cost Per Day.
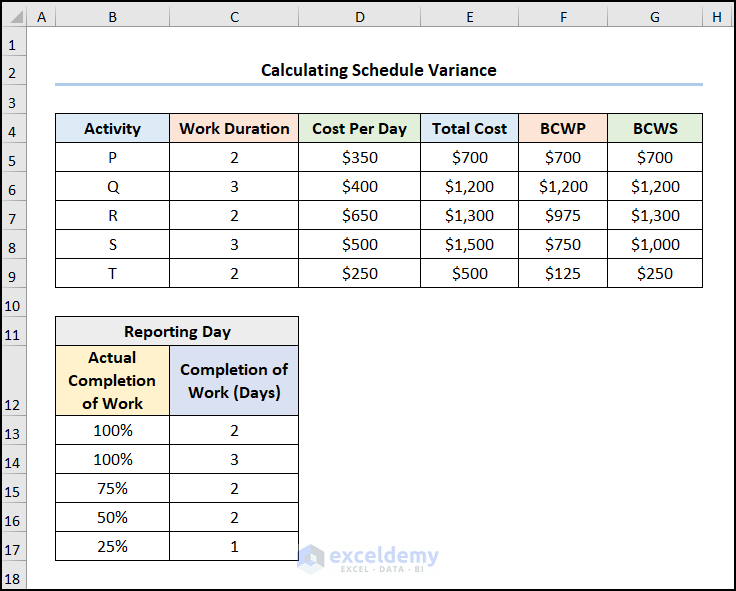
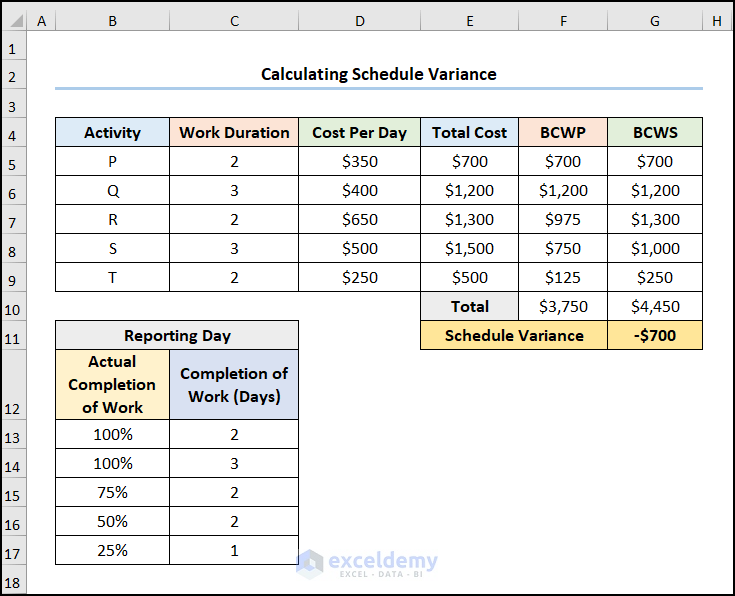
After completing the above steps, the output should look like the picture shown below.
Read More: Budget vs Actual Variance Formula in Excel
📌 Step 3: Compute Schedule Variance (SV)
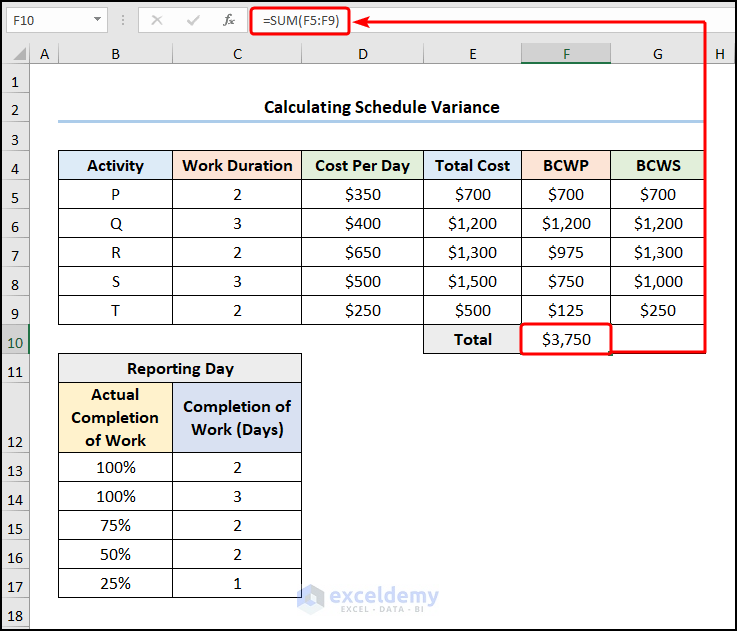
Finally, we’ll employ the SUM function to calculate the total BCWP and BCWS for the project. Hence, subtracting the BCWS from BCWP yields the schedule variance of the project in terms of USD.
- Third, jump to the F10 cell >> and type in the given formula into the Formula Bar.
=SUM(F5:F9)
For instance, the F5:F9 range of cells indicates the BCWP values.
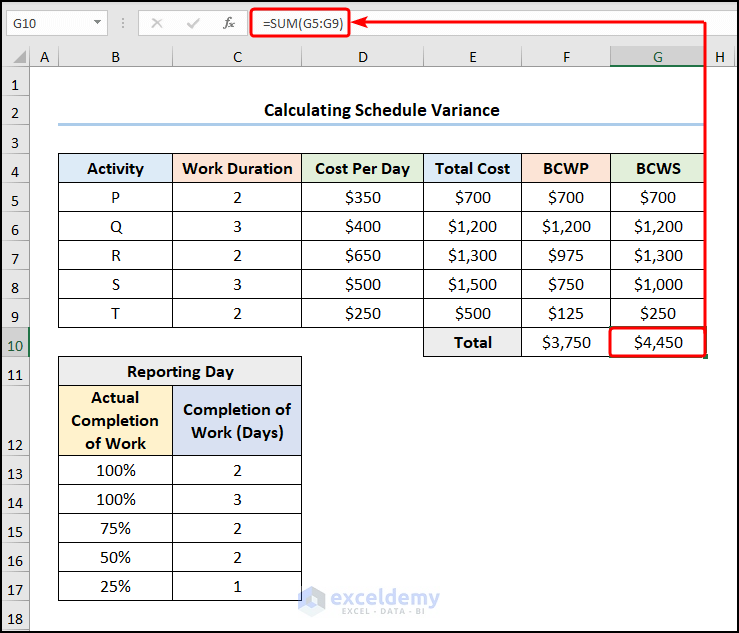
- Likewise, enter the formula into the G10 cell to get the total BCWS.
=SUM(G5:G9)
Here, the G5:G9 array refers to the BCWS values.
- Finally, compute the Schedule Variance using the expression provided below.
=F10-G10
Specifically, the F10 and G10 cells represent the total BCWP and BCWS respectively.
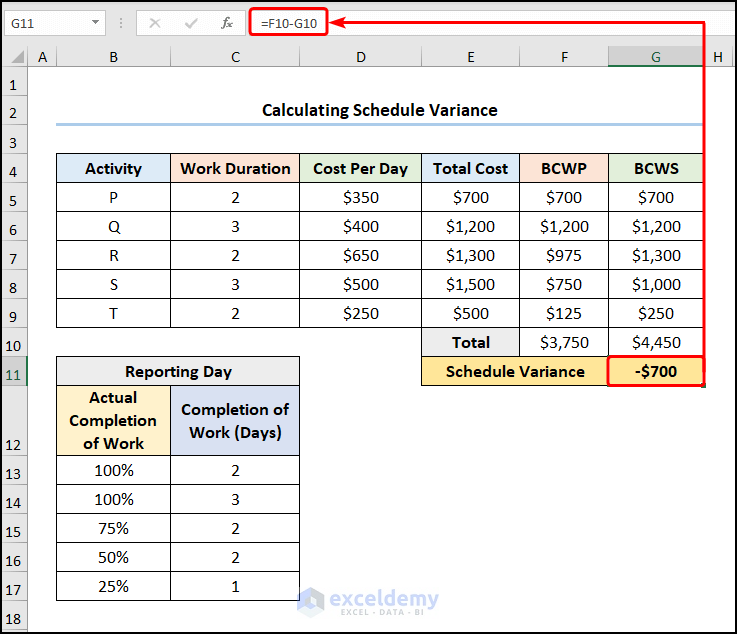
Here, the -$700 indicates that the project is running behind schedule.
Read More: How to Calculate Variance Inflation Factor in Excel
Applying Schedule Variance Calculator in Excel
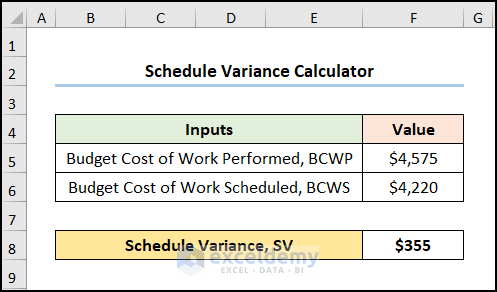
In the following section, we’ve constructed a simple Schedule Variance Calculator where you can enter the BCWP and BCWS values in order to get the Schedule Variance value.
On this occasion, we’ve chosen $4,575 and $4,220 as the values of BCWP and BCWS respectively. Following this, subtract the BCWS from BCWP to return the Schedule Variance of $355 which shows that the project is ahead of schedule.
Read More: How to Calculate Budget Variance in Excel
How to Calculate Schedule Variance Percentage in Excel
Generally, the schedule variance percentage is a metric that is calculated in conjunction with the schedule variance by dividing the SV by the BCWS. Therefore, let’s see it in action.
📌 Steps:
- In the first place, complete the steps shown in the previous method to generate the results shown in the screenshot below.
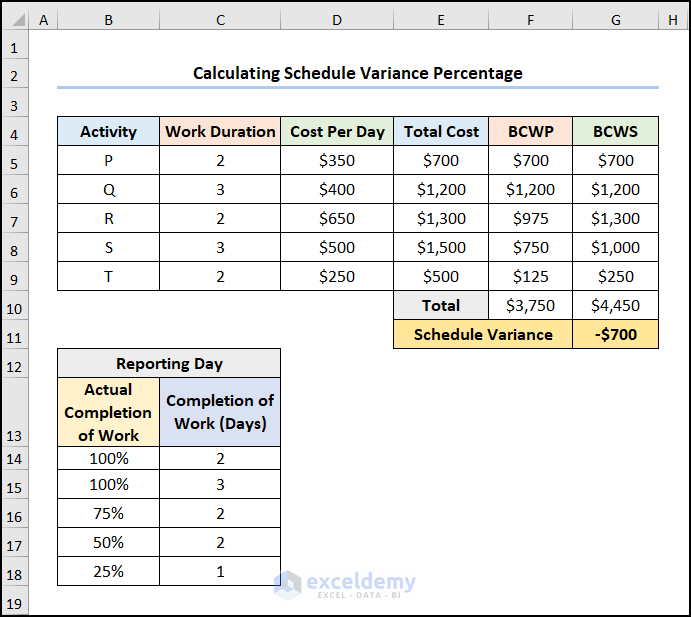
- Next, move to the G12 cell and type in the expression given below.
=G11/G10
In this expression, the G10 and G11 cells refer to the BCWS and the SV respectively.
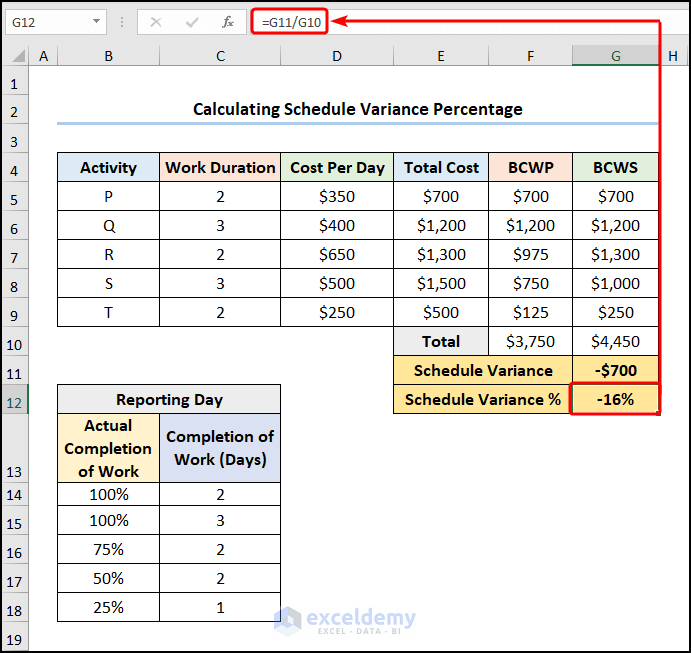
Consequently, the output should appear as the image given below.
Read More: How to Create Minimum Variance Portfolio in Excel
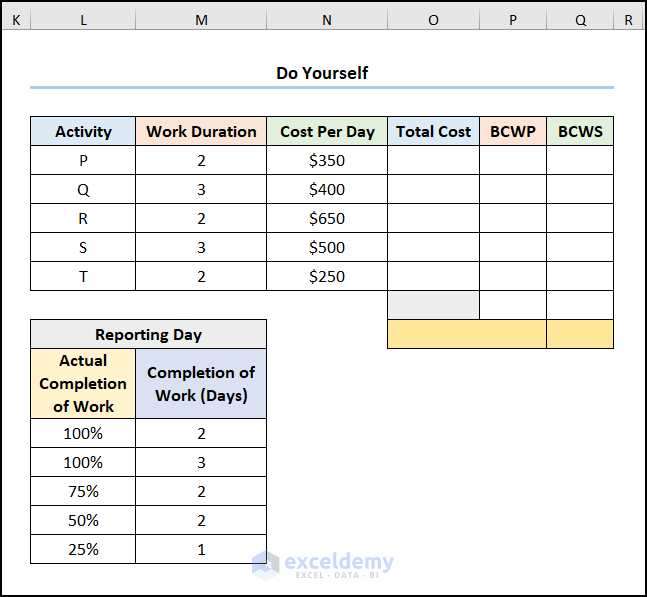
Practice Section
We have provided a Practice section on the right side of each sheet so you can practice yourself. Please make sure to do it by yourself.
Download Practice Workbook
Conclusion
To sum up, we hope this tutorial has provided you with helpful knowledge on how to calculate the schedule variance formula in Excel. Now, we recommend you apply all this know-how to the practice dataset by downloading the practice workbook. In addition, feel free to comment and provide your valuable feedback.
Related Articles
- How to Calculate Portfolio Variance in Excel
- How to Calculate Variance of Stock Returns in Excel
- How to Do Price Volume Variance Analysis in Excel
<< Go Back to Calculate Variance in Excel | Excel for Statistics | Learn Excel
Get FREE Advanced Excel Exercises with Solutions!
