Semi Variance evaluates the variation among the observations in a sample. Semi-variance deals with the observations that are below the average of the dataset, or mean, or a target value only. The general formula to calculate semi-variance is:
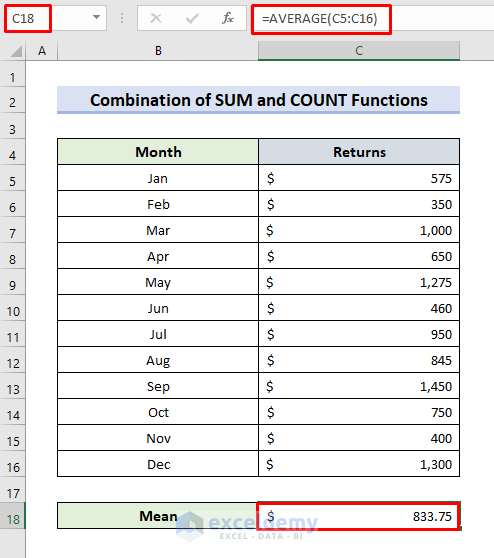
The dataset below contains month-wise investment returns.
To calculate semi-variance and estimate the downside risk of this investment:

Method 1 – Combine the SUM and the COUNT Functions to Calculate Semi Variance in Excel
STEPS:
- Select C18.
- Use the formula:
=AVERAGE(C5:C16)- Press Enter.
- The AVERAGE function will return the average of the dataset.
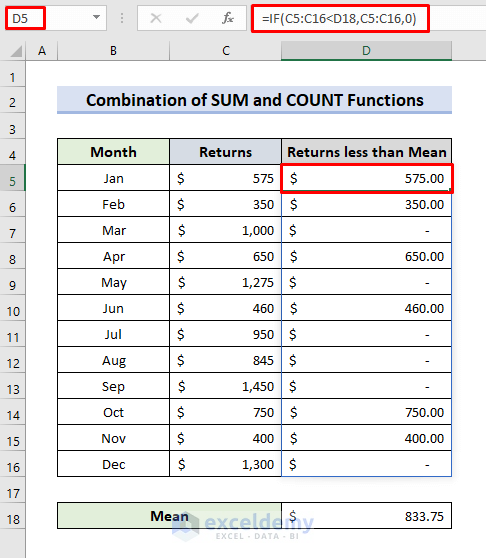
- Click D5.
- Enter the formula:
=IF(C5:C16<D18,C5:C16,"")- Press Enter.
- Drag down the Fill Handle.
- The IF function returns values smaller than the average: D18.
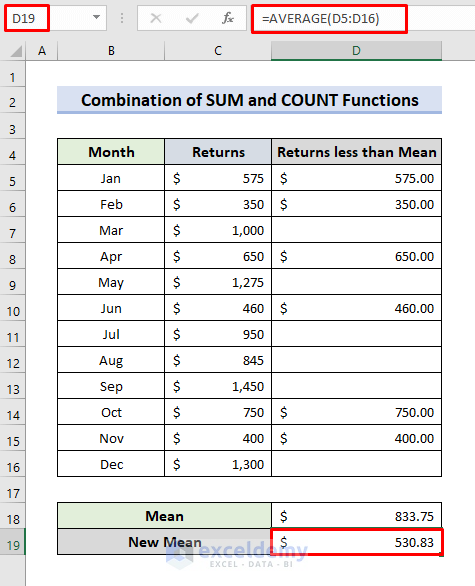
- Select D19.
- Use the formula:
=AVERAGE(D5:D16)- The new mean of the returns less than the original sample average is returned.
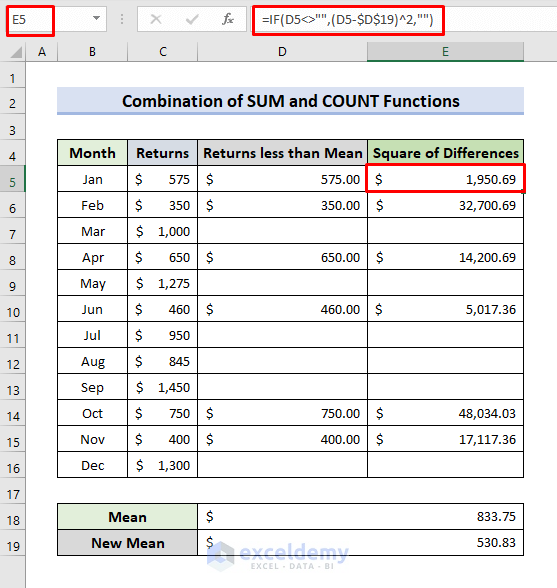
- Click E5.
- Enter the formula:
=IF(D5<>"",(D5-$D$19)^2,"")- Press Enter and apply the AutoFill.
- The square of the differences will be returned.
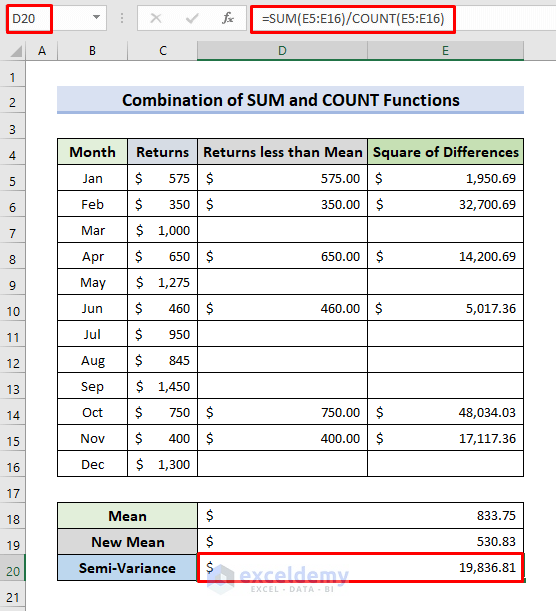
- To calculate the semi-variance, select D20.
- Enter the formula:
=SUM(E5:E16)/COUNT(E5:E16)- Press Enter.
- The COUNT function determines the total count of the cells with numbers in E5:E16.
- The semi-variance is displayed.
Read More: How to Calculate Variance of Stock Returns in Excel
Method 2 – Applying the SUM, IF, and COUNTIF Functions to compute the Semi Variance
STEPS:
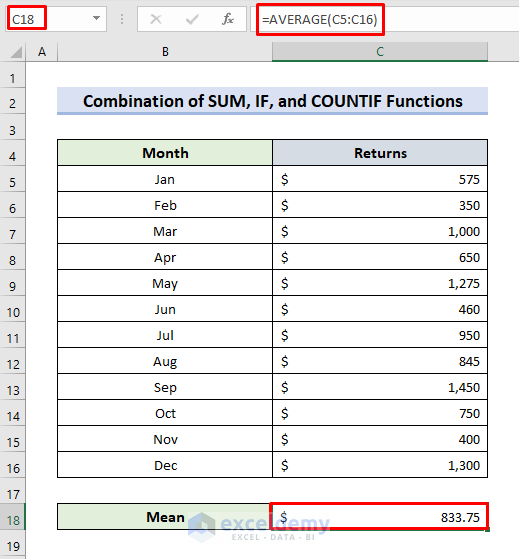
- Select C18.
- Enter the formula:
=AVERAGE(C5:C16)- The sample mean is returned.
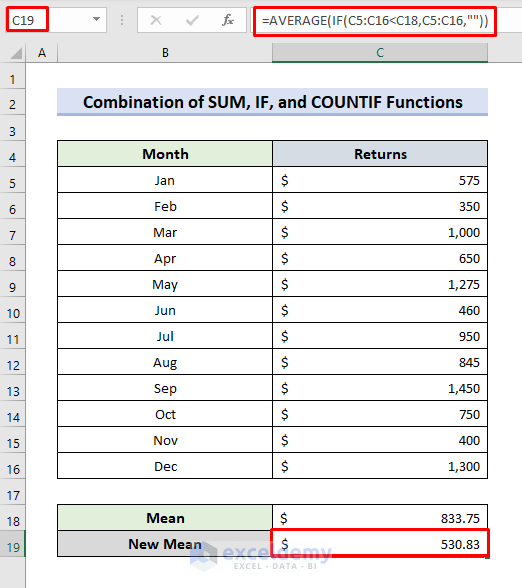
- Select C19.
- Enter the formula:
=AVERAGE(IF(C5:C16<C18,C5:C16,""))- The IF function returns values smaller than the sample mean.
- The AVERAGE function calculates the average of the IF(C5:C16<C18,C5:C16,””) formula outputs.
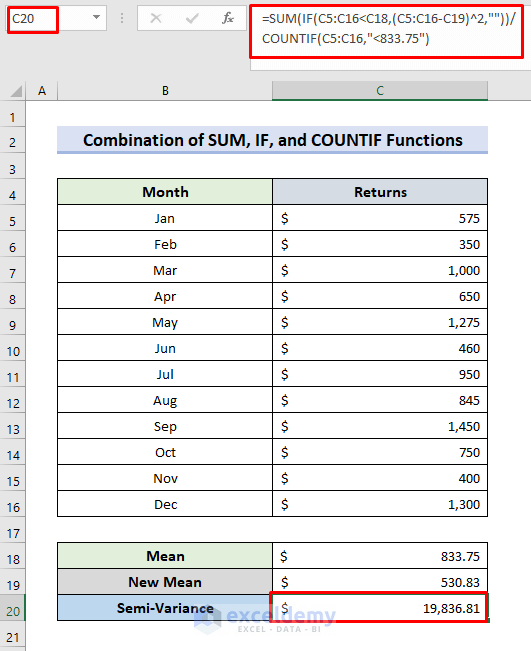
- In C20, use the formula:
=SUM(IF(C5:C16<C18,(C5:C16-C19)^2,""))/COUNTIF(C5:C16,"<833.75")- Press Enter.
- The IF function determines the square of the differences between each value in C5:C16 smaller than the old mean (C18) and the new mean in C19.
- The SUM function sums the IF(C5:C16<C18,(C5:C16-C19)^2,””) formula outputs.
- The COUNTIF function counts the number of cells smaller than 75 or the old mean.
- This is the semi-variance.
Read More: Budget vs Actual Variance Formula in Excel
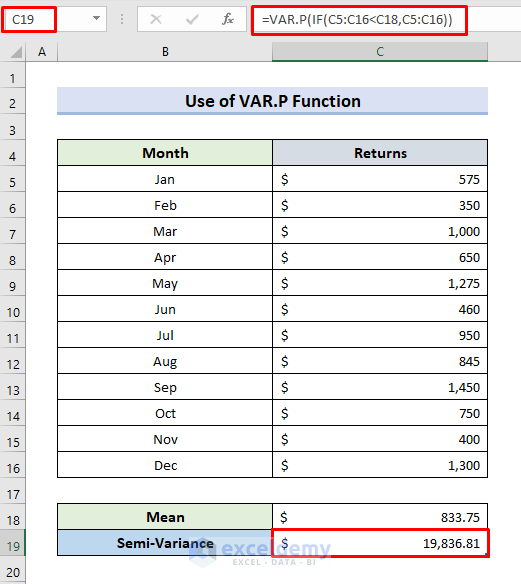
Method 3 -Using the VAR.P Function to Calculate the Semi Variance in Excel
STEPS:
- Calculate the mean in C18, following the steps described in the previous methods.
- Select C19.
- Enter the formula:
=VAR.P(IF(C5:C16<C18,C5:C16))- Press Enter.
- The IF function returns the values less than C18 (the sample mean).
- The semi-variance is displayed.
Read More: How to Do Price Volume Variance Analysis in Excel
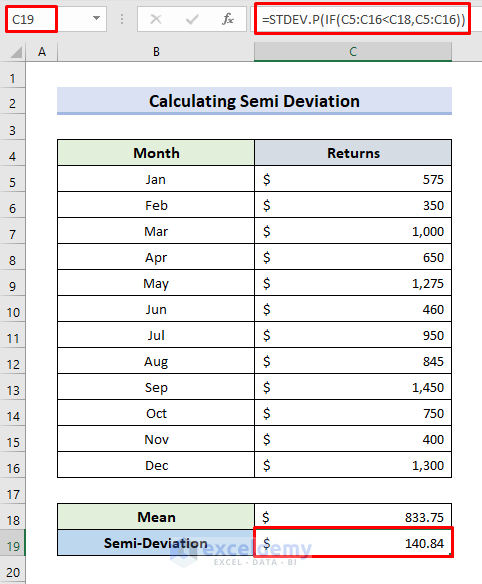
How to Calculate the Semi Deviation in Excel
STEPS:
- Find the mean in C18.
- Select C19.
- Enter the formula:
=STDEV.P(IF(C5:C16<C18,C5:C16))- Press Enter.
- The STDEV.P function calculates the standard deviation.
- The IF function to finds the semi-deviation and returns values smaller than C18 (the sample mean).
- The semi-deviation is displayed.
Read More: How to Calculate Portfolio Variance in Excel
Download Practice Workbook
Download the workbook and practice.
Related Articles
- How to Calculate Variance Inflation Factor in Excel
- How to Create Minimum Variance Portfolio in Excel
- How to Calculate Schedule Variance Using Excel Formula
- How to Calculate Budget Variance in Excel
<< Go Back to Calculate Variance in Excel | Excel for Statistics | Learn Excel
Get FREE Advanced Excel Exercises with Solutions!
