What Is Portfolio Variance?
Portfolio variance is a statistical measure in modern investment theory. It quantifies the dispersion of actual returns within a portfolio relative to its mean return. To calculate portfolio variance, we consider both the standard deviation of each security in the portfolio and the correlation between those securities.
The Portfolio Variance Formula
We can compute portfolio variance using the following formula:
Portfolio Variance = W1^2 * σ1^2 + W2^2 * σ2^2 + 2 * ϼ1,2 * W1 * W2 * σ1 * σ2Where,
W = represents the portfolio weight, calculated by dividing the dollar value of a security by the total dollar value of the portfolio.
σ^2 = denotes the variance of an asset.
ϼ = represents the correlation between two assets.
Method 1 – Using the Conventional Formula
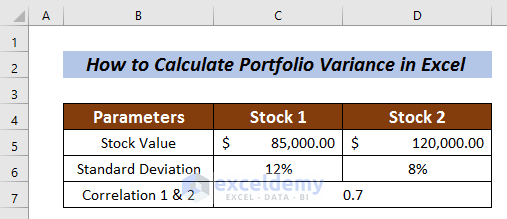
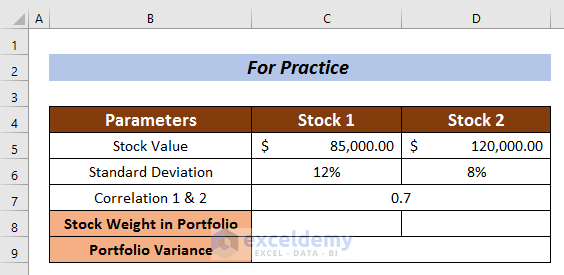
We’ll use a Dataset for Stock 1 and Stock 2 with the values of Stock Value, Standard Deviation and Correlation 1 & 2.
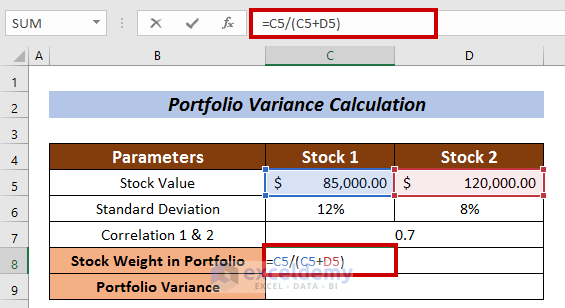
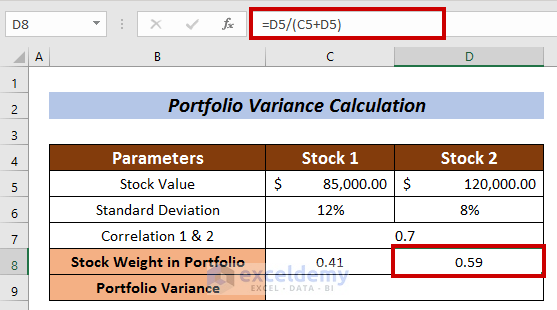
Step 1 – Calculation of Stock Weight in Portfolio
- Select a cell (Cell C8) to measure Stock weight.
- Enter the following formula:
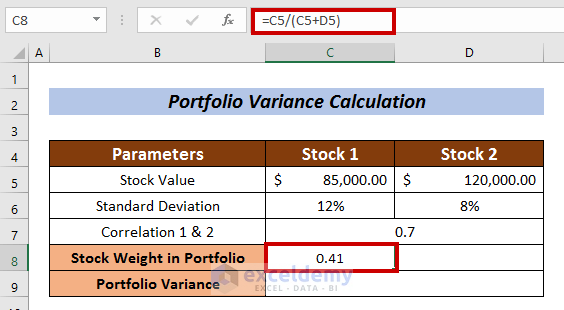
=C5/(C5+D5)Here, the stock value of Stock 1 is divided by the total stock value.
- Press ENTER.
- To measure the Stock Weight in Portfolio for Stock 2, enter in following formula in D8:
=D5/(C5+D5)Where, the stock value of Stock 2 is divided by the total stock value.
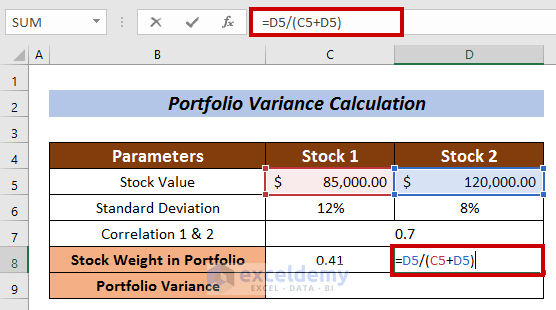
- Press ENTER.
Step 2 – Portfolio Variance Calculation
- Enter the following formula in Cell C9:
=C8^2 *(C6^2) +D8^2*(D6^2)+2*C7*C8*D8*C6*D6Where,
C8 = Portfolio Weight of Stock 1
C6 = Standard Deviation of Stock 1
D8 = Portfolio Weight of Stock 2
D6 = Standard Deviation of Stock 2
C7 = Correlation between Stock 1 and Stock 2
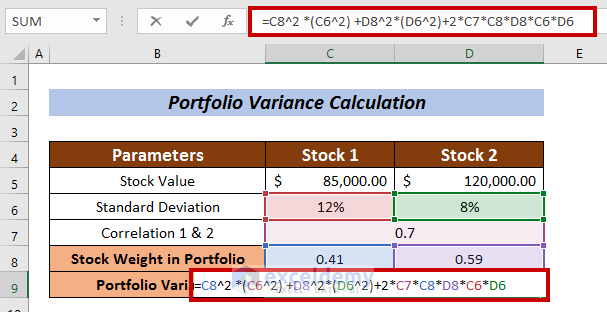
- Press ENTER to calculate the portfolio variance using the conventional formula.
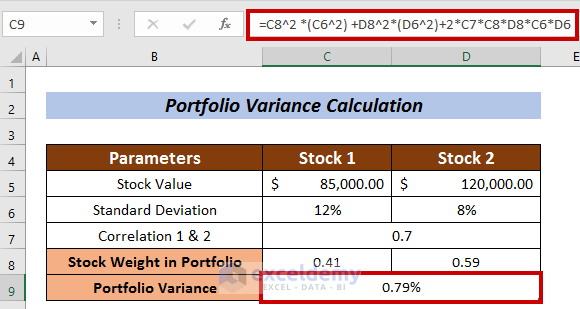
We calculated the Portfolio Variance using the conventional formula.
Read More: How to Calculate Semi Variance in Excel
Method 2 – Using the MMULT Function
The MMULT function provides an interesting approach to compute portfolio variance. It leverages matrix multiplication to achieve this. Here’s how you can apply it:
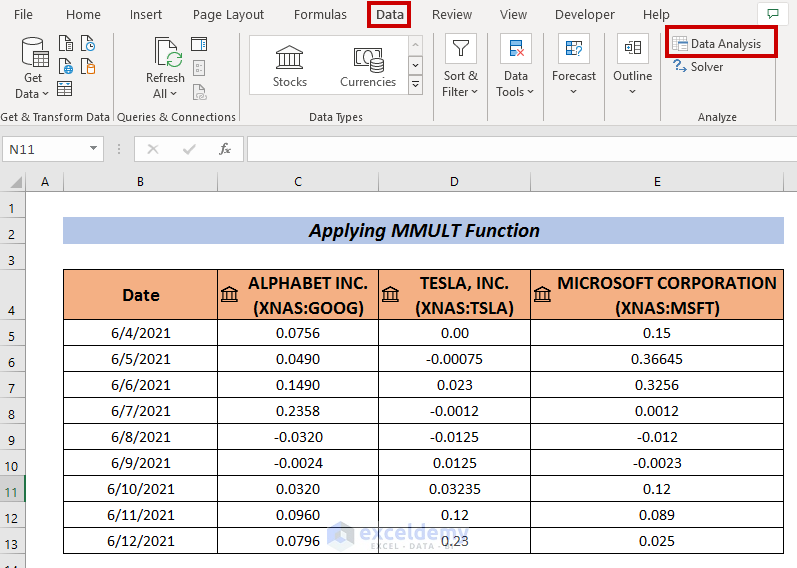
We’ll use a dataset of portfolio returns for the companies GOOGLE, TESLA, and Microsoft.
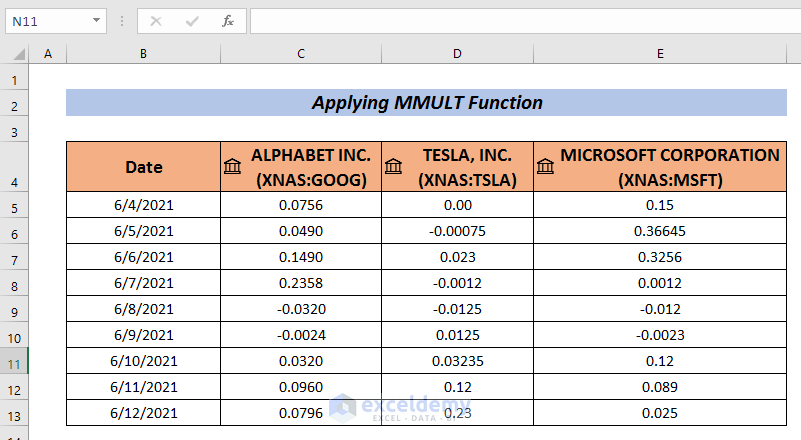
Step 1 – Collect Portfolio Returns Data
- Gather data on portfolio returns for the companies (e.g., Google, Tesla, Microsoft).
- Create a dataset with returns for each company.
Step 2 – Calculate Covariance
- Go to the Data tab in Excel.
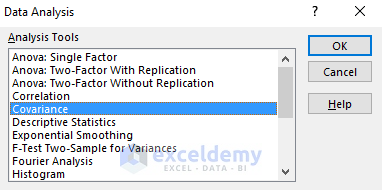
- Select Data Analysis.
- Choose Covariance from the available options.
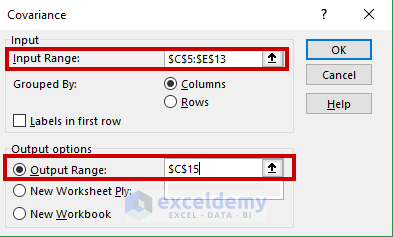
A Covariance box will appear.
- Enter your data range (e.g., C5:E13) and select a cell for the covariance output (e.g., C15).
- Click OK to obtain the covariances.
We will have the Covariances on the selected cell.
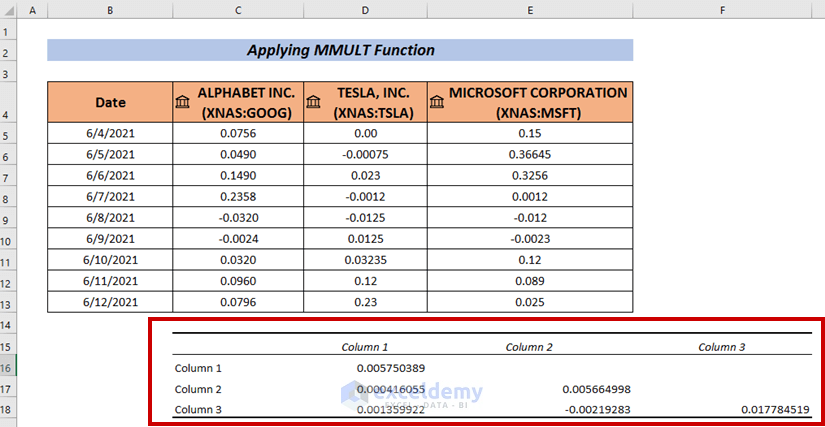
Step 3 – Modify the Dataset
- Add company names both horizontally and vertically.
- Express stock weights as percentages in the dataset.
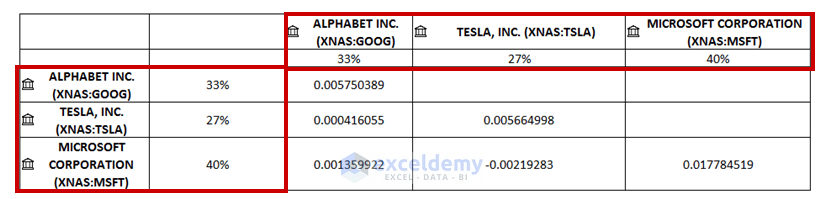
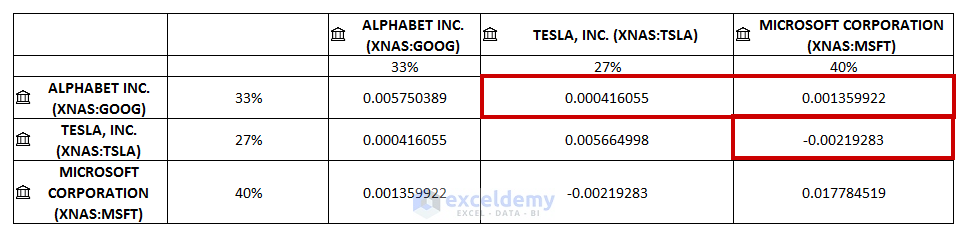
Step 4 – Fill in Empty Cells
- Place the relevant covariances in the empty cells.
Step 4 – Calculate Portfolio Variance
- Enter the following formula to calculate the portfolio variance:
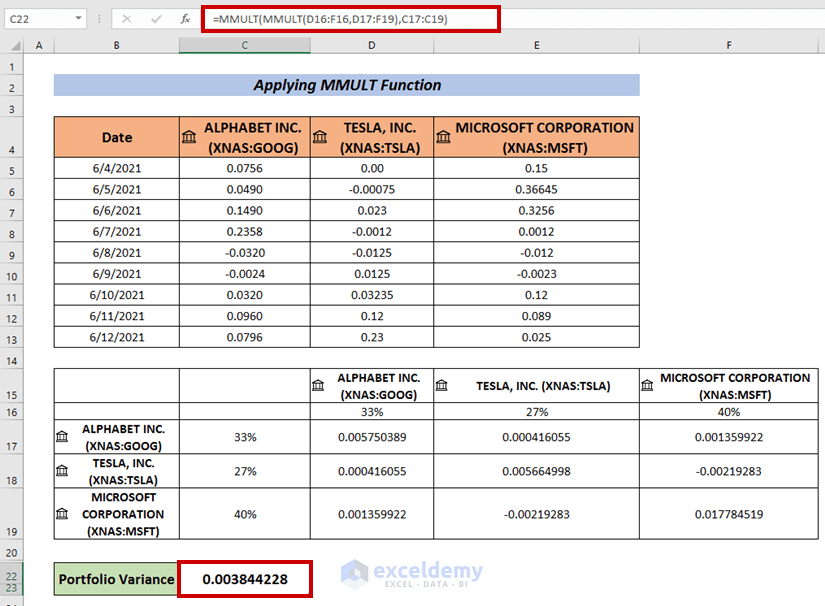
=MMULT(MMULT(D16:F16,D17:F19),C17:C19)Where,
-
- The first matrix multiplication is between the arrays D16:F16 and D17:F19.
- The second matrix multiplication involves the result from the first multiplication and the array C17:C19.
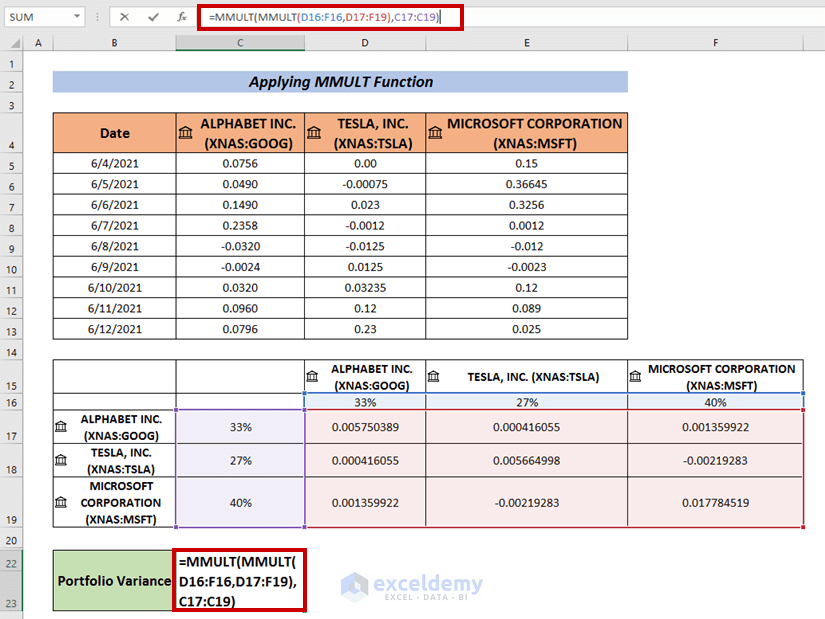
- Press ENTER to obtain the Portfolio Variance.
Read More: How to Create Minimum Variance Portfolio in Excel
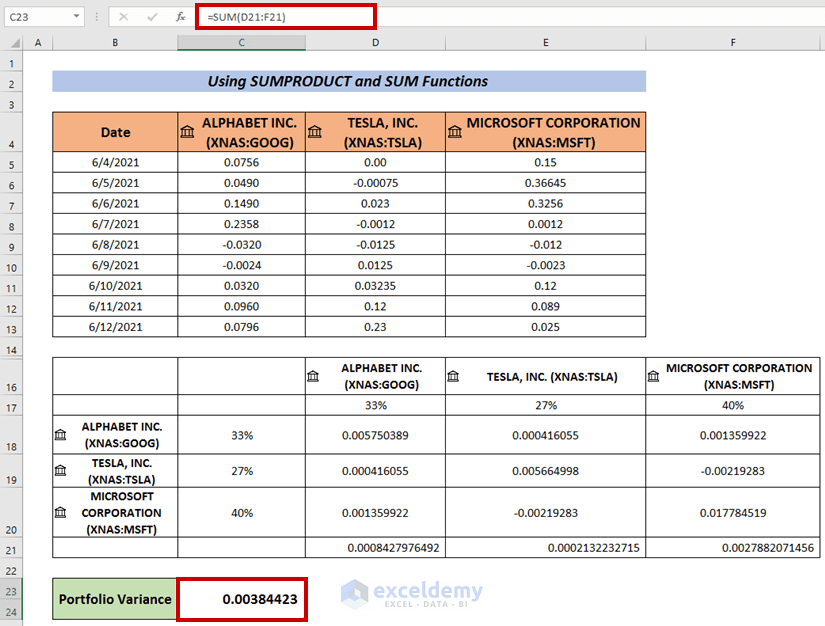
Method 3 – Using SUMPRODUCT and SUM Functions
Step 1 – Compute Variance
- Follow the same procedure as before to find the variances.
Step 2 – Calculate Portfolio Variance
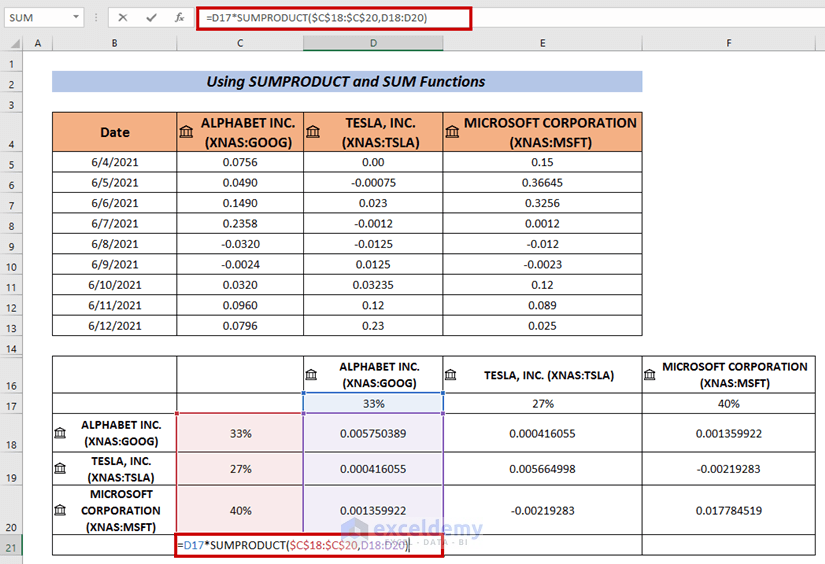
- Select a cell and enter the following formula:
=D17*SUMPRODUCT($C$18:$C$20,D18:D20)Where,
-
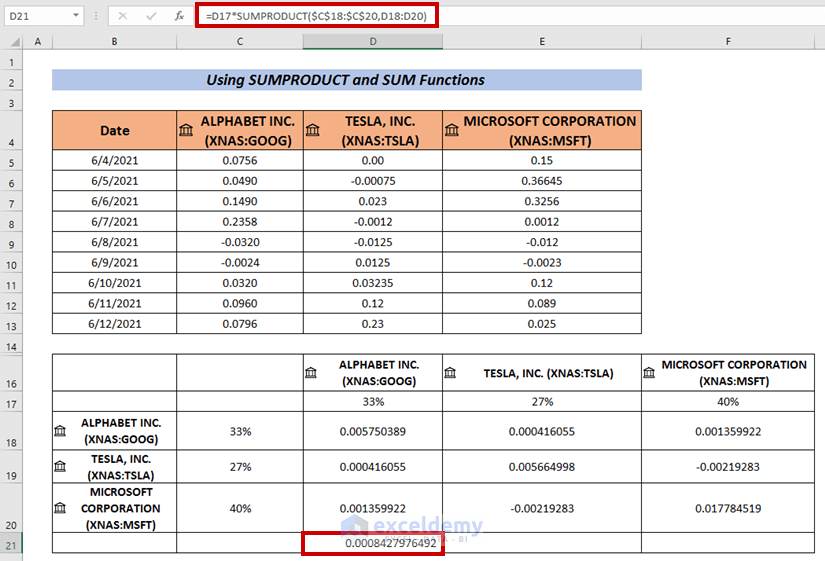
- The SUMPRODUCT function multiplies the arrays C18:C20 and D18:D20 element-wise.
- Press ENTER.
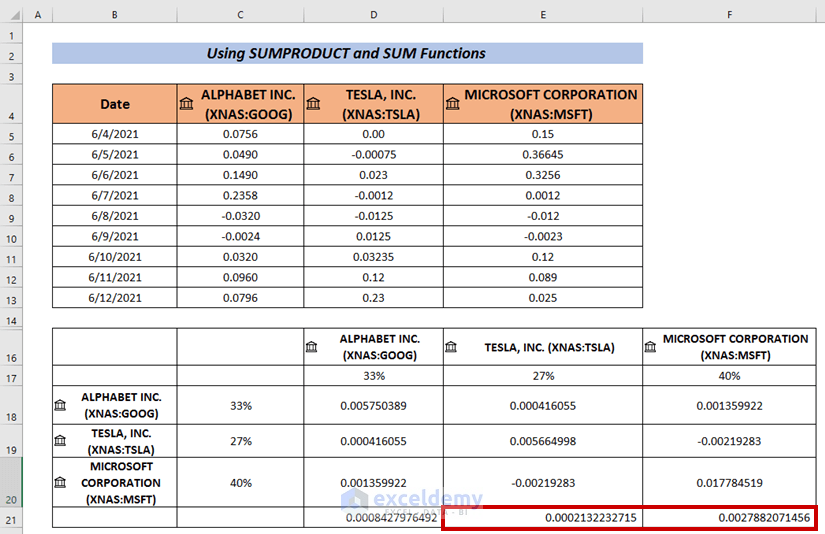
- Use the Fill Handle to AutoFill the remaining cells (i.e. E21 & E22).
- Apply the SUM Function to calculate the summation of the output.
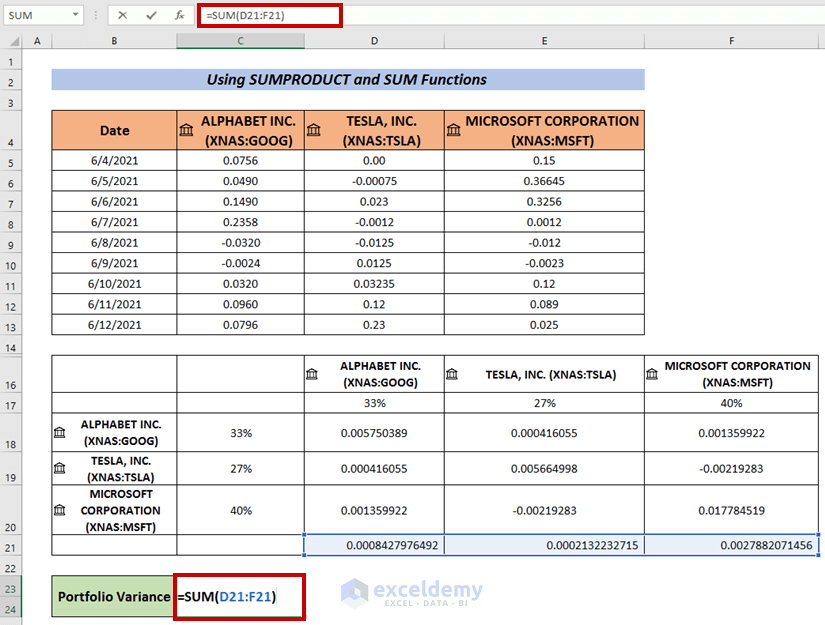
- Press ENTER.
Read More: How to Calculate Variance Inflation Factor in Excel
Practice Section
Use the workbook to practice these methods.
Download Practice Workbook
You can download the practice workbook from here:
Related Articles
- How to Calculate Budget Variance in Excel
- Budget vs Actual Variance Formula in Excel
- How to Calculate Variance of Stock Returns in Excel
- How to Do Price Volume Variance Analysis in Excel
- How to Calculate Schedule Variance Using Excel Formula
<< Go Back to Calculate Variance in Excel | Excel for Statistics | Learn Excel
Get FREE Advanced Excel Exercises with Solutions!
