Variance is one of the most useful topics in statistics. It gives you the measurement of how the data are spread around the mean. It calculates the distribution by looking at all the data. In this article, you will learn 2 ways to calculate sample variance in Excel.
What Is Sample Variance?
Normally the variance is calculated by dividing the square of the difference in the mean by the number of the population. In the sample variance, a sample is a chosen number of samples taken from a population.
For instance, if you want to measure American people’s heights, it won’t be practical (from either a monetary or a time standpoint) for you to calculate the heights of each person in the US population.
In this case, you need to take a sample of the population, such as 1000 people, and use this sample size to calculate the heights of the total population. The sample variance assists you to find the dispersion of your heights.
1. Calculating Sample Variance by Applying Basic Mathematical Formula in Excel
The textbook formula for the sample variance is given in the following way.
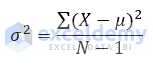
Here,
- μ is the arithmetic mean
- X is the individual value
- N is the size of the population
- σ2 is the sample variance
We want to calculate the sample variance of the 5 data (Individual Value, X). We have 2 columns which are for Deviation about the Mean (X-μ) and square of the Deviation about the Mean (X-μ)^2. Now, follow the steps below.
📌 Steps:
- First, determine the total number of data, in this example, N=5.
- Now, for computing the arithmetic mean for the individual values use the following formula,
=AVERAGE(C5:C9)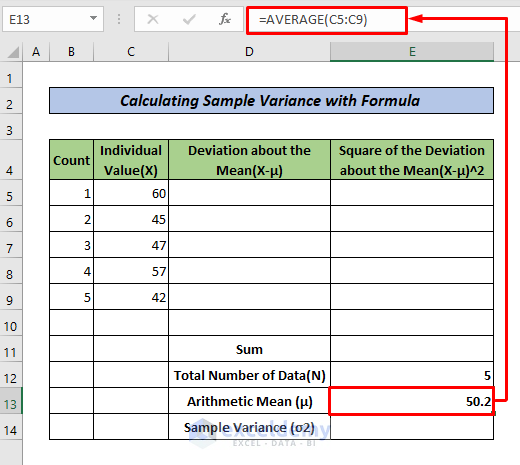
- To get deviation about the mean (X-μ), in cell D5, type the following formula, then press ENTER, and drag the Fill Handle to D9.
=C5-$E$13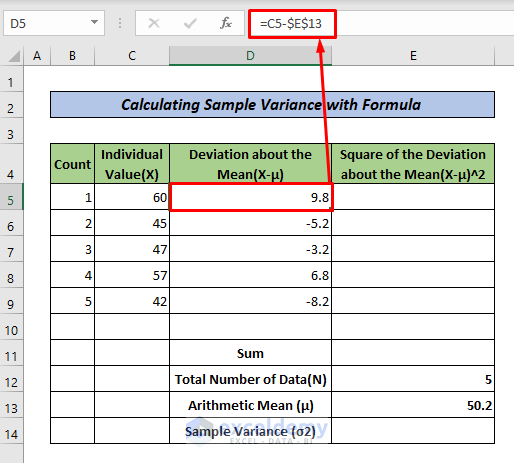
- To get the square of the deviation about the mean (X-μ)^2, in cell E5, copy the following formula, press ENTER, and drag the Fill Handle to the remaining cells.
=D5^2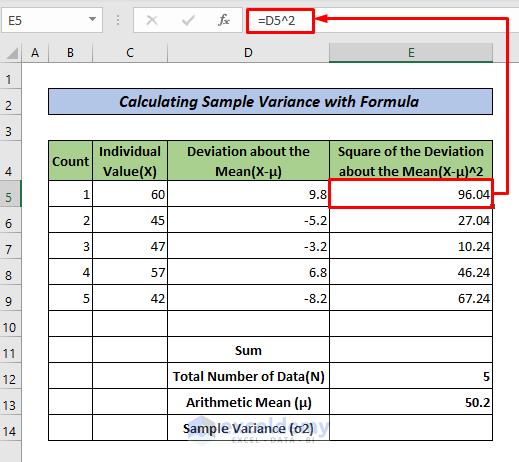
- To calculate the sum of the squares of the deviation about the mean (X-μ)^2, use the following formula in cell E11,
=SUM(E5:E9)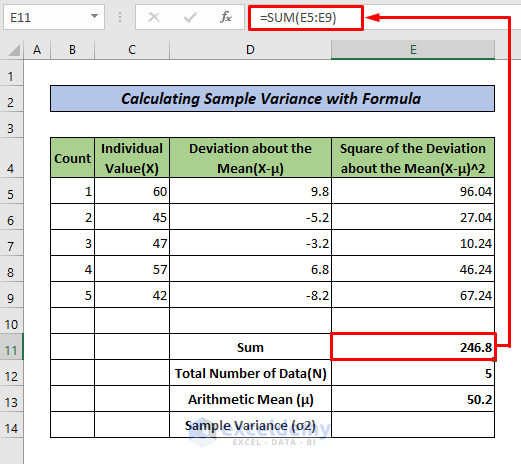
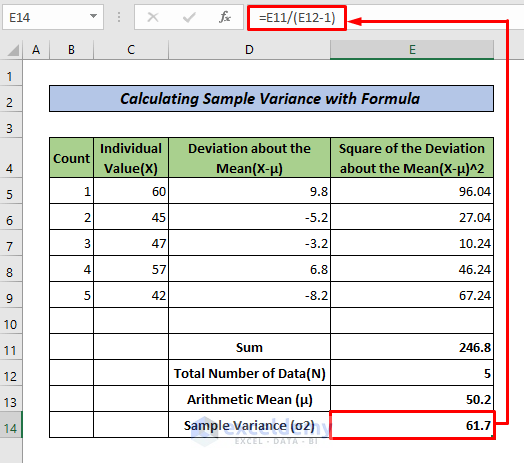
- Finally, to get the sample variance we need to divide the sum of the squares of the deviation about the mean (X-μ)^2 by the (N-1) and copy the following formula into cell E14.
=E11/(E12-1)Here is the result,
Read More: How to Calculate Mean Variance and Standard Deviation in Excel
2. Calculating Sample Variance Using VAR.S Function in Excel
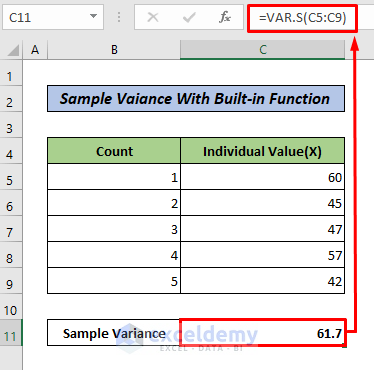
In order to calculate sample variance in Excel, we will use the built-in function VAR.S. In order to apply this function, just follow the steps below.
📌 Steps:
- First, in your dataset, select a cell (In this example, C11) where you want to put your Sample Variance value. Then, type the following formula into this cell, and finally, press ENTER.
=VAR.S(C5:C9)Here is the result.
Read More: How to Find Population Variance in Excel
Download Practice Workbook
You can download the following practice workbook that we have used to prepare this article.
Conclusion
In this tutorial, I have discussed 2 ways to calculate sample variance in Excel. I hope you found this article helpful. Please, drop comments, suggestions, or queries if you have any in the comment section below.
Related Articles
- How to Calculate Percentage Variance between Two Numbers in Excel
- How to Calculate Pooled Variance in Excel
- How to Calculate Coefficient of Variance in Excel
- How to Find the Variance of a Probability Distribution in Excel
- How to Do Variance Analysis in Excel
- How to Apply Variance Formula in Excel to Get Plus-Minus Results
<< Go Back to Calculate Variance in Excel | Excel for Statistics | Learn Excel
Get FREE Advanced Excel Exercises with Solutions!
