In the era of Data Analysis, you may need to do variance analysis in Excel. You can use One-way ANOVA or Two-way ANOVA to do variance analysis in Excel. I am showing the procedure in this article with clear steps illustrations and explanations of the outcomes of ANOVA so you can easily do variance analysis in Excel and make a variance report.
What Is ANOVA (Analysis of Variance) in Statistics?
Analysis of Variance (ANOVA) is a statistical method that divides the observed possible factors within a dataset into two sections:
- Systematic Factors: They have a statistical impact on the supplied data set.
- Random factors: They have no statistical impact on the supplied data set.
Data Analysts employ the ANOVA test to examine the impact of independent factors on the dependent variable. So, they can decide which factors to take for further analysis and which to reject.
The Formula for ANOVA Is:
where:
F=ANOVA coefficient
MST=Mean sum of squares due to treatment
MSE=Mean sum of squares due to error
The Outcome of Analysis of Variance ANOVA
ANOVA is the first stage in determining which factors influence a particular data set. After the test is completed, an analyst does extra testing on the methodological factors that measurably impact the inconsistency of the data set. He uses the ANOVA test findings in an f-test to create extra data that is relevant to the proposed regression analysis. The ANOVA test compares more than two data sets at the same time to see whether there is a link between them.
One-Way ANOVA vs. Two-Way ANOVA
ANOVA is of two types: One-way or unidirectional and Two-way. The way relates to the number of independent variables in a variance analysis test.
- In Two-Way ANOVA, there are multiple dependent variables and in One-Way, there will be one dependent variable.
- One-Way ANOVA calculates the effect of one single factor on a single variable. And it checks whether all the sample data sets are of same or not.
- One-way ANOVA determines the significant differences between the average means of multiple independent variables.
- Two-way ANOVA determines the effect of multiple independent factors on a single dependent factor. So, you can decide which factors you can choose for further analysis.
For Example:
- An educational institution evaluates the student performance compared with the quality of teachers then it will use One-way ANOVA.
- If you calculate satisfaction levels among certain types of professions and want to see the variance then you will use One-way ANOVA.
- If you want to know the effect of factors on the satisfaction level of a profession, you will use Two-Way ANOVA. Here satisfaction level is the dependent variable and factors like work environment, work pressure, employment type, etc will be the independent factors here.
Variance Analysis in Excel with One-Way ANOVA: Step-by-Step Procedure
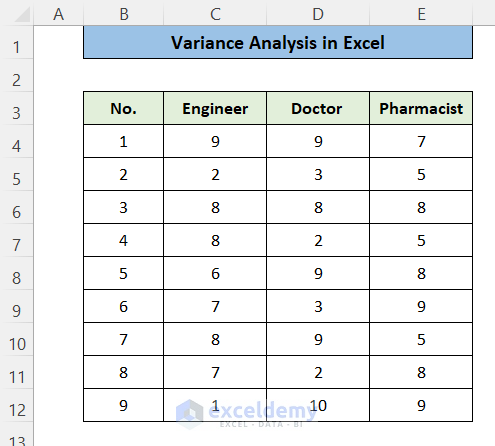
To do variance analysis, you should have a data set first. Here, suppose you have a dataset that contains data on the satisfaction level of people in various professions. Here is a list of 9 people from each profession.
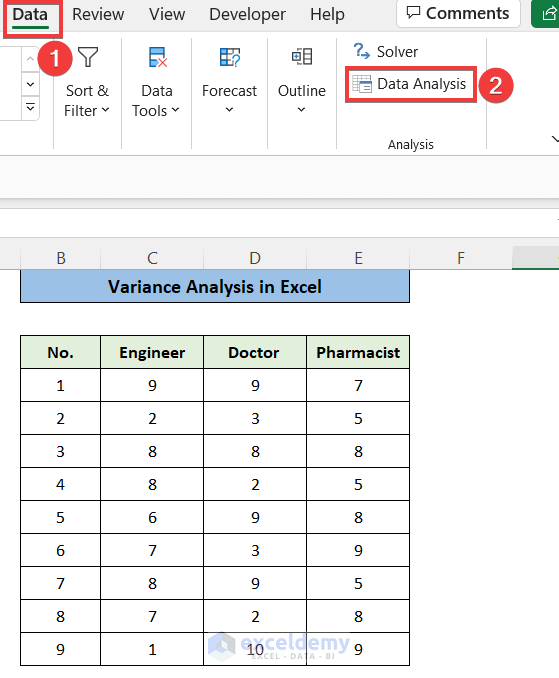
Step 1: Go to Data Analysis Option
- At first, go to the Data tab in the top ribbon,
- Select the Data Analysis tool
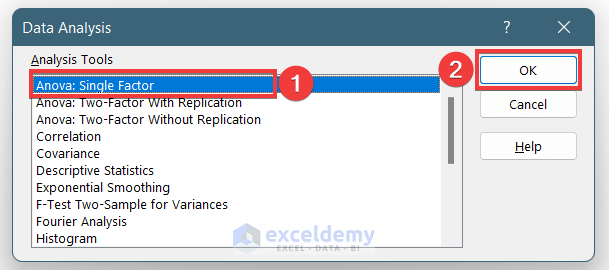
Step 2: Select ‘Anova: Single Factor’
- Now, the Data Analysis window will appear.
- Here, select the Anova: Single Factor option.
- Then press OK.
Final Step: Set Input Range and Press OK
- Now, the Anova: Single Factor window will open.
- Here, select the cells in the Input Range box.
- Mark the box named “Labels in First Row”
- And press OK.
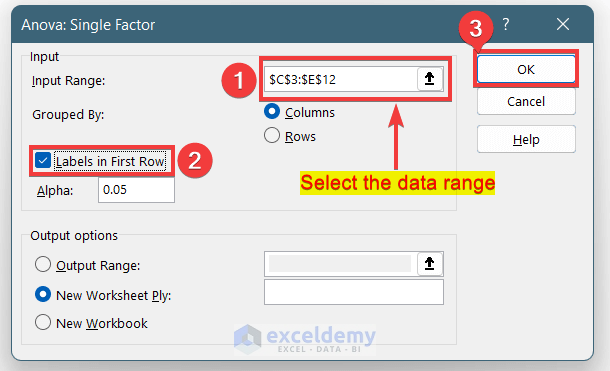
- As a result, a new worksheet will be created and the ANOVA outcomes will be here.
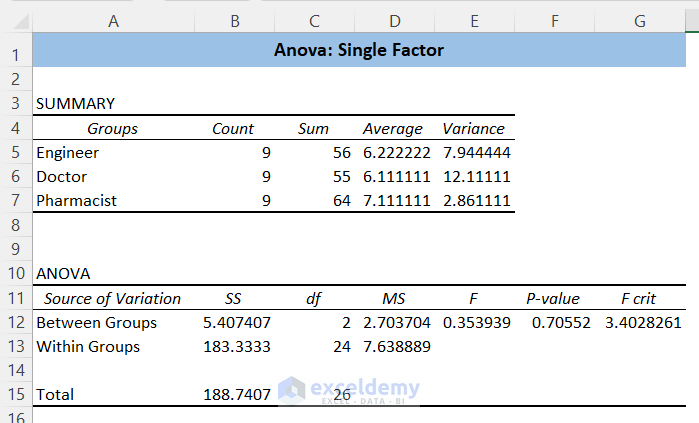
One-Way ANOVA Results Explanation:
- In the Summary table, you will find the average and the variances of each profession. Here you can see the average satisfaction level is 6.11 for Doctors but the variance is 12.11 which is much higher than others. That means, in the Doctors profession, some are highly satisfied and some are very less.
- Here, ANOVA results are not that significant as you are calculating only the variances.
- Here, P-values interpret the relation between the columns and the values are greater than 0.05 so this is not statistically significant. And there shouldn’t relation between the columns also.
Two-Way Variance Analysis in Excel: Step-by-Step Procedure
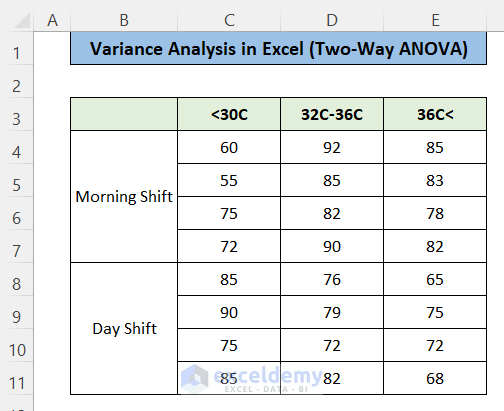
Suppose you have some data on student attendance in a school. There are two shifts in that school. You have found some clue that there is some effect of the day temperature on the presence of students but it also varies in shifts. You want to Data Analysis of the ready data to find a relation between attendance shift and temperature. I am showing the steps below.
Step 1: Go to Data Analysis Tool
- First, go to the Data tab.
- Then, select the Data Analysis option.
Step 2: Select Anova (Two-Factor with/without Replication)
- Now, in the Data Analysis window, select the “Anova: Two-Factor With Replication” option.
- And press OK.

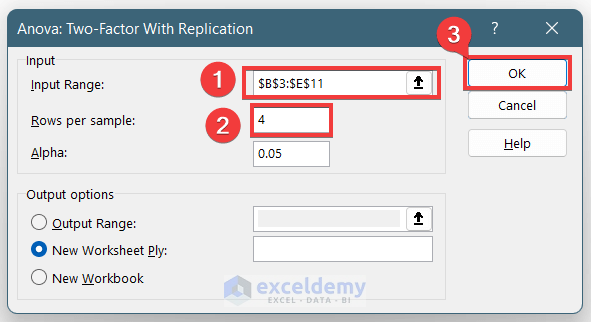
Last Step: Set Input Range to Get Result
- Now, a new window will appear.
- Here, select the data range in the Input Range box.
- Then input 4 in the Rows per sample box as you have 4 rows per shift.
- Finally, press OK.
- As a result, you will see a new worksheet created.
- And, two way ANOVA result is shown in this worksheet.

Two Way ANOVA Results Explanation:
Here, the first tables, there are showing the summary of shifts. In brief:
- The average presence in Morning shift while temp < 30C is 65.5 but in the Day shift is 83.75
- But when the temp is >36C, the average presence in the Morning shift is 82% but in the Day shift is 70%.
- Variance is very high at 91 in the Morning shift when temp <30C.
- You will get a complete overview of data in the summary

And in the ANOVA part, you can summarise the interactions and the individual effects. In brief:
- The P-value of shifts is 0.6 which is not statistically significant at the alpha level of 0.05.
- The P-value of Temperatures is 0.036 which is statistically significant so you can say that there is an effect of temperatures on the presence in the school. But the value is close to the alpha value of 0.05 so the effect is less significant.
- But the P-value of interactions is 6.29 e-05 which is much less than the alpha value so it is very much significant statistically and you can say that the combined effect of shift and temp is very high in the presence in the school.

What to Do When Data Analysis Tool Is Not Showing?
The Data Analysis option will not show if the Data Analysis Toolpak Add-in is not enabled. Here I will show how to enable the Data Analysis Toolpak in Excel.
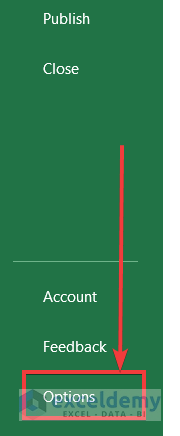
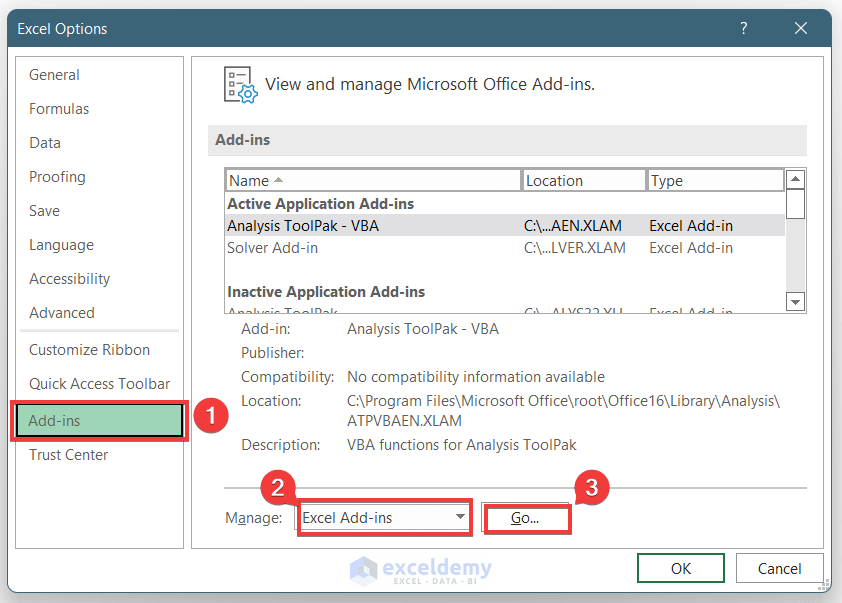
- First, go to the Options from the File tab.
- Then, go to the Add-ins option.
- Here, select Excel Add-ins in the Manage drop-down menu.
- Press Go.
- Then, a new window will appear.
- Here, mark the option “Analysis ToolPak” And press OK.
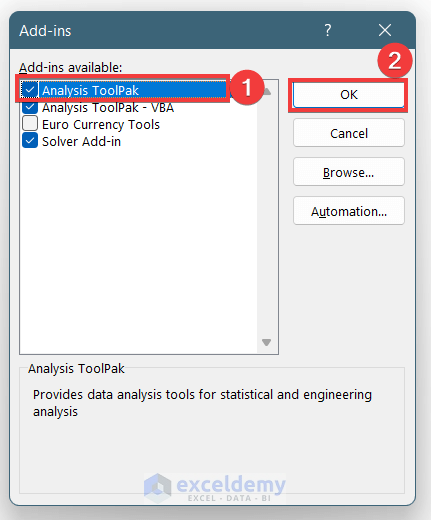
- Now, go to the Analyze menu in the Data tab. Here you will find the Data Analysis option.
Download Practice Workbook
You can download the practice workbook from here:
Conclusion
In this article, you have found how to do variance analysis in Excel. I have shown both one-way ANOVA and two-way ANOVA to do the variance analysis in Excel. You can download the workbook for free and practice it yourself. I hope you found this article helpful. Please, drop comments, suggestions, or queries if you have any in the comment section below.
Related Articles
<< Go Back to Calculate Variance in Excel | Excel for Statistics | Learn Excel
Get FREE Advanced Excel Exercises with Solutions!
