The index of a dataset’s variability, known as variance, shows how far apart the various values are from one another. In this article, we are going to demonstrate 5 ways to find the variance of a probability distribution in Excel. If you are also curious about it, download our practice workbook and follow us.
Overview of Variance
The measure of a dataset’s variability, known as variance, shows how far apart the various values are from one another. Its mathematical definition is the average of the squared deviations from the mean. Thus, we can represent the mathematical expression of sample variance as,
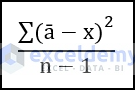
However, the expression of variance for any population data will be:
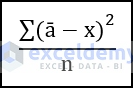
Here,
- ā represents the mean or average of the dataset
- x is the sample data
- n stands for the total number of data
Estimate the Probability Distribution in Excel
Before starting the evaluation of the variance, we have to estimate the probability distribution of our dataset. We have a dataset of examination numbers of 75 students. The number interval is in column B, and the number of students per interval is in column C. So, our dataset is in the range of cells B5:C15.

The steps to calculate the probability distribution are given below:
📌 Steps:
- First of all, select cell C16.
- Now, write down the following formula using the SUM function in the cell.
=SUM(C5:C15)
- Press Enter.
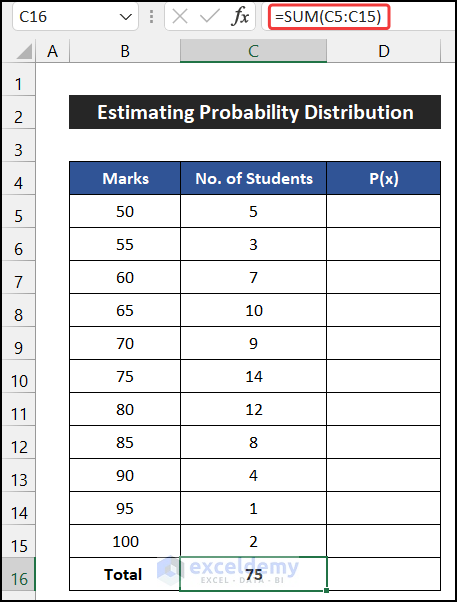
- After that, select cell D5 and write down the following formula to get the probability distribution of that corresponding value. Make sure that you input the Absolute Cell Reference for cell C16.
=C5/$C$16
- Similarly, press Enter.

- Then, drag the Fill Handle icon to copy the formula up to cell D15.

- You will get all the probability distribution values. You can also check the sum of this probability value. If you didn’t make any mistake, the value must be equal to 1.
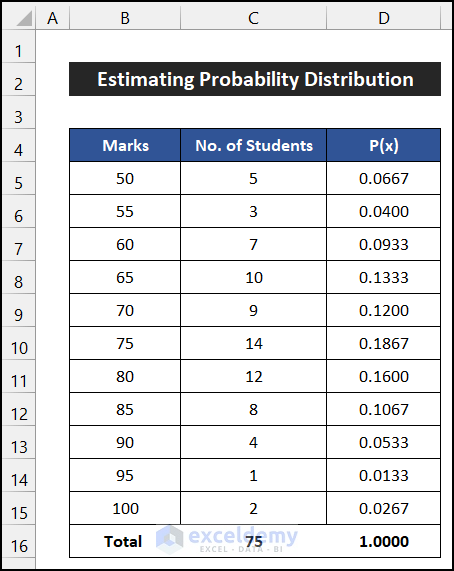
Thus, we can say that our formula works properly, and we are able to calculate the probability distribution in Excel.
How to Find the Variance of a Probability Distribution in Excel: 5 Quick Ways
To demonstrate the approaches, we consider the previously calculated probability distribution values. Our probability distribution value is in the range of cells D5:D15.

📚 Note:
All the operations of this article are accomplished by using Microsoft Office 365 application.
1. Calculate Variance by Conventional Formula
In this method, we are going to find the variance of a probability distribution using the conventional manual formula. The steps of this process are given below:
📌 Steps:
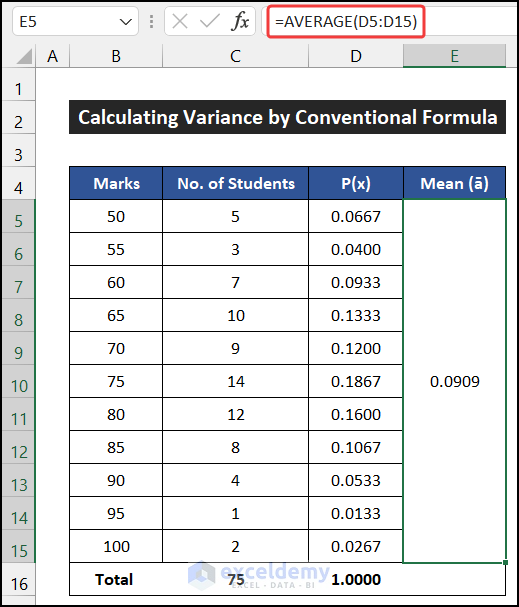
- At first, merge the range of cells E5:E15.
- After that, select the merged cell E5 and write down the following formula using the AVERAGE function.
=AVERAGE(D5:D15)
- Press Enter.
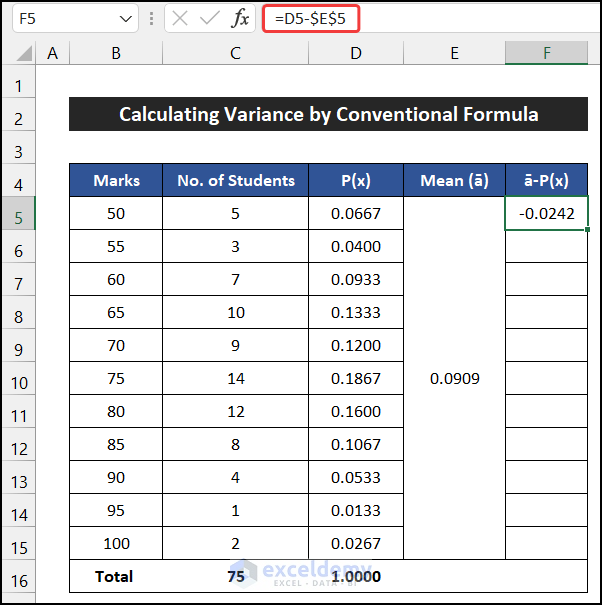
- Then, select cell F5 and write down the following formula to determine the difference between the mean and the probability value. Ensure that you add the Absolute Cell Reference for cell E5.
=D5-$E$5
- Press Enter.
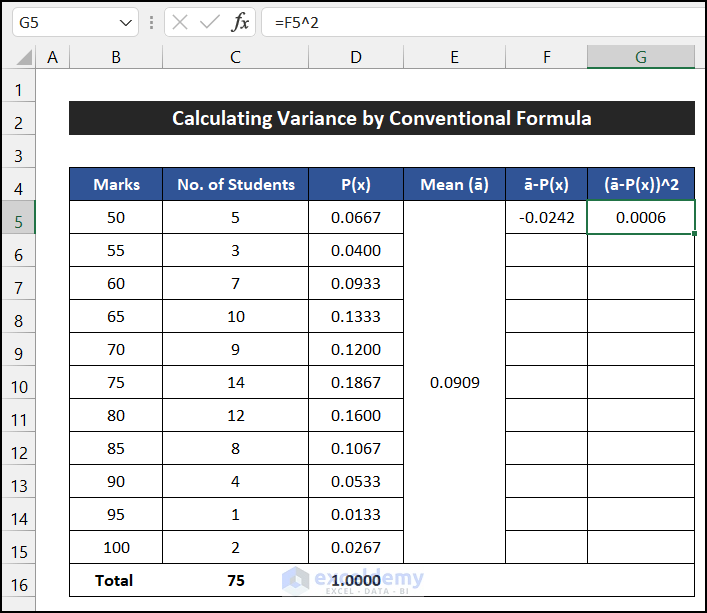
- After that, we will square the value. For that, write down the following formula in cell G5.
=F5^2
- Again, press Enter.
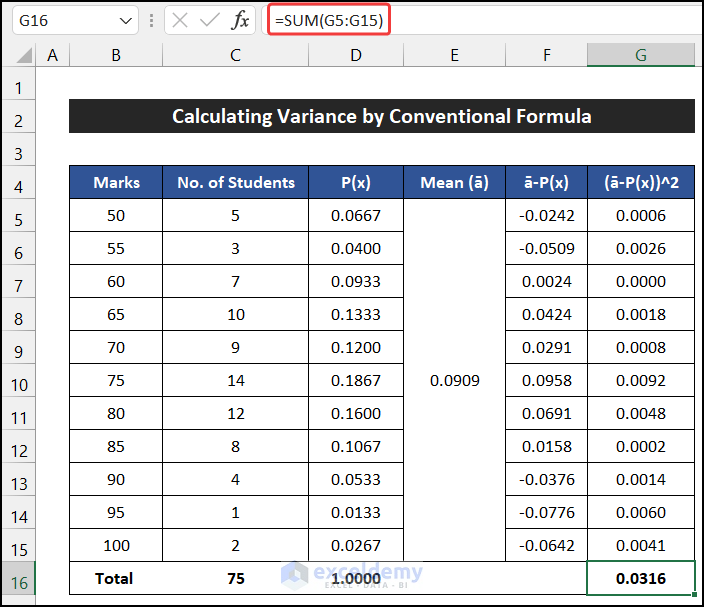
- Next, select the range of cells F5:G5 and drag the Fill Handle icon up to cell G15 to copy the formula.

- Afterward, we have to sum these values. To get the sum, use the SUM function to write the following formula in cell G16.
=SUM(G5:G15)
- Press Enter.
- At last, merge the range of cell H5:H15 and write down the following formula into the merged cell to get the value of variance.
=G16/(11-1)
- Press Enter for the last time.

- You will get the value of variance.
Hence, we can say that all of our formulas work perfectly, and we are able to find the variance of a probability distribution in Excel.
Read More: How to Apply Variance Formula in Excel to Get Plus-Minus Results
2. Using VAR Function to Find the Variance of a Probability Distribution
In this process, we will use the VAR function to find the variance of a probability distribution in Excel. The steps of this approach are given as follows:
📌 Steps:
- First, select cell F5.
- Now, write down the following formula using the VAR function inside the cell.
=VAR(D5:D15)
- Press Enter.
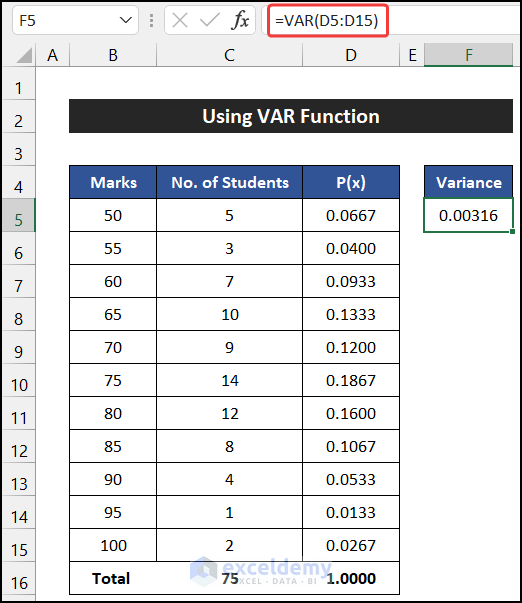
- You will get the value of variance in the cell.
So, we can say that our formula works effectively, and we are able to find the variance of a probability distribution in Excel.
Read More: How to Do Variance Analysis in Excel
3. Applying VARA Function to Get the Variance of a Probability Distribution
In this approach, we are going to use the VARA function to find the variance of a probability distribution in Excel. The steps of this procedure are shown as follows:
📌 Steps:
- Firstly, select cell F5.
- After that, write down the following formula using the VARA function in the cell.
=VARA(D5:D15)
- Then, press Enter.

- You will find the variance value.
Therefore, we can say that our formula works precisely, and we are able to find the variance of a probability distribution in Excel.
Read More: How to Calculate Mean Variance and Standard Deviation in Excel
4. Utilizing VAR.S Function to Find the Variance of a Probability Distribution
In this procedure, the VAR.S function will help us to find the variance of a probability distribution in Excel. The procedure is explained below step-by-step:
📌 Steps:
- At the beginning of this process, select cell F5.
- Afterward, write down the following formula using the VAR.S function in the cell.
=VAR.S(D5:D15)
- Next, press Enter.
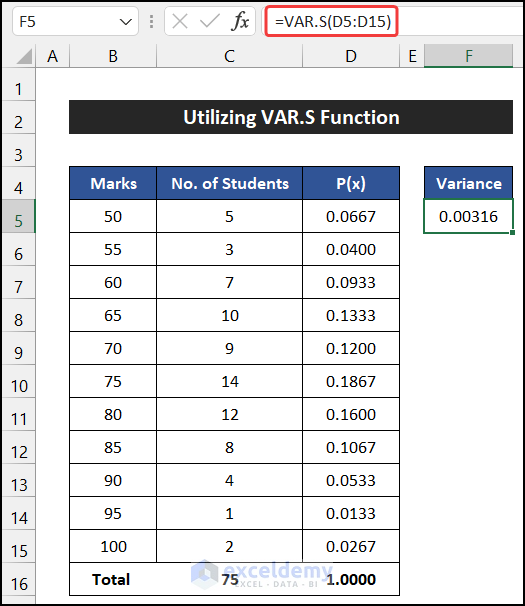
- You will get the variance value in our desired cell.
At last, we can say that our formula works fruitfully, and we are able to find the variance of a probability distribution in Excel.
Read More: How to Calculate Coefficient of Variance in Excel
5. Use of VAR.P Function for Calculating the Variance of a Probability Distribution
In the last case, we are going to use the VAR.P function to find the variance of a probability distribution in Excel. Here, we will consider the sample dataset as a population set. The steps of this method are described below:
📌 Steps:
- First of all, select cell F5.
- Now, write down the following formula using the VAR.P function.
=VAR.P(D5:D15)
- Then, press Enter.

- You will find the variance value in our desired cell.
Finally, we can say that our formula works successfully, and we are able to find the variance of a probability distribution in Excel.
Read More: How to Find Population Variance in Excel
Download Practice Workbook
Download this practice workbook for practice while you are reading this article.
Conclusion
That’s the end of this article. I hope that this article will be helpful for you and you will be able to find the variance of a probability distribution in Excel. Please share any further queries or recommendations with us in the comments section below if you have any further questions or recommendations. Keep learning new methods and keep growing!
Related Articles
- How to Calculate Percentage Variance between Two Numbers in Excel
- How to Calculate Pooled Variance in Excel
<< Go Back to Calculate Variance in Excel | Excel for Statistics | Learn Excel
Get FREE Advanced Excel Exercises with Solutions!
