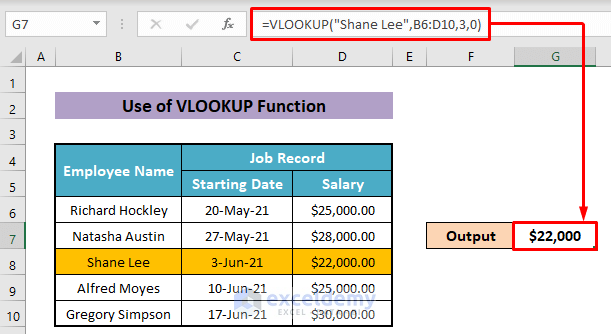
Method 1 – VLOOKUP & HLOOKUP Functions
In this VLOOKUP function in Excel: Learn with Examples tutorial, we provide an overview of VLOOKUP and an example to get you started with the VLOOKUP function. The following example shows the lookup value- Salary for the employee Shane Lee.
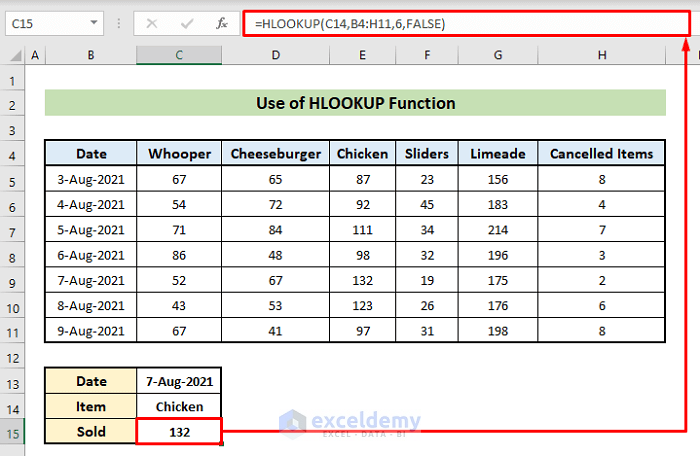
HLOOKUP function
Use the HLOOKUP function in Excel as an overview of the HLOOKUP function in terms of syntax as well as an example of how to use the HLOOKUP function. The example below shows the lookup value of the “sold numbers” for the item “chicken.”
Method 2 – INDEX and MATCH Functions
The INDEX and MATCH form a powerful lookup combo that can handle the situations VLOOKUP can’t.
- INDEX and MATCH function: The INDEX function [Examples, Make Dynamic Range, INDEX MATCH, tutorial, go through the INDEX function and the INDEX and MATCH combo. Learn how to use the INDEX function in array and reference form.
- Using the INDEX and MATCH functions in VBA code: Use the worksheet INDEX and MATCH combo in your VBA code as well. Using Excel worksheet functions Index & Match in VBA code.
Method 3 – IF Function
The IF function is one of the most useful functions in Excel, which you can use to test a variety of conditional situations.
- IF Function: In our IF function tutorial, cover the syntax of the IF function as well as illustrate its use with a simple example.
- IF Function & AND Function: In the Excel If function with Multiple Conditions (Nested IF) tutorial, use the IF & AND functions in one formula to test multiple conditions.
- IF VBA Function & AND Function: Use conditional logic in VBA to use the IF & AND functions in Excel VBA to test multiple conditions [using a medical example] we’ll show how to use conditional logic in VBA.
Method 4 – DATE and TIME Functions
- Understanding Dates and Times in Excel: Know how to enter dates and times in Excel in worksheet cells.
- The DAYS Function: In how to use the Excel DAYS function with a practical example tutorial, go over how to use the DAYS function to calculate the number of days between two dates.
- The DATEDIF Function: Use the DATEDIF function in the Excel tutorial to go over how to use the very useful DATEDIF function in Excel using an anaerobic digestion example. The DATEDIF function can return the number of days, months, or years between two dates.
- The TODAY and NOW Functions: The TODAY function does not take any arguments and is used to return the current date, and the NOW function likewise does not take any arguments and is used to return both the current date and time. Use the TODAY() and NOW() functions in Excel to go over these functions and how to use them.
Method 5 – OFFSET Function
The OFFSET function at first glance, may not seem very useful to a beginner user of Excel. It can be used in a variety of situations and formulas. We selected a tutorial dealing with the OFFSET function:
The OFFSET function: Use of Offset function in Excel [Offset – Match Combo, Dynamic Range] to go over how to use the OFFSET function, use it to create a dynamic range, and how to automate calculations by combining the OFFSET and COUNT functions.
Method 6 – GETPIVOTDATA Function
Many people ask questions about using data from Pivot Tables in their other formulas, and there is a way to do this by using the GETPIVOTDATA function.
GETPIVOTDATA function: How to use Pivot Table data in Excel formulas to go over how to use pivot table data in Excel formulas. Knowing how to do this will enable you to create powerful worksheet formulas that utilize all the useful information from your Pivot Tables.
Method 7 – FORMULATEXT Function
If you want to see the formulas alongside their results without having to toggle on and off use the FORMULATEXT function.
The FORMULATEXT function: In the FORMULATEXT function in the Excel tutorial, you’ll know how to use the FORMULATEXT function as well as other ways to see the formulas in your worksheet.
Advanced Excel Functions
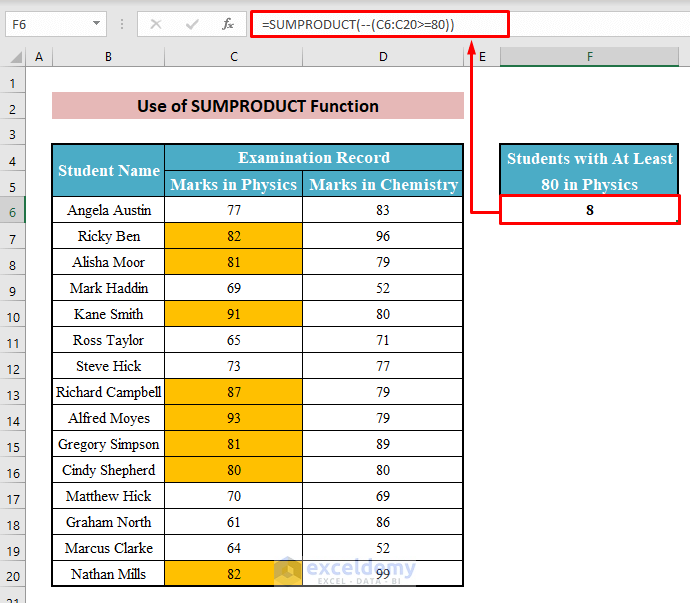
Method 1 – SUMPRODUCT Function
The SUMPRODUCT function is one of the most useful advanced functions in Excel, and it is utilized when you want to multiply corresponding items in arrays and then return the sum of the results.
The SUMPRODUCT function in Excel: The SUMPRODUCT() function in Excel tutorial is a basic introduction to what the SUMPRODUCT function is and how to use it with real-time examples. Used the SUMPRODUCT function to count the numbers in Physics that are greater than or equal to 80.
Method 2 – INDIRECT Function
The INDIRECT function returns a reference specified by a text string. It is used extensively in various situations. We selected one tutorial that reviews the INDIRECT function:
The INDIRECT function: This is the indirect function with 12 case studies tutorial using the INDIRECT function with 3 case studies. It is an in-depth tutorial that explores ways in which one can use the INDIRECT function.
Method 3 – DATABASE Functions
Database functions in Excel are similar to their access counterparts, and you can use them to look up data in Excel. Your worksheet must be set up correctly to use them.
Database functions: The functions DGET, DAVERAGE, & DMAX, describe the most useful Database functions as well as how to use them with a practical example.
Method 4 – ARRAY Formulas
- Introduction to Array Formulas: What’s an array formula, and how to enter it in a cell?
- Advanced Array Formulas: This is the breakdown of an array formula to learn how to use array formulas with examples in your spreadsheets.
Useful Functions for Financial Analysts
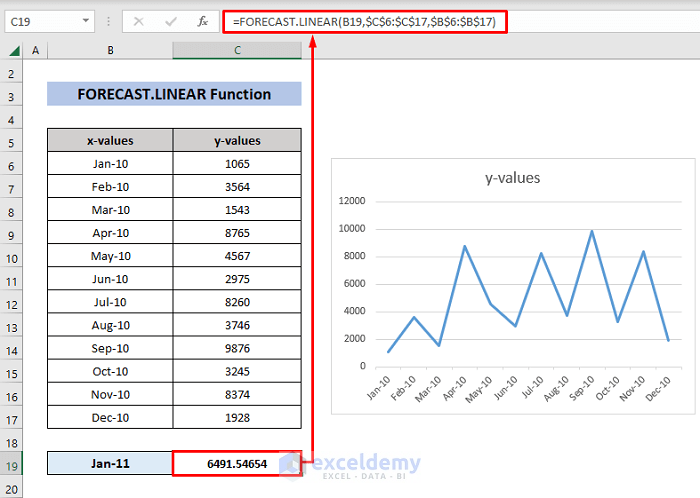
Method 1 – Using the FORECAST Function in Excel
The FORECAST function in Excel: The FORECAST function is present in the sample below for the predicted value for Jan-11.
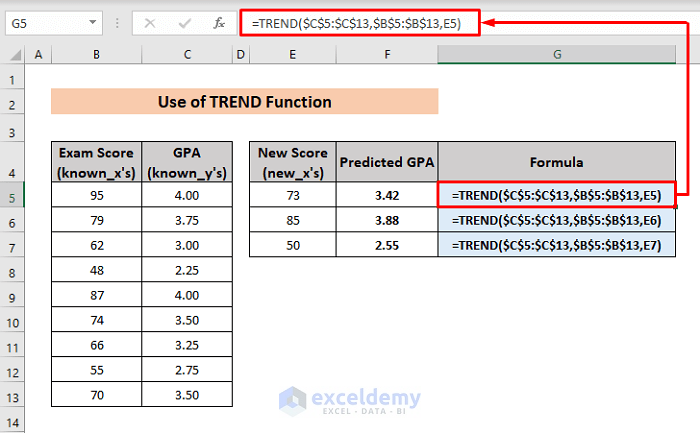
Method 2 – The TREND Function in Excel
The TREND function: The TREND function is covered and compared to the FORECAST function. The following example gives the predicted GPA for a specific score.
Method 3 – Creating a Histogram in Excel
- The Definition of a Histogram: A Histogram performs the specific task of a Column chart, showing the number of occurrences of a variable graphically in a specified range, called a bin. It visually shows the count of elements that fall within sequential, non-overlapping intervals. The Histogram also identifies trends in data and detects unusual patterns like outliers.
- How to Create a Histogram in Excel: The Data Analysis Toolpak article on this site covers this topic and how to create a histogram with bell curve.
- The Differences between a Bar Graph and a Histogram: In the differences between a bar graph and a histogram tutorial, we review this commonly asked question and how to create each in Excel. Look at the types of data sets used visually by the bar chart and the histogram.
Method 4 – Correlation in Excel
Calculating Correlation in Excel: In how to calculate correlation in Excel tutorial from our website, calculating correlation is explained in detail and what correlation denotes. Common errors associated with correlation are reviewed.
Method 5 – Regression in Excel
- Simple Linear Regression: Using a straight line, simple linear regression looks at how a dependent variable is related to one independent variable.
- Multiple Linear Regression: Multiple linear regression predicts the dependent variable using two or more independent variables.
- Quantile Regression: Quantile regression analyzes data that estimates the response variable’s middle value (median) instead of the mean, which is what regular regression does. It’s used when regular linear regression doesn’t work well.
- Non-Parametric Regression: Nonparametric regression is a type of regression where the predictor isn’t assumed to have a specific shape in advance; it’s determined based on the data itself. This method needs larger sample sizes compared to parametric regression. It relies on the data to establish the model’s structure and estimates without predefined assumptions.
- Polynomial Regression: In statistics, polynomial regression models the relationship between x and y by using a polynomial equation of a specified degree.
Using the Regression Data Analysis Tool in Excel: How to calculate linear regression using the Data Analysis Toolpak in Excel explains this point.
Multiple Regression Analysis: Multiple regression is used when you want to investigate the relationship between a dependent variable and two or more independent variables. In multiple regression analysis with Excel, shows how to do multiple regression with an example.
Method 6 – Using the Data Analysis Toolpak
The Data Analysis Toolpak is loaded with advanced statistical and engineering functions, so it’s a good idea for an analyst to get to know this useful suite of functions. Find out in Data Analysis ToolPak.
- Data Analysis ToolPak: This tool is used to perform complex data analysis. It is from the Office website provided by Microsoft and lists the full suite of functions of the ToolPak as well as a definition of each function.
- Data Analysis ToolPak Further Explored: The Excel Easy website has a set of tutorials that show how to use the Data Analysis ToolPak in various situations, such as:
- Analysis ToolPak
- Creating a Histogram
- Descriptive Statistics
- ANOVA
- F-test
- T-test
- Moving Average
- Exponential Smoothing
- Correlation
- Regression
Useful VBA Functions
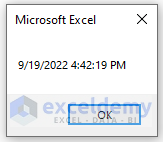
Method 1 – NOW Function
The NOW function will return the current time and date. This is an example of it that will return the current time.
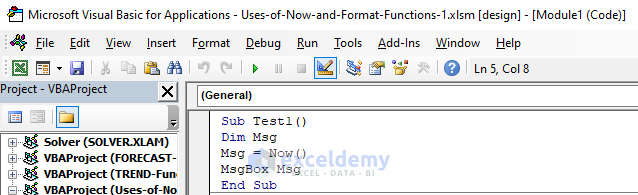
The output-
Method 2 – Format Function
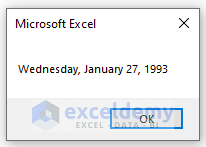
This Format function in VBA returns a string according to the format given in the code. The code below will return the date’s long format from the short format.
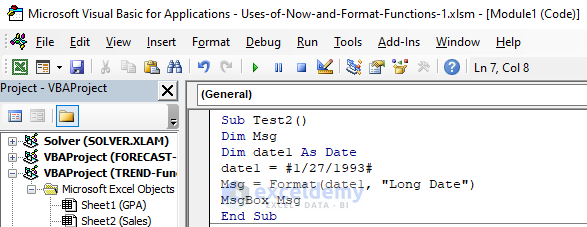
After running the code, get the long format.
Method 3 – DATE Function
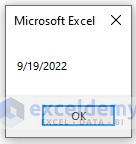
The DATE function performs any operation related to the date. This code returns the current date.
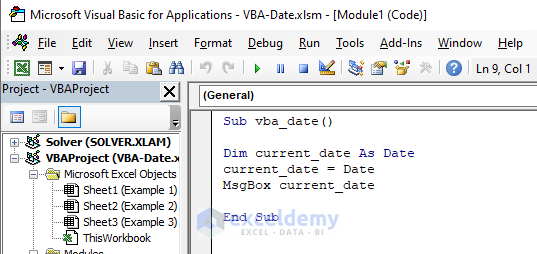
The output of the above code.
Related Articles
- What Are Excel Function Arguments
- Top Excel Functions and Features for Management Consultants
- Compatibility Function in Excel
<< Go Back to Excel Functions | Learn Excel
Get FREE Advanced Excel Exercises with Solutions!
