In this tutorial, I am going to share with you 34 practical examples of compatibility function in Excel. You can easily apply these functions to perform a wide range of statistical calculations inside an Excel worksheet. To achieve this task, we will also see some useful features that might come in handy in many other Excel-related tasks.
Compatibility Function in Excel: 34 Practical Examples
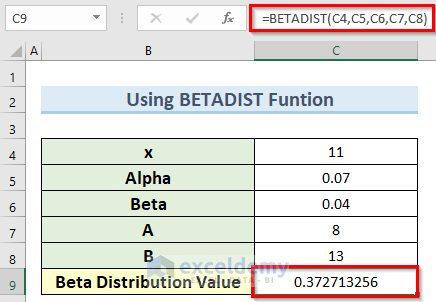
1. The BETADIST Function
Function Objective
This compatibility function in Excel gives back the beta probability density as a cumulative result.
Syntax
BETADIST(x,alpha,beta,[A],[B])Arguments Explanation
| Argument | Required/Optional | Explanation |
|---|---|---|
| x | Required | The value between A and B at which to evaluate the function |
| Alpha | Required | A parameter of the distribution |
| Beta | Required | A parameter of the distribution |
| A | Optional | A lower bound to the interval of x |
| B | Optional | An upper bound to the interval of x |
Return Parameter
The beta probability density.
Use of BETADIST Function
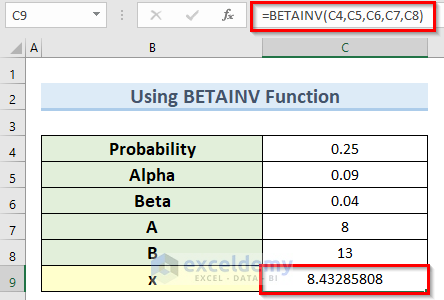
2. The BETAINV Function
Function Objective
We can get the inverse cumulative value of the beta probability density from this compatibility function in Excel.
Syntax
BETAINV (probability,alpha,beta,[A],[B])Arguments Explanation
| Argument | Required/Optional | Explanation |
|---|---|---|
| Probability | Required | A probability associated with the beta distribution |
| Alpha | Required | A parameter of the distribution |
| Beta | Required | A parameter of the distribution |
| A | Optional | A lower bound to the interval of x |
| B | Optional | An upper bound to the interval of x |
Return Parameter
Inverse cumulative value of the beta probability density.
Use of BETAINV Function
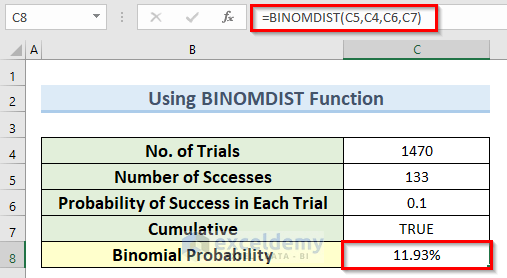
3. The BINOMDIST Function
Function Objective
As the name suggests, this function works with the binomial distribution probability and gives individual terms.
Syntax
BINOMDIST (number_s,trials,probability_s,cumulative)Arguments Explanation
| Argument | Required/Optional | Explanation |
|---|---|---|
| Number_s | Required | The number of successful incidents in trials |
| Trials | Required | Quantity of independent trials |
| Probability_s | Required | The probability of successful incidents on each trial |
| Cumulative | Required | A logical value that determines the form of the function.
|
Return Parameter
Individual terms of the binomial distribution.
Use of BINOMDIST Function
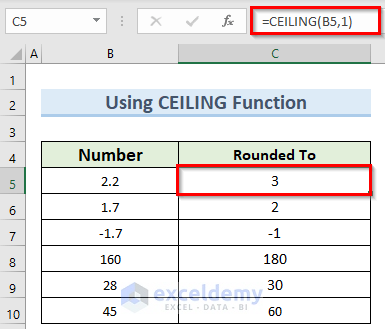
4. The CEILING Function
Function Objective
This compatibility function in Excel can round a number to the nearest significant multiple which is also away from zero.
Syntax
CEILING (number, significance)Arguments Explanation
| Argument | Required/Optional | Explanation |
|---|---|---|
| Number | Required | The value you want to round |
| Significance | Required | The multiple to which the Number is to be rounded |
Return Parameter
Rounded number.
Use of CEILING Function
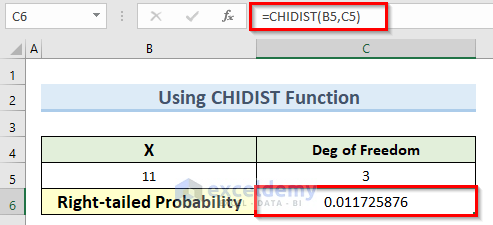
5. The CHIDIST Function
Function Objective
This function works with the chi-squared data distribution and returns the right-tailed probability value.
Syntax
CHIDIST(x,deg_freedom)Arguments Explanation
| Argument | Required/Optional | Explanation |
|---|---|---|
| X | Required | The amount you wish to use to measure the distribution’s performance |
| Deg_freedom | Required | The number of degrees of freedom |
Return Parameter
The right-tailed probability value
Use of CHIDIST Function
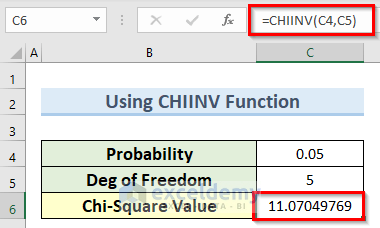
6. The CHIINV Function
Function Objective
This function also works with the chi-squared distribution but instead gives the inverse of the right-tailed probability.
Syntax
CHIINV (probability,deg_freedom)Arguments Explanation
| Argument | Required/Optional | Explanation |
|---|---|---|
| Probability | Required | A probability associated with the chi-squared distribution |
| Deg_freedom | Required | The number of degrees of freedom |
Return Parameter
The inverse of the right-tailed probability
Use of CHIINV Function
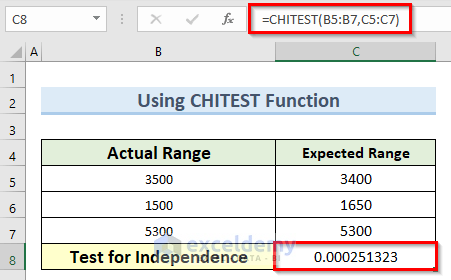
7. The CHITEST Function
Function Objective
This function is mainly helpful to check for independence.
Syntax
CHITEST (actual_range,expected_range)Arguments Explanation
| Argument | Required/Optional | Explanation |
|---|---|---|
| Actual_range | Required | The set of data containing observations that can be compared against predictions |
| Expected_range | Required | The set of data that shows how much row totals and column totals add up to the overall sum |
Return Parameter
Independence test result
Use of CHITEST Function
Read More: How to Use Format Function in Excel
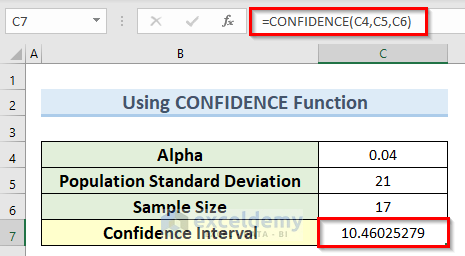
8. The CONFIDENCE Function
Function Objective
This function uses a normal distribution and returns the confidence interval for a mean population.
Syntax
CONFIDENCE (alpha,standard_dev,size)Arguments Explanation
| Argument | Required/Optional | Explanation |
|---|---|---|
| Alpha | Required | The significance level used to compute the confidence level. The confidence level equals 00*(1 – alpha)%, or in other words, an alpha of 0.05 indicates a 95 percent confidence level |
| Standard_dev | Required | The population standard deviation for the data range and is assumed to be known |
| Size | Required | The sample size |
Return Parameter
The confidence interval for a mean population
Use of CONFIDENCE Function
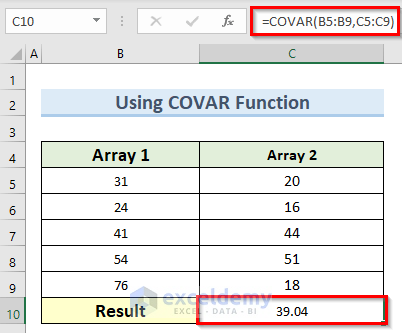
9. The COVAR Function
Function Objective
This function works with covariance which can determine the relationship between two sets of data.
Syntax
COVAR (array1, array2)Arguments Explanation
| Argument | Required/Optional | Explanation |
|---|---|---|
| Array1 | Required | The first cell range of integers |
| Array2 | Required | The second cell range of integers |
Return Parameter
The relationship between two sets of data
Use of COVAR Function
10. The CRITBINOM Function
Function Objective
The function returns the least value for which a given criterion value is larger than or equal to the cumulative binomial distribution.
Syntax
CRITBINOM (trials,probability_s,alpha)Arguments Explanation
| Argument | Required/Optional | Explanation |
|---|---|---|
| Trials | Required | The number of Bernoulli trials |
| Probability_s | Required | The probability of success on each trial |
| Alpha | Required | The criterion value |
Return Parameter
The least value for which a given criterion value is larger than or equal to the cumulative binomial distribution
Use of CRITBINOM Function

11. The EXPONDIST Function
Function Objective
The formula of this compatibility function in Excel returns an exponential distribution.
Syntax
EXPONDIST(x,lambda,cumulative)Arguments Explanation
| Argument | Required/Optional | Explanation |
|---|---|---|
| X | Required | The value of the function |
| Cumulative | Required | a logical number that specifies the exponential function’s form to use
EXPONDIST returns the cumulative distribution function if cumulative is TRUE. EXPONDIST returns the probability density function if cumulative is FALSE. |
Return Parameter
An exponential distribution
Use of EXPONDIST Function

12. The FDIST Function
Function Objective
If two Excel data sets have differing levels of diversity, we can use this compatibility function to compare them.
Syntax
FDIST(x,deg_freedom1,deg_freedom2)Arguments Explanation
| Argument | Required/Optional | Explanation |
|---|---|---|
| X | Required | The value at which to evaluate the function. |
| Deg_freedom1 | Required | The numerator degrees of freedom |
| Deg_freedom2 | Required | The denominator degrees of freedom |
Return Parameter
F probability value
Use of FDIST Function

13. The FINV Function
Function Objective
The function outputs the (right-tailed) F probability distribution’s inverse.
Syntax
FINV (probability,deg_freedom1,deg_freedom2)Arguments Explanation
| Argument | Required/Optional | Explanation |
|---|---|---|
| Probability | Required | a likelihood corresponding to the F cumulative distribution |
| Deg_freedom1 | Required | The numerator degrees of freedom |
| Deg_freedom2 | Required | The denominator degrees of freedom |
Return Parameter
F probability distribution’s inverse
Use of FINV Function

14. The FLOOR Function
Function Objective
The FLOOR function reduces the integer to the nearest multiple of significance before rounding it down to zero.
Syntax
FLOOR (number, significance)Arguments Explanation
| Argument | Required/Optional | Explanation |
|---|---|---|
| Number | Required | The numeric value you want to round |
| Significance | Required | The multiple to which you want to round |
Return Parameter
Rounded number
Use of FLOOR Function

15. The FTEST Function
Function Objective
The function returns the F-test’s outcome.
Syntax
FTEST (array1, array2)Arguments Explanation
| Argument | Required/Optional | Explanation |
|---|---|---|
| Array1 | Required | The first array or range of data |
| Array2 | Required | The second array or range of data |
Return Parameter
The F-test’s outcome
Use of FTEST Function

16. The GAMMADIST Function
Function Objective
The function outputs the gamma distribution of a dataset.
Syntax
GAMMADIST(x,alpha,beta,cumulative)Arguments Explanation
| Argument | Required/Optional | Explanation |
|---|---|---|
| X | Required | Your desired value for evaluating the distribution |
| Alpha | Required | A parameter to the distribution. |
| Beta | Required | A parameter to the distribution.
The typical gamma distribution is returned by GAMMADIST if beta = 1 |
| Cumulative | Required | A logical value that determines the form of the function.
The cumulative distribution function is what GAMMADIST returns if cumulative is TRUE. GAMMADIST returns the probability density function if cumulative is FALSE. |
Return Parameter
The gamma distribution of a dataset
Use of GAMMADIST Function

17. The GAMMAINV Function
Function Objective
The formula returns the inverse gamma cumulative distribution using the GAMMAINV compatibility function in Excel.
Syntax
GAMMAINV (probability,alpha,beta)Arguments Explanation
| Argument | Required/Optional | Explanation |
|---|---|---|
| Probability | Required | The probability associated with the gamma distribution |
| Alpha | Required | A parameter of the distribution |
| Beta | Required | A parameter to the distribution.
GAMMAINV yields the common gamma distribution if beta = 1. |
Return Parameter
The inverse gamma cumulative distribution
Use of GAMMAINV Function

18. The HYPGEOMDIST Function
Function Objective
This function gives back the probability of success for a sample population.
Syntax
HYPGEOMDIST (sample_s,number_sample,population_s,number_pop)Arguments Explanation
| Argument | Required/Optional | Explanation |
|---|---|---|
| Sample_s | Required | The number of successful events in the sample |
| Number_sample | Required | The sample size |
| Population_s | Required | The number of successes in the population |
| Number_pop | Required | The population size |
Return Parameter
The probability of success for a sample population
Use of HYPGEOMDIST Function

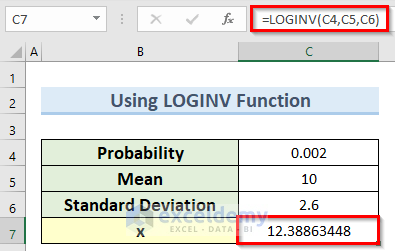
19. The LOGINV Function
Function Objective
The formula returns the lognormal cumulative distribution function’s inverse.
Syntax
LOGINV (probability, mean, standard_dev)Arguments Explanation
| Argument | Required/Optional | Explanation |
|---|---|---|
| Probability | Required | A probability associated with the lognormal distribution. |
| Mean | Required | The mean of ln(x). |
| Standard_dev | Required | The standard deviation of ln(x). |
Return Parameter
The lognormal cumulative distribution function’s inverse
Use of LOGINV Function
20. The LOGNORMDIST Function
Function Objective
The method returns the cumulative lognormal distribution of x, where ln(x) is a function having a normal distribution with mean and standard deviation as its parameters.
Syntax
LOGNORMDIST(x,mean,standard_dev)Arguments Explanation
| Argument | Required/Optional | Explanation |
|---|---|---|
| X | Required | The value at which to evaluate the function. |
| Mean | Required | The mean of ln(x). |
| Standard_dev | Required | The standard deviation of ln(x). |
Return Parameter
The cumulative lognormal distribution of x
Use of LOGNORMDIST Function

21. The MODE Function
Function Objective
This function gives back the most frequent value in a data array.
Syntax
MODE (number1,[number2],...)Arguments Explanation
| Argument | Required/Optional | Explanation |
|---|---|---|
| Number1 | Required | The first number argument that you wish to use to determine the mode |
| Number2 | Optional | The range of parameters (2–255) for which you want to determine the mode
Instead of using arguments that are separated by commas, you can either use a single array or a reference to an array. |
Return Parameter
The most frequent value in a data array
Use of MODE Function

Read More: What Are Excel Function Arguments
22. The NEGBINOMDIST Function
Function Objective
This function gives the negative binomial distribution of a dataset.
Syntax
NEGBINOMDIST (number_f,number_s,probability_s)Arguments Explanation
| Argument | Required/Optional | Explanation |
|---|---|---|
| Number_f | Required | The number of failures. |
| Number_s | Required | The threshold number of successes. |
| Probability_s | Required | The probability of a success. |
Return Parameter
The negative binomial distribution of a dataset
Use of NEGBINOMDIST Function

23. The NORMSDIST Function
Function Objective
If we have a specified mean and a standard deviation, this function will give us the normal distribution.
Syntax
NORMDIST(x,mean,standard_dev,cumulative)Arguments Explanation
| Argument | Required/Optional | Explanation |
|---|---|---|
| X | Required | The value for which you want the distribution. |
| Mean | Required | The arithmetic mean of the distribution. |
| Standard_dev | Required | The standard deviation of the distribution. |
| Cumulative | Required | a logical value that establishes the function’s shape.
NORMDIST returns the cumulative distribution function if cumulative is TRUE. The probability mass function is returned by NORMDIST if cumulative is FALSE. |
Return Parameter
The normal distribution
Use of NORMSDIST Function

24. The NORMINV Function
Function Objective
This function is useful to find out the inverse of the normal cumulative distribution after specifying the mean and standard deviation.
Syntax
NORMINV (probability,mean,standard_dev)Arguments Explanation
| Argument | Required/Optional | Explanation |
|---|---|---|
| Probability | Required | A probability associated with the beta distribution |
| Mean | Required | A parameter of the distribution |
| Standard_dev | Required | A parameter of the distribution |
Return Parameter
The inverse of the normal cumulative distribution
Use of NORMINV Function

25. The PERCENTILE Function
Function Objective
This function gives the percentile of values at the k-th position.
Syntax
PERCENTILE (array,k)Arguments Explanation
| Argument | Required/Optional | Explanation |
|---|---|---|
| Array | Required | the collection of data that characterizes relative standing. |
| K | Required | The percentile value in the range 0…1, inclusive. |
Return Parameter
The percentile of values at the k-th position
Use of PERCENTILE Function

26. The PERCENTRANK Function
Function Objective
We can use this compatibility function to easily determine the relative standing of a value within a data array in Excel.
Syntax
PERCENTRANK (array,x,[significance])Arguments Explanation
| Argument | Required/Optional | Explanation |
|---|---|---|
| Array | Required | the collection of data in an array or range with numerical values that indicate relative standing. |
| X | Required | the value for which you seek rank information. |
| Significance | Optional | a number that indicates how many significant digits there are in the percentage result that was returned.
PERCENTRANK employs three digits if it is removed (0.xxx). |
Return Parameter
The relative standing of a value within a data array
Use of PERCENTRANK Function

27. The POISSON Function
Function Objective
This function gives back the Poisson distribution to predict the number of events within a certain time period.
Syntax
POISSON(x,mean,cumulative)Arguments Explanation
| Argument | Required/Optional | Explanation |
|---|---|---|
| X | Required | The number of events. |
| Mean | Required | The expected numeric value. |
| Cumulative | Required | a logical value that establishes how the probability distribution is represented when it is returned.
If cumulative is TRUE, POISSON will return the cumulative Poisson probability that x random events will occur, with zero being the most likely outcome. If cumulative returns FALSE, POISSON delivers the Poisson probability mass function predicting that exactly x events will occur. |
Return Parameter
The Poisson distribution
Use of POISSON Function

28. The RANK Function
Function Objective
We can use this function to get the rank of a number from a collection of numbers.
Syntax
RANK (number,ref,[order])Arguments Explanation
| Argument | Required/Optional | Explanation |
|---|---|---|
| Number | Required | The number whose rank you want to find |
| Ref | Required | a collection of numbers or a reference to a list of numbers. In the ref, non-numeric values are disregarded. |
| Order | Optional | A number specifying how to rank number.
Microsoft Excel ranks numbers as though ref were a list arranged in decreasing order if the order is 0 (zero) or omitted. Microsoft Excel ranks numbers as though ref were a list arranged in ascending order if the order is any nonzero value. |
Return Parameter
The rank of a number from a collection of numbers
Use of RANK Function

29. The STDEV Function
Function Objective
This compatibility function in Excel is very useful for determining the standard deviation value from a sample that we provide.
Syntax
STDEV (number1,[number2],...)Arguments Explanation
| Argument | Required/Optional | Explanation |
|---|---|---|
| Number1 | Required | the first number argument representing a population sample. |
| Number2 | Required | Arguments in the range of 2 to 255 represent a sample of a population.
Instead of using arguments that are separated by commas, you can either use a single array or a reference to an array. |
Return Parameter
The standard deviation value from a sample
Use of STDEV Function

30. The TINV Function
Function Objective
This function finds the two-tailed inverse value of the student’s t-distribution data.
Syntax
TINV (probability,deg_freedom)Arguments Explanation
| Argument | Required/Optional | Explanation |
|---|---|---|
| Probability | Required | The probability associated with the two-tailed Student’s t-distribution. |
| Deg_freedom | Required | The probability associated with the two-tailed Student’s t-distribution. |
Return Parameter
The two-tailed inverse value of the student’s t-distribution data
Use of TINV Function

31. The TTEST Function
Function Objective
The TTEST function gives back the probability related to a student’s t-test.
Syntax
TTEST (array1,array2,tails,type)Arguments Explanation
| Argument | Required/Optional | Explanation |
|---|---|---|
| Array1 | Required | The first data set. |
| Array2 | Required | The second data set. |
| Tails | Required | Determines the number of distribution tails.
TTEST employs the one-tailed distribution if tails = 1. TTEST employs the two-tailed distribution if tails = 2. |
| Type | Required | The kind of t-Test to perform.
Look at the t-Test Table given below. |
Return Parameter
The probability related to a student’s t-test
Use of TTEST Function

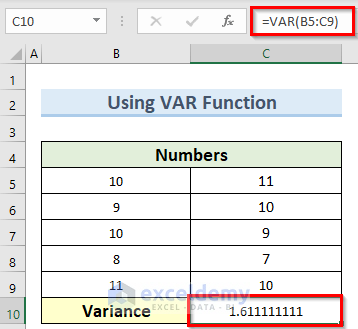
32. The VAR Function
Function Objective
We can use this function to get the variance from a sample we provide.
Syntax
VAR (number1,[number2],...)Arguments Explanation
| Argument | Required/Optional | Explanation |
|---|---|---|
| Number1 | Required | the first number argument representing a population sample. |
| Number2 | Optional | Number arguments 2 to 255 corresponding to a sample of a population. |
Return Parameter
The variance from a sample
Use of VAR Function
Read More: Most Useful and Advanced Excel Functions List
33. The WEIBULL Function
Function Objective
The function gives back the Weibull distribution which is useful for analyzing reliability.
Syntax
WEIBULL(x,alpha,beta,cumulative)Arguments Explanation
| Argument | Required/Optional | Explanation |
|---|---|---|
| X | Required | The value at which to evaluate the function. |
| Alpha | Required | A parameter to the distribution. |
| Beta | Required | A parameter to the distribution. |
| Cumulative | Required | determines the function’s shape. |
Return Parameter
The Weibull distribution
Use of WEIBULL Function

34. The ZTEST Function
Function Objective
The function is very useful to get back the one-tailed probability value from a z-test.
Syntax
ZTEST (array,x,[sigma])Arguments Explanation
| Argument | Required/Optional | Explanation |
|---|---|---|
| Array | Required | The array or range of data against which to test x. |
| X | Required | The value to test. |
| Sigma | Optional | The population (known) standard deviation. The sample standard deviation is applied if it is omitted. |
Return Parameter
The one-tailed probability value from a z-test
Use of ZTEST Function

Download Practice Workbook
You can download the practice workbook from here.
Conclusion
I hope that you were able to apply the methods that I showed in this tutorial on 34 practical examples of compatibility functions in Excel. As you can see, there are quite a few ways to use these functions. So wisely choose the function that suits your situation best. If you get stuck in any of the steps, I recommend going through them a few times to clear up any confusion. If you have any queries, please let me know in the comments.
Related Articles
- 51 Mostly Used Math and Trig Functions in Excel
- Top Excel Functions and Features for Management Consultants
<< Go Back to Excel Functions | Learn Excel
Get FREE Advanced Excel Exercises with Solutions!
