Introduction to TTEST Function in Excel
▶ Function Objective
The TTEST function in Excel is used to determine the probability of a significant difference between two data sets, whether one or both are from the same population and have the same mean.
▶ Syntax
=TTEST(array1,array2,tails,type)
▶ Arguments Explanation
| Argument | Required/Optional | Explanation |
|---|---|---|
| array1 | Required | The first data set |
| array1 | Required | The Second data set |
| tails | Required | The number of distribution tails is defined.
|
| type | Required |
|
▶ Return Parameter
Returns the TTEST probability. Use TTEST to see if two samples came from the same two underlying populations with the same mean.
One-tailed Test
A One-tailed test is a statistical test in which the critical region of distribution is one-sided, meaning it is either greater than or less than a specific value, but not both.
There are two alternatives for the null and alternative hypotheses in a one-tailed test, which correlates to where you position the critical region.
Null: The effect is less than or equal to zero.
Alternative: The effect is greater than zero.
Two-tailed Test
Two-tailed hypothesis tests are also known as nondirectional or two-sided tests.
Null: The effect equals zero.
Alternative: The effect does not equal zero.
Paired TTEST
Paired TTEST is a statistical method for determining if the mean difference between two sets of observations is zero.
Two-Sample TTEST
Two-sample TTEST is used to compare the means of two groups. This test is usually used to see if the means of two populations are different.
Using TTEST Function in Excel
Method 1 – Apply One-Tailed Test to TTEST Function in Excel
The sample dataset contains data on household spending on food in Europe and the United States. Because the samples are independent of one another, a two-sample t-test is used.
We want to see if the means of these two datasets are significantly different. For this, we can use a One-tailed TTEST.
The formula is,
Steps:
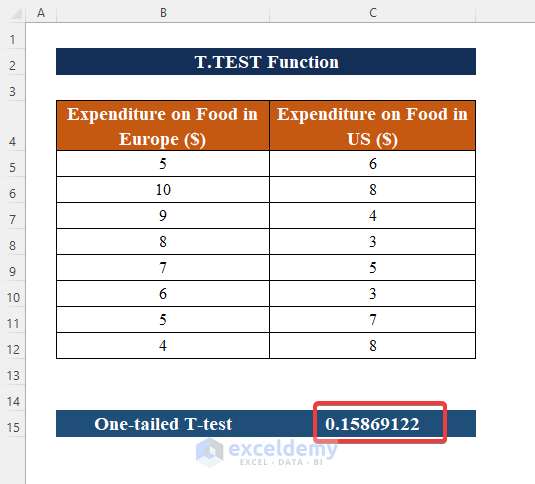
- Enter the formula in cell C15.
- Select 1 in the tails section for the One-tailed TTEST.
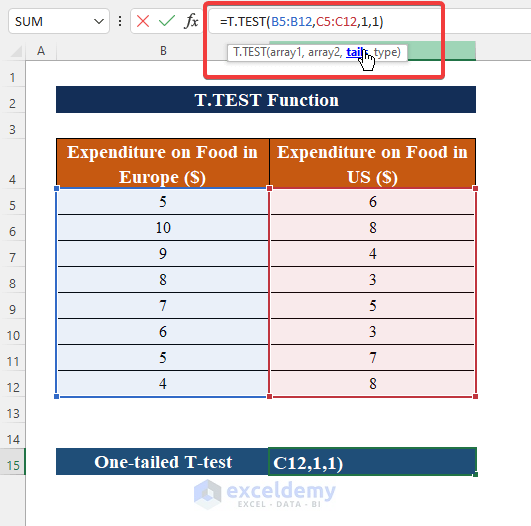
- Press Enter to see the results. Adjust the column widths to see all the data if required.
Method 2 – Use Two-tailed Test to TTEST Function in Excel
The mean is equal to x, which is our null hypothesis. A two-tailed test will determine whether or not the mean is substantially bigger than or less than x.
We will use a Two-tailed TTEST to determine the critical region of the distribution for both the higher and the lower than the specified mean value. The formula is,
=TTEST(B5:B12,C5:C12,2,1)Steps:
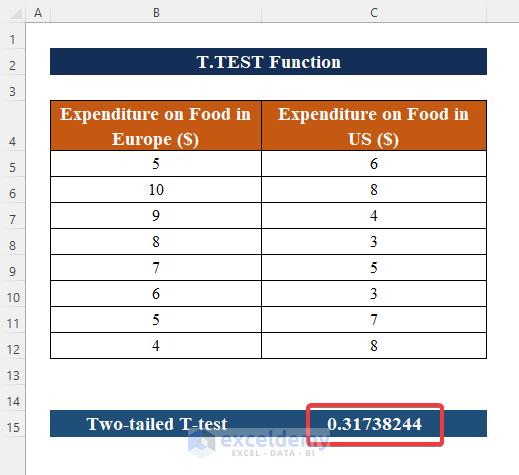
- Enter the formula in cell C15.
- Select 2 in the tails section for the Two-tailed TTEST.
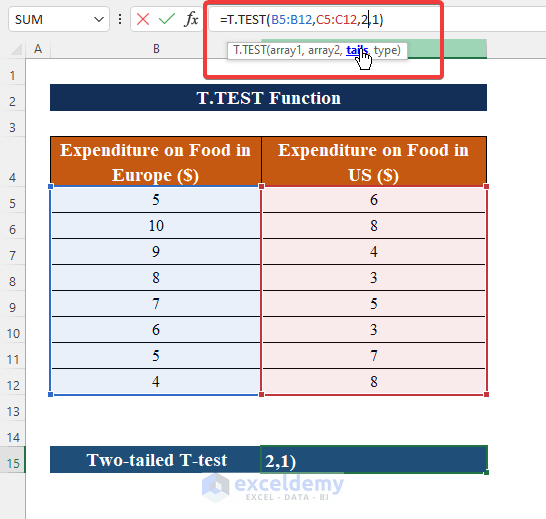
- Press Enter to see the results.
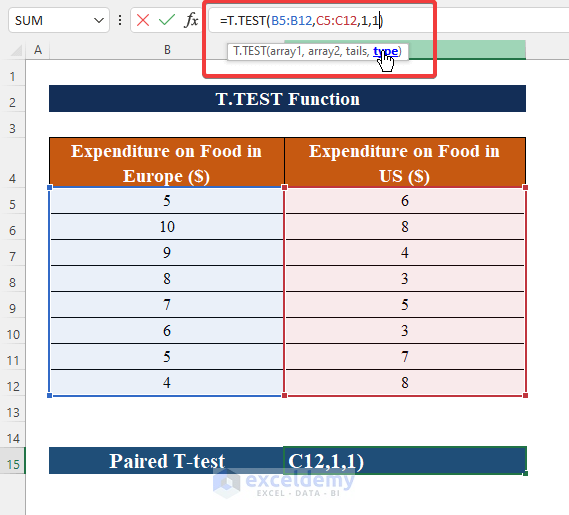
Method 3 – Perform Paired Type to TTEST Function in Excel
A paired TTEST is used to compare the differences between two variables for the same subject.
Each subject or entity is measured twice in a paired sample TTEST, resulting in pairs of observations. Case-control studies and repeated-measures designs are common uses for the paired sample TTEST.
The formula is,
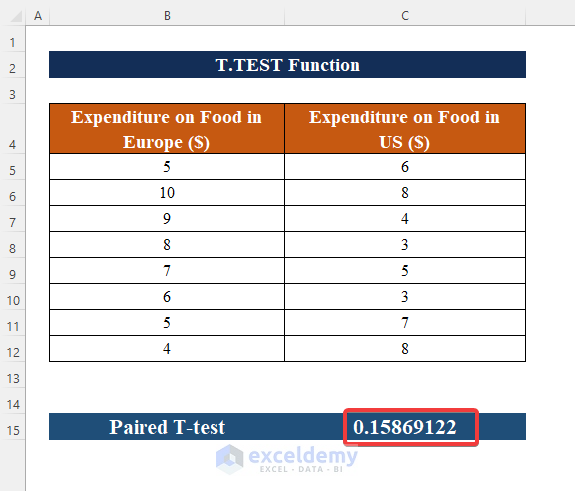
=TTEST(B5:B12,C5:C12,1,1)Steps:
- Enter the formula in cell C15.
- Select 1 in the type section for Paired Type TTEST.
- Press Enter to see the results.
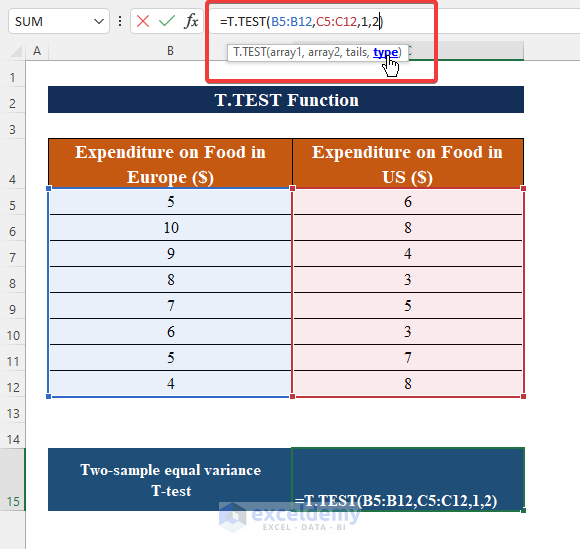
Method 4 – Apply Two-sample Equal Variance TTEST Function in Excel
Generally, all TTESTs are based on the assumption that your data came from regularly distributed populations.
The traditional TTEST, on the other hand, assumes that both groups’ standard deviations/variances are equal.
The equal variance TTEST can be used when you are fairly certain that the variances are equal.
The formula is,
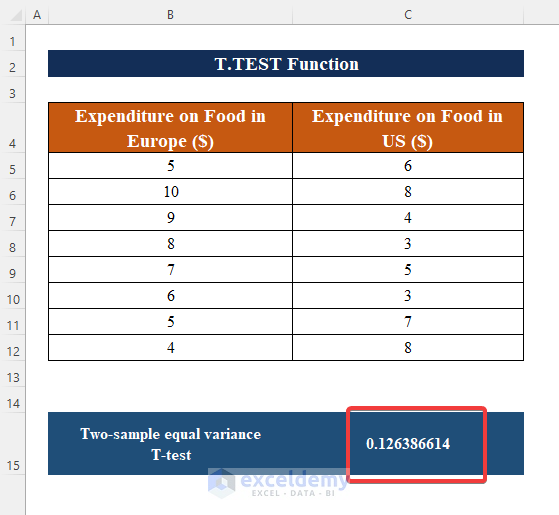
=TTEST(B5:B12,C5:C12,1,2)Steps:
- Enter the formula in cell C15.
- Select 2 in the type section for Two-sample equal variance TTEST.
- Press Enter to see the results.
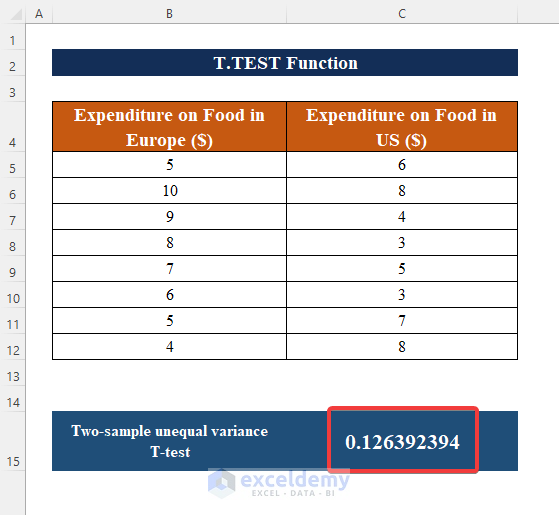
Method 5 – Use Two-Sample Unequal Variance TTEST Function in Excel
Use the unequal variances option of the 2-sample TTEST if you have unequal variances and unequal sample sizes.
The formula is,
=TTEST(B5:B12,C5:C12,1,2)Steps:
- Enter the formula in cell C15.
- Select 3 in the type section for the Two-sample unequal variance TTEST.
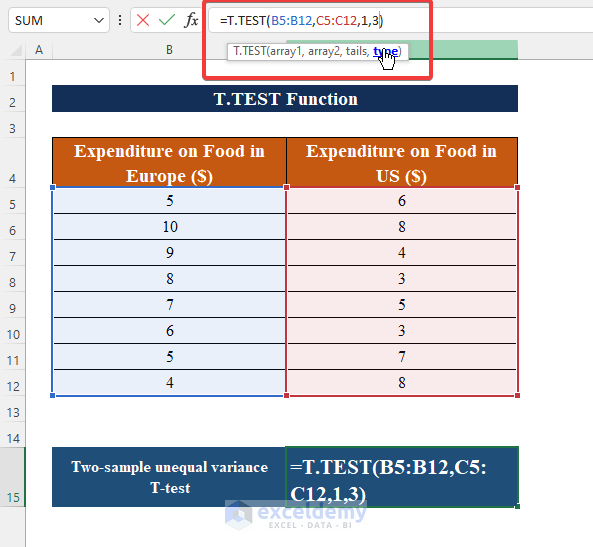
- Press Enter to see the results.
✍ Things to Remember
✎ The #NUM! error occurs when the tails argument is not 1 or 2, or the given type argument is not one of the following numbers: 1,2 or 3.
✎ #N/A! error occurs when the lengths of the two given arrays differ.
✎ Value error occurs when the given type of argument or the specified tails argument are both non-numeric.
Download Practice Workbook
<< Go Back to Excel Functions | Learn Excel
Get FREE Advanced Excel Exercises with Solutions!
