Microsoft Excel is a powerful software. We use Excel functions and features for our educational, business, and other mathematical analyses such as stock markets, measurements, etc. Furthermore, we can determine the partial correlation coefficients for finding the relationship between variables using the Excel formula and VBA approaches. With that in mind, let’s start from scratch and learn 3 suitable ways to calculate partial correlation in Excel.
Introduction to Partial Correlation
By minimizing the impact of the third variable, partial correlation determines the correlation between the 2 variables. There may be circumstances where there are numerous relationships between the variables. This might make correlation less accurate or even produce inaccurate results. The effects of other variables are eliminated via partial correlation. Let’s consider X and Y, two variables for which correlation needs to be determined. Think about the third variable, Z, which is connected to X and Y. The equation:

Where,
- X, Y, Z are three arbitrary variables.
- Partial Correlation (X, Y). Z = The partial correlation of the X variable & Y variable controlled by the Z variable.
How to Calculate Partial Correlation in Excel: 3 Suitable Ways
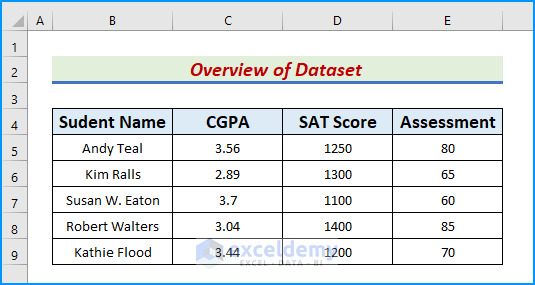
When two variables are conditional on one or more other factors, partial correlation measures the correlation between the two variables. Meanwhile, we can compute the partial correlation using the CORREL function, a formula based on the correlation equation, and a VBA approach. To demonstrate, we take a dataset that represents a student evaluation sheet. In this article, we can use a partial correlation to find the relationship between the student’s CGPA, SAT Score, and Assessment.
1. Utilize CORREL Function to Determine Partial Correlation in Excel
The first method aims to apply the CORREL function to determine the partial correlation coefficient. The CORREL function is under the Excel Statistical function category and calculates the correlation coefficient of the given cell ranges. Let’s follow the instructions carefully to implement the method.
Steps:
- First of all, add 2 columns F and G, and name the headers as Residual-1 and Residual-2 respectively.
- Here, we will use a regressional analysis model based on the dependent variable CGPA and independent variables SAT Score and Assessment.
- Also, we will use the INTERCEPT and the SLOPE functions for the regression model.
- Now, write the following formula in cell F5,
=D5-(INTERCEPT($D$5:$D$9,$C$5:$C$9)+SLOPE($E$5:$E$9,$C$5:$C$9)*C5)
- After that, press the Enter key to see the output.
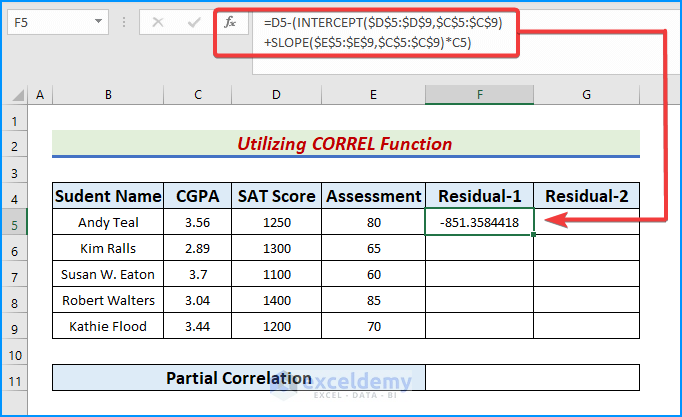
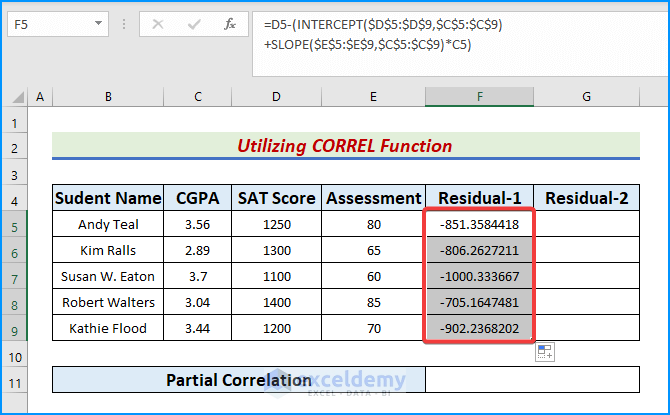
- Later, use the AutoFill icon to fill the rest of the column.
- Likewise, in cell G5, type:
=E5-(INTERCEPT($E$5:$E$9,$C$5:$C$9)+SLOPE($E$5:$E$9,$C$5:$C$9)*C5)
- Pressing the Enter button will display the output.

- Again, copy the formula cell down with the AutoFill tool.

- Further, to determine the partial correlation based on the residuals, type
=CORREL(F5:F9,G5:G9)
- Meanwhile, press Enter.
- Lastly, the result appears in our dataset.

- INTERCEPT($E$5:$E$9,$C$5:$C$9) calculates the location where column E will intersect column C.
- SLOPE($E$5:$E$9,$C$5:$C$9) returns the slope of the linear regression line through the known C column and known column E’s data points.
Read More: How to Do Correlation and Regression Analysis in Excel
2. Use Dynamic Correlation Equation to Calculate Partial Correlation in Excel
The objective of this method is to use the correlation equation mentioned previously and determine the partial correlation. Moreover, we will the SQRT function in the equation to calculate the variables. The SQRT function returns the square roots of integers. Therefore, follow the easy steps to see how it works.
Steps:
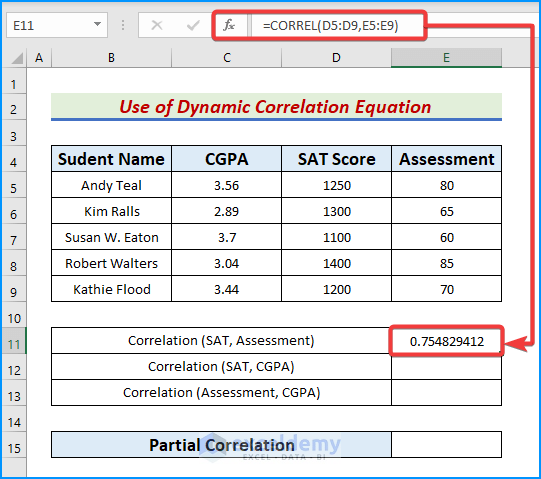
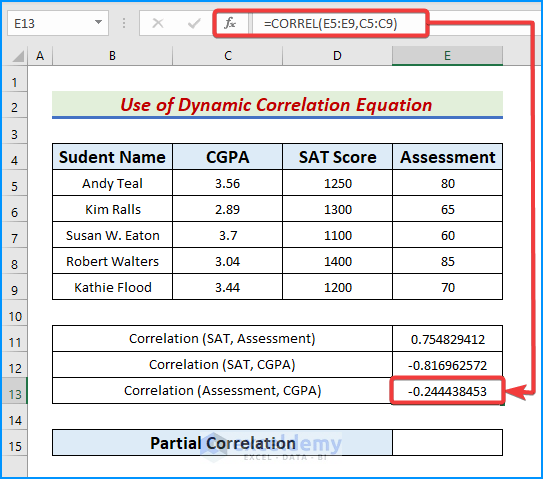
- First, let’s determine the coefficients of the given matrices.
- Consequently, in cell E11, type:
=CORREL(D5:D9,E5:E9)
- Now, tap the Enter key.
- Similarly, in cell E12, write the formula below.
=CORREL(D5:D9,C5:C9)
- Further, press Enter.

- Likewise, in cell E13, input the formula:
=CORREL(E5:E9,C5:C9)
- By pressing the Enter or Tab key, we get the coefficients.
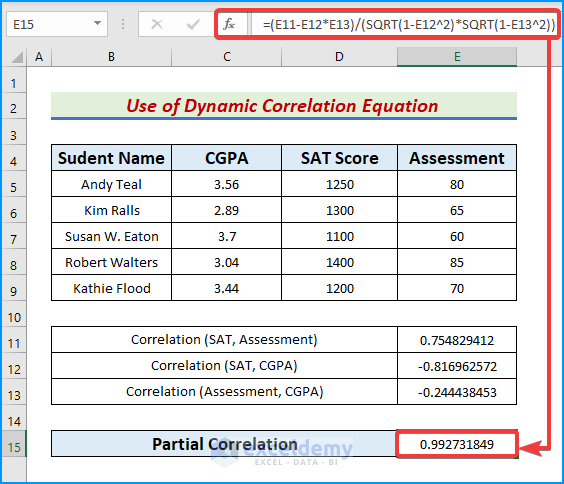
- Meanwhile, let’s calculate the partial correlation based on the obtained coefficients using the following formula in cell E15.
=(E11-E12*E13)/(SQRT(1-E12^2)*SQRT(1-E13^2))
- Lastly, press the Enter key one more time.
- Thus, we obtain our desired result.
Read More: How to Calculate Cross Correlation in Excel
3. Run a VBA Code to Compute Partial Correlation in Excel
In our last method, we will thoroughly calculate the partial correlation using Excel VBA. Furthermore, we will see the use of VBA functions and objects in this method. Let’s dive into the instructions to run the code perfectly.
Steps:
- Firstly, go to the Developer tab and click Visual Basic.
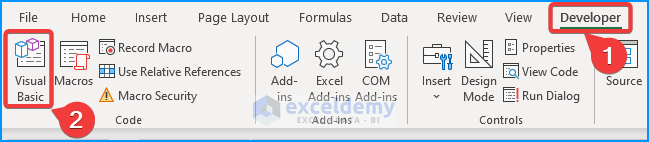
- Subsequently, the Visual Basic window pops up.
- Later, tap the Insert tab and then Module.

- Eventually, the module box appears.
- There, type the following VBA code.
Sub SOFTEKO_PAR_CORR()
Range("E11").Select
ActiveCell.FormulaR1C1 = "=CORREL(R[-6]C[-1]:R[-2]C[-1],R[-6]C:R[-2]C)"
Range("E12").Select
ActiveCell.FormulaR1C1 = "=CORREL(R[-7]C[-1]:R[-3]C[-1],R[-7]C[-2]:R[-3]C[-2])"
Range("E13").Select
ActiveCell.FormulaR1C1 = "=CORREL(R[-8]C:R[-4]C,R[-8]C[-2]:R[-4]C[-2])"
Range("E15").Select
ActiveCell.FormulaR1C1 = _
"=(R[-4]C-R[-3]C*R[-2]C)/(SQRT(1-R[-3]C^2)*SQRT(1-R[-2]C^2))"
Range("E16").Select
End Sub
- Lastly, press the green Run button.
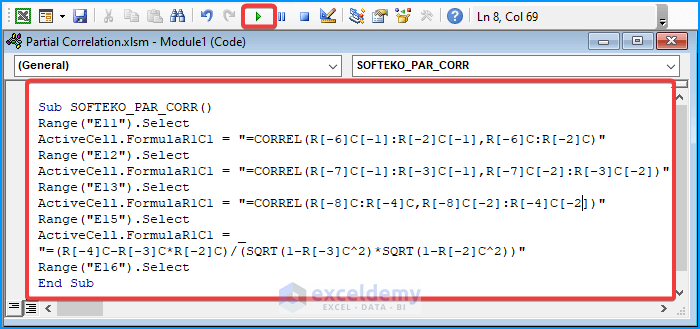
- As a result, the desired outputs pop up on the display.

Download Practice Workbook
Download this practice workbook to exercise while reading this article. It contains all the datasets in different spreadsheets for a clear understanding. Try it yourself while you go through the whole process.
Conclusion
In conclusion, we have discussed some suitable ways to calculate partial correlation in Excel. Please leave any further queries or recommendations in the comment box below.
Related Articles
- How to Make a Correlation Scatter Plot in Excel
- How to Calculate Correlation between Two Stocks in Excel
- How to Make Correlation Graph in Excel
- How to Make a Correlation Table in Excel
- How to Make a Correlation Matrix in Excel
- How to Interpret Correlation Table in Excel
- How to Make Correlation Heatmap in Excel
- How to Calculate Autocorrelation in Excel
<< Go Back to Excel Correlation | Excel for Statistics | Learn Excel
Get FREE Advanced Excel Exercises with Solutions!
