The image below depicts the complete output of linear regression analysis.
Introduction to Correlation and Regression
Correlation is an expression of how closely two variables are linearly related. It is a typical technique for describing apparent connections without stating cause and consequence.
In statistical analysis, Correlation is measured by a coefficient denoted by “r”.
Let’s assume a set of data labeled by two variables, X and Y. Thus, the Correlation Coefficient can be formulated as:
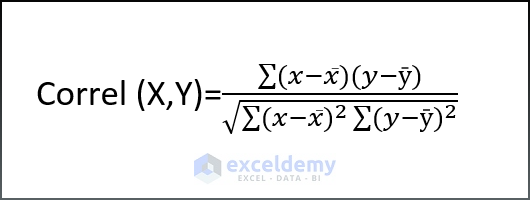
Where,
- x̄ and ȳ are the sample means AVERAGE of X variable and AVERAGE of Y variable.
On the other hand, Regression analysis is a statistical technique devoted to estimating the connection between one dependent and two or more independent variables. It can be used to simulate the long-term link between variables and evaluate the future outcome of the dependent variable. For Linear Regression Analysis, a linear line equation can be formulated as below,
Where,
- Y is the dependent variable, and X is the independent variable. m is the slope of the straight line.
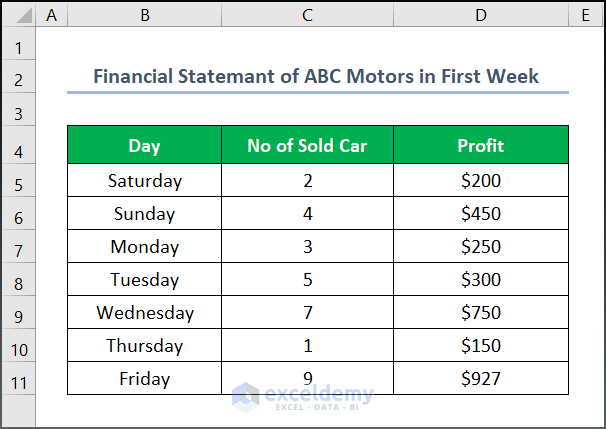
We have chosen a dataset named “Financial Statement of ABC in First Week” to accomplish our task. However, you may select any suitable dataset.
Step 1: Calculate the Correlation Coefficient
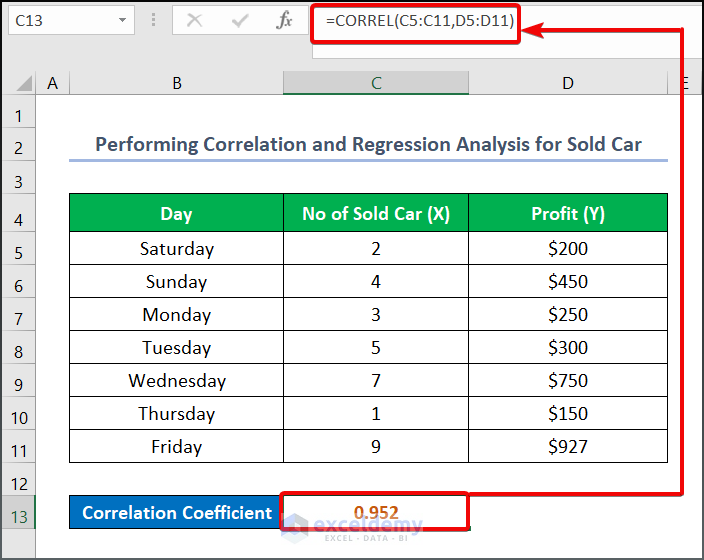
- Enter the following formula in cell C13:
=CORREL(C5:C11,D5:D11)- Press the ENTER button to see the output.
Read More: How to Calculate Partial Correlation in Excel
Step 2: Compute the Constant and Intercepting value for the Regression Line
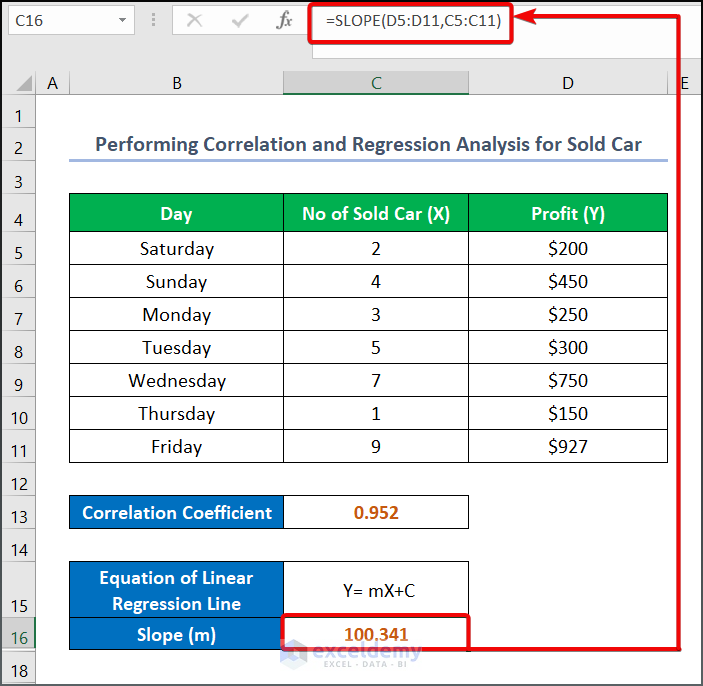
- Enter the following formula in cell C16 to calculate the slope value:
=SLOPE(D5:D11,C5:C11)- Press ENTER to see the output.
- Enter the following formula in cell C17 to compute the intercepting value of the Regression line:
=INTERCEPT(D5:D11,C5:C11)- Press ENTER.
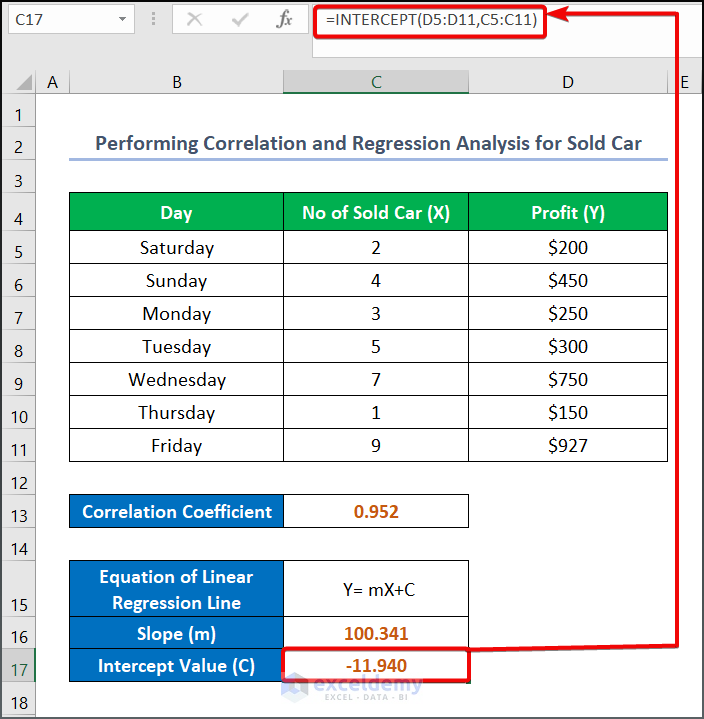
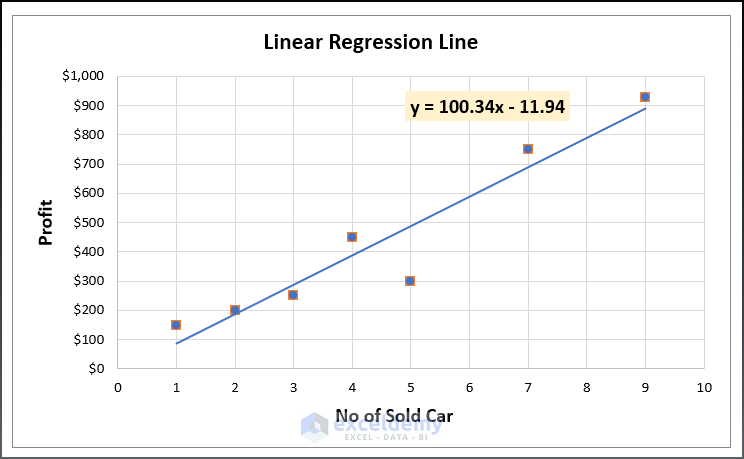
Here, the Correlation Coefficient indicates how closely the data point aligns with the Regression line. The given dataset’s correlation coefficient value of 0.952 indicates that the data points are closely aligned with the created trendline. However, the slope value of the regression line shows the profit change per the number of cars sold. The intercept value indicates that the profit will be -11.940 when the number of cars sold is zero.
Read More: How to Calculate Cross Correlation in Excel
How to Do Correlation Analysis in Excel
Steps:
- Go to the C13 cell.
- Enter the formula as given below.
- Press ENTER.
=PEARSON(C5:C11,D5:D11)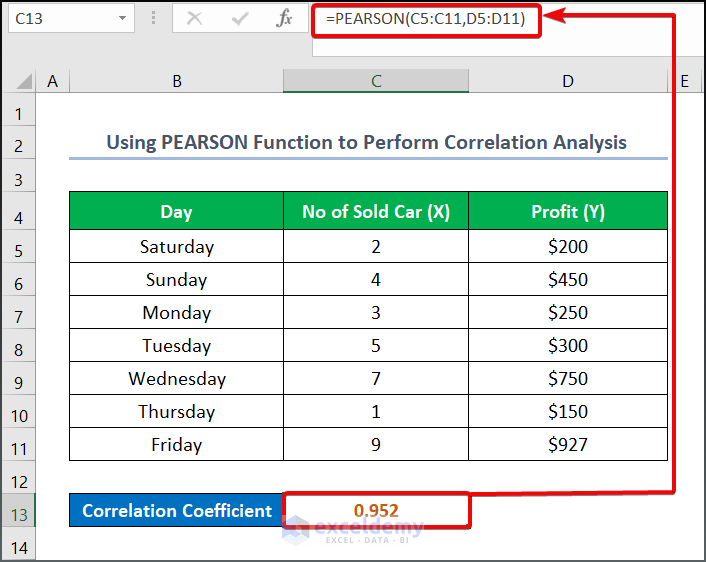
Read More: How to Calculate Autocorrelation in Excel
How to Accomplish Regression Analysis in Excel
Steps:
- Select the range of the dataset from C5:D11.
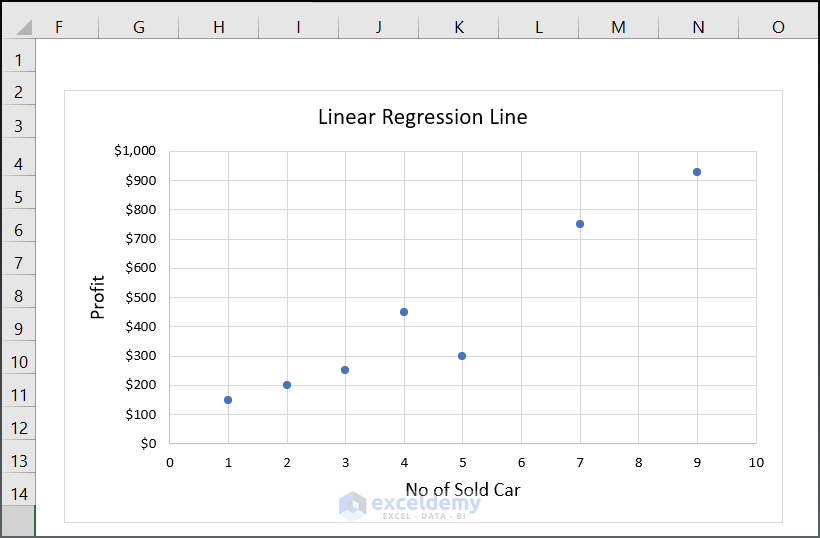
- Go to the Insert tab >> Charts group >> Insert Scatter or Bubble Chart group >> Scatter.
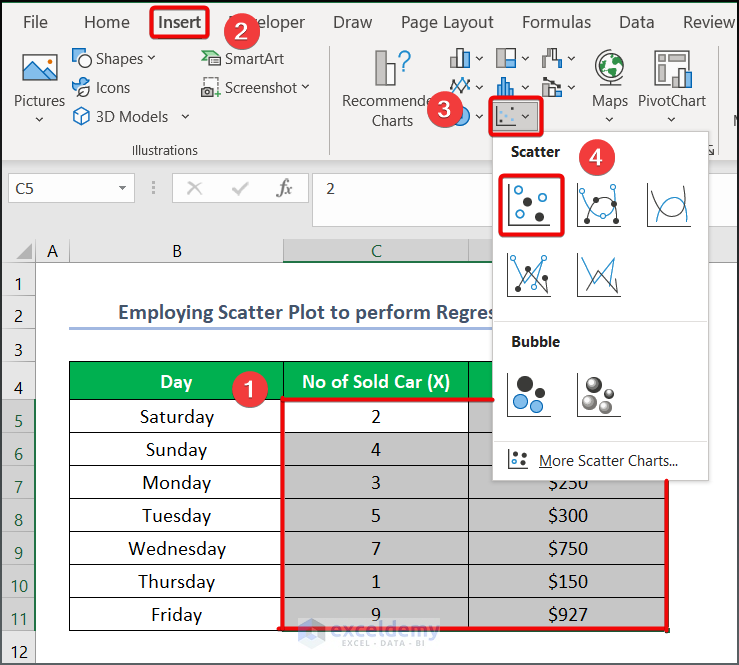
You will get an output as given below.
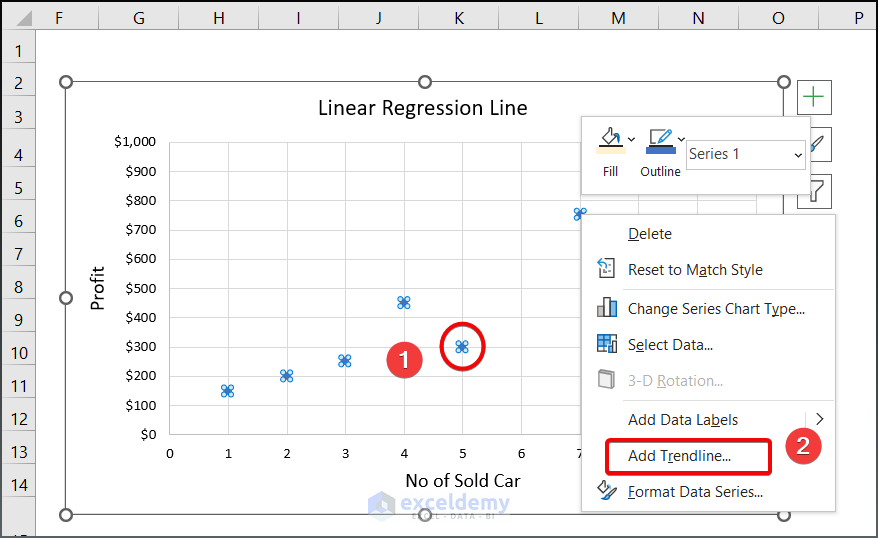
- Click one of the data points on your chart.
- Right-click on your mouse.
- Press on the Add Trendline option.
- On the right side of your Excel interface, a wizard will appear.
- Select Linear as your Trendline option.
- Select Display Equation on Chart.
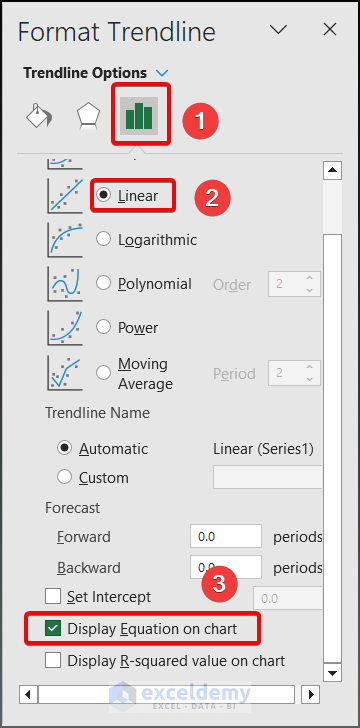
You will get the final output along with the trendline below.
Read More: How to Make Correlation Graph in Excel
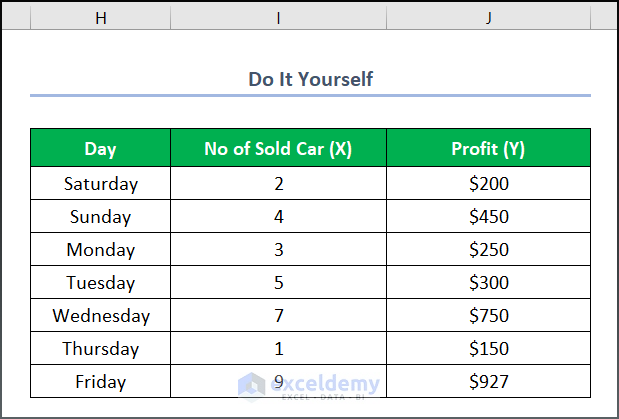
Practice Section
We have provided a Practice section on the right side of each sheet so you can practice.
Download the Practice Workbook
You can download and practice the dataset.
Related Articles
- How to Make a Correlation Scatter Plot in Excel
- Find Correlation Between Two Variables in Excel
- How to Calculate Correlation between Two Stocks in Excel
- How to Make a Correlation Table in Excel
- How to Make a Correlation Matrix in Excel
- How to Interpret Correlation Table in Excel
- How to Make Correlation Heatmap in Excel
<< Go Back to Excel Correlation | Excel for Statistics | Learn Excel
Get FREE Advanced Excel Exercises with Solutions!
