What Is Correlation?
Correlation is a statistical measure that indicates the strength of the relationship between two variables.
In a positive correlation as one variable increases, so does the other, whereas in a negative correlation one variable increases, and the other decreases.
Correlation Coefficient Interpretation
In the correlation coefficient, r falls in the range of +1.0 to -1.0, depending on the strength of the relationship between the two variables.
- An r of 0 indicates that there is no relationship between the two variables.
- An r of +1.0 describes a positive correlation between two variables, whereas an r of -1.0 describes a negative correlation.
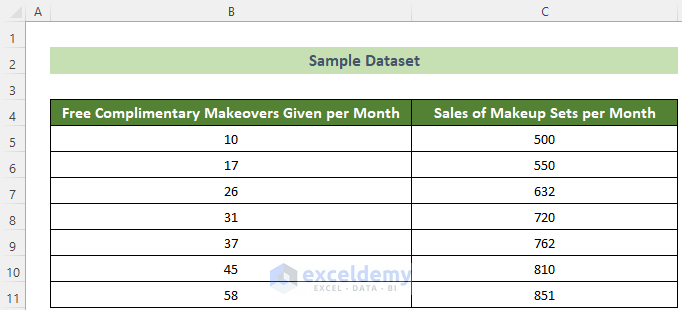
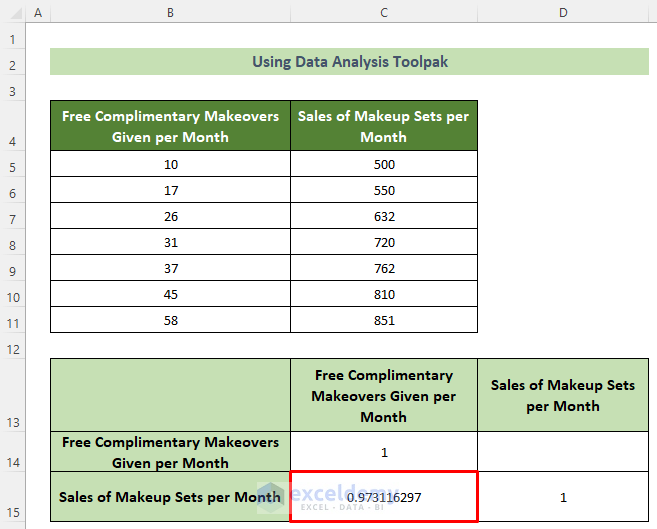
This is the sample dataset.
To know the relationship between the monthly number of free complimentary makeovers given by the beauty department and the monthly sales of makeup sets in that department.
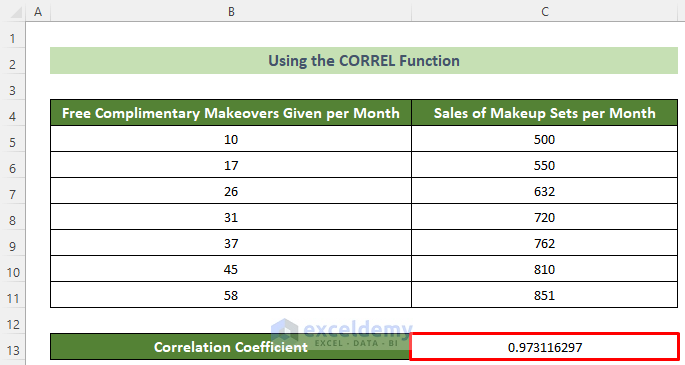
Method 1 – Using the CORREL Function in Excel 2007 | 2010 | 2016 or More recent versions
Steps:
- Select C13 cell and enter the following formula.
=CORREL(B5:B11,C5:C11)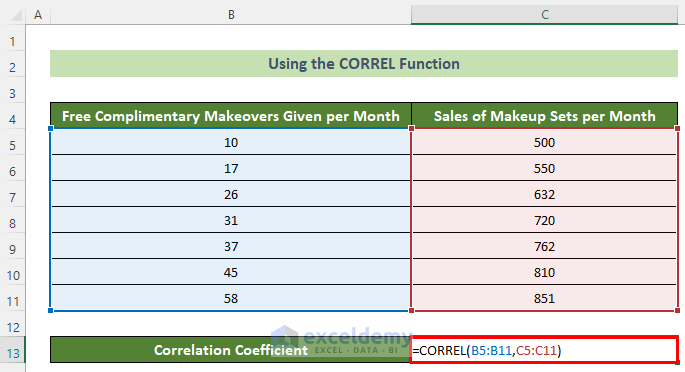
- Press Enter.
The two selected variables are positively related.
Read More: How to Make a Correlation Table in Excel
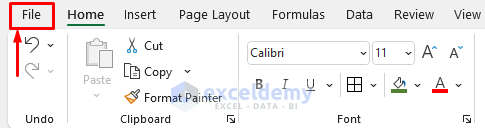
Method 2 – Using the Data Analysis ToolPak to Find the Correlation Between Two Variables
Steps:
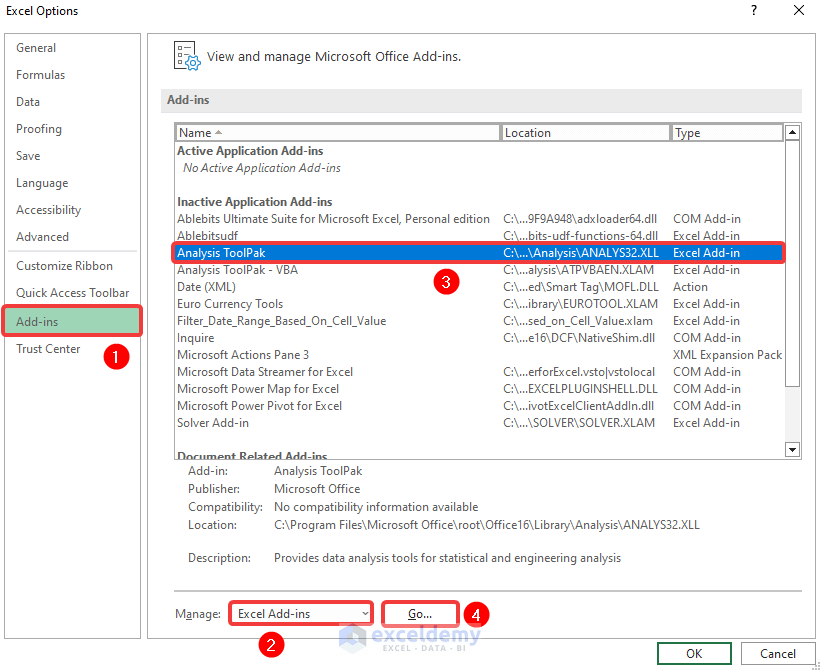
- Go to the File tab.
- Choose Options in the File tab.

- In the Excel Options window, go to Add-ins.
- Choose Excel Add-ins in Manage:.
- Select Analysis ToolPak in Inactive Applications Add-ins.
- Click Go… .
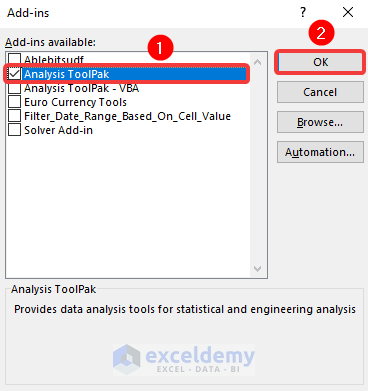
- In the Add-ins window, choose Analysis ToolPak and click OK.
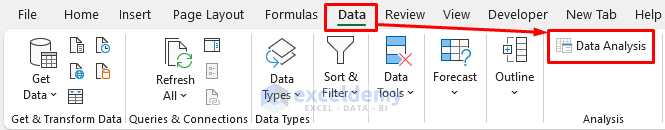
- Data Analysis is displayed in the Data tab.
- Go to the Data tab >> Data Analysis tool.
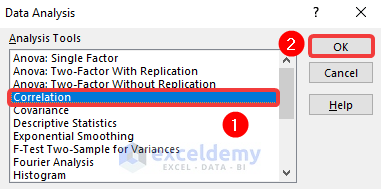
- In the Data Analysis window, click Correlation.
- Click OK.
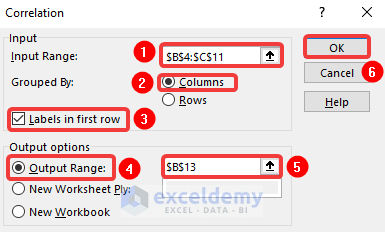
- In the Correlation window, choose the Input Range: as B4:C11 >> choose Columns in Grouped By: >> check Labels in first row.
- In Output options , select Output Range: and enter B13.
- Click OK.
The correlation matrix will be displayed in B13:
Read More: How to Calculate Cross Correlation in Excel
Method 3 – Use the PEARSON Function in Excel to Find the Correlation
Steps:
- Select C13 cell and enter the following formula.
=PEARSON(B5:B11,C5:C11)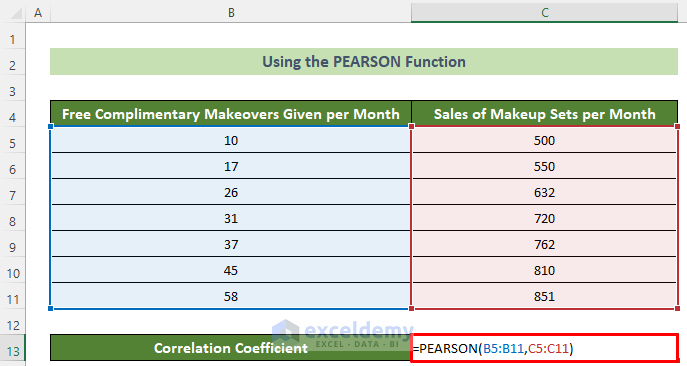
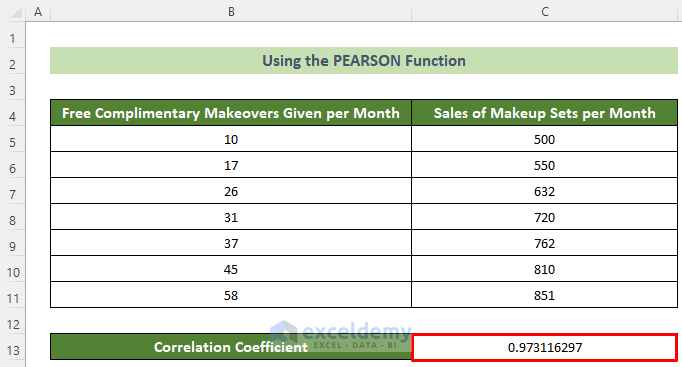
- Press Enter.
You will get the correlation coefficient for these two arrays:
Read More: How to Calculate Autocorrelation in Excel
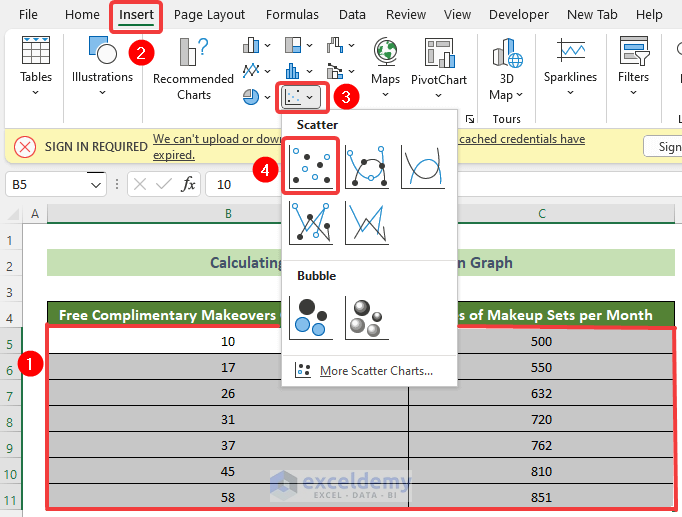
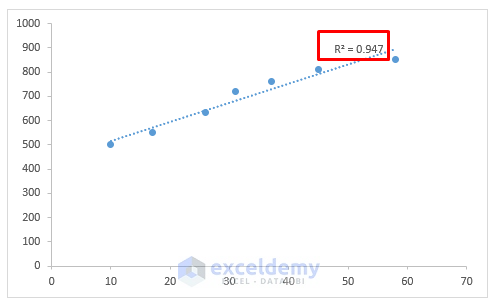
Calculate the Correlation Coefficient in an Excel Graph
Steps:
- Select the variables: B5:C11.
- Go to the Insert tab >> Insert Scatter (X,Y) or Bubble Chart >> Scatter.
A scatter chart is displayed.
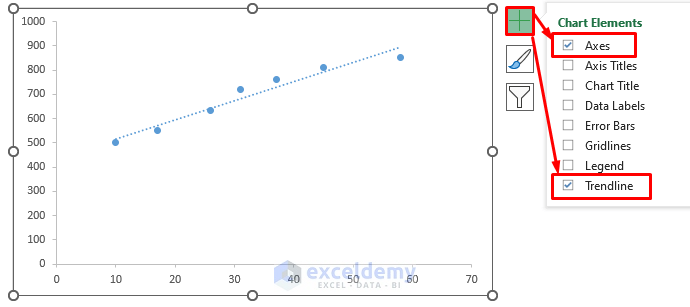
- Click Chart Elements >> check Axes and Trendline.
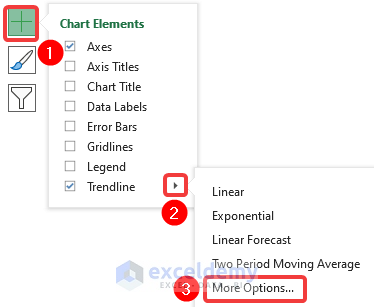
- Click Chart Elements >> Rightward arrow beside Trendline >> More Options… .
- In the Format Trendline pane, go to Trendline Options >> check Display R-squared value on chart.
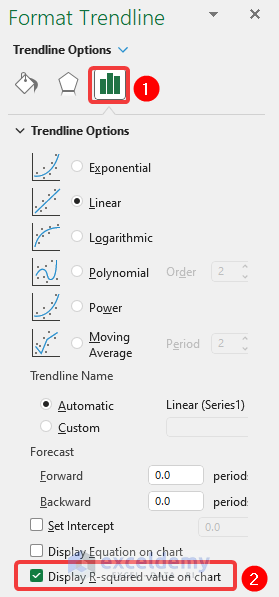
You will see the R-squared value inside the graph. This is the correlation coefficient squared value.
Read More: How to Make Correlation Graph in Excel
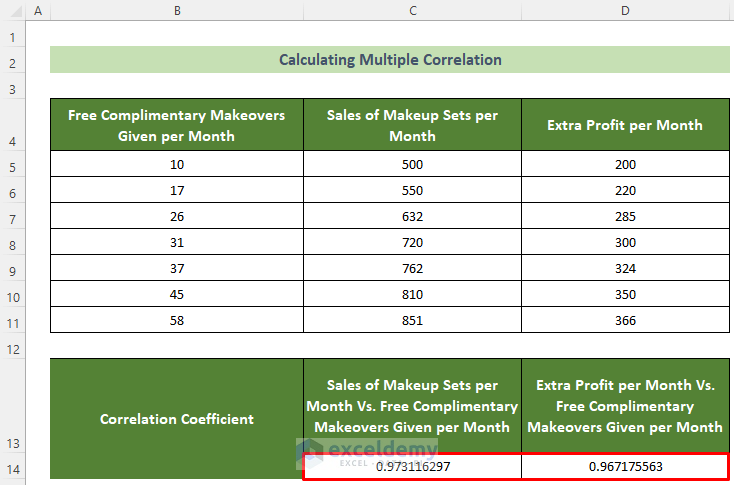
Multiple Correlation in Excel: Correlation Among More Than Two Variables
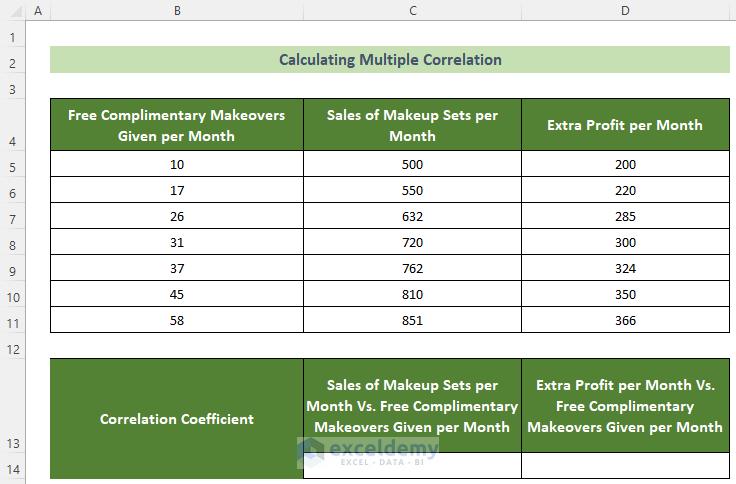
Find multiple correlations:
One between the Sales of Makeup Sets per Month and Free Complimentary Makeovers per Month.
The other between the Extra Profit per Month and the Free Complimentary Makeovers per Month.
Steps:
- Select C14 cell and use the following formula.
=CORREL(B5:B11,C5:C11)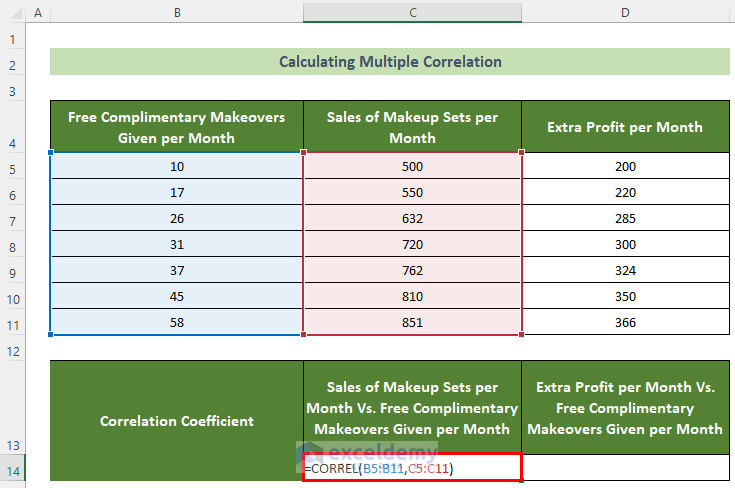
- Press Enter.
- Select D14 and enter the following formula.
=CORREL(B5:B11,D5:D11)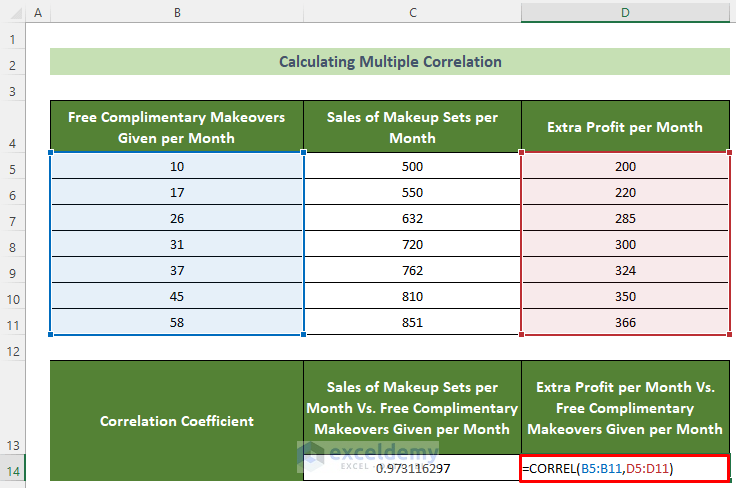
- Press Enter.
This is the output.
Things to Remember
- Correlation results do not indicate a cause and effect relationship, since other factors may be involved.
- To find a cause and effect relationship, use linear regression.
Download Practice Workbook
Download the practice workbook.
Related Articles
- How to Make a Correlation Scatter Plot in Excel
- How to Calculate Correlation between Two Stocks in Excel
- How to Do Correlation and Regression Analysis in Excel
- How to Interpret Correlation Table in Excel
- How to Make Correlation Heatmap in Excel
- How to Calculate Partial Correlation in Excel

