Method 1 – Machine Learning Algorithm
Step-1: Prepare Training Data
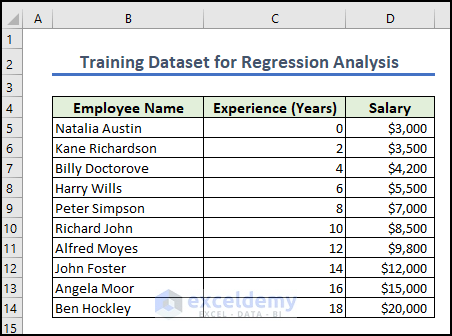
To demonstrate the whole procedure, we have taken the following sample dataset, which includes 10 rows and 4 columns: Employee Name, Experience (Years), and Company Salary.
In this process, we will find a machine-learning model chart and a modeled salary structure for the employees. The dataset is preprocessed. If it is not, you need to preprocess the data, which means – discarding missing data, encoding categorical data, etc.
Step-2: Select Model
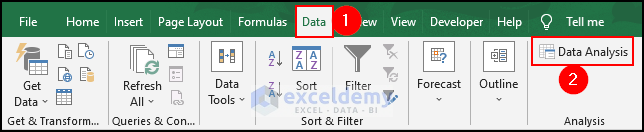
- Eenable the Analysis Toolpak.
- Go to the Data tab>> select Data Analysis.
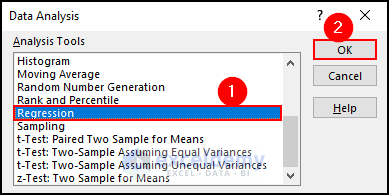
- The Data Analysis dialog box will appear. Select Regression and click OK.
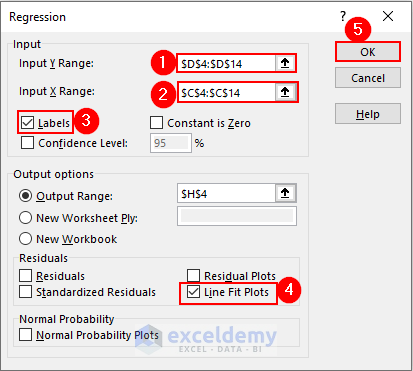
- In the Regression window, insert range D5:D14 as Y and range C4:C14 as X. As the salaries are dependent on experience, salary will be the Y values, and experience will be the X
- Make sure you check Line Fit Plots and Labels.
- Select H4 as the Output Range since we want the analysis data in the current worksheet.
- Click OK.
- The regression analysis outcome is in the current sheet. We will also see there are some regression parameter values (coefficients, standard Error, t Stat, etc.).
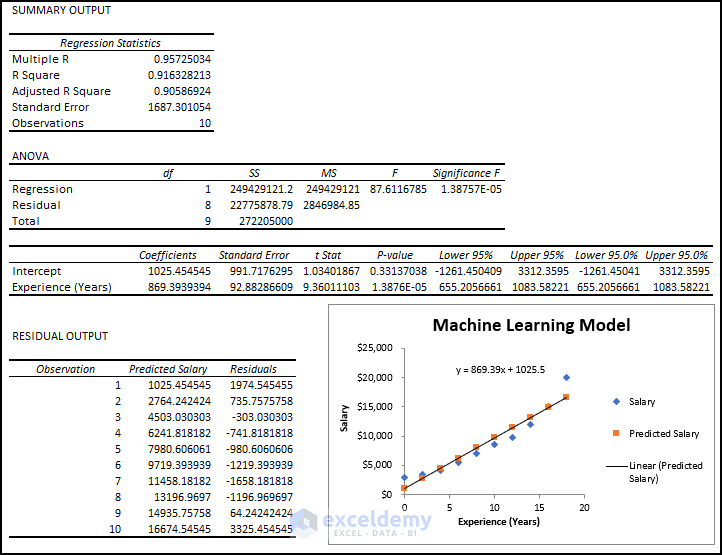
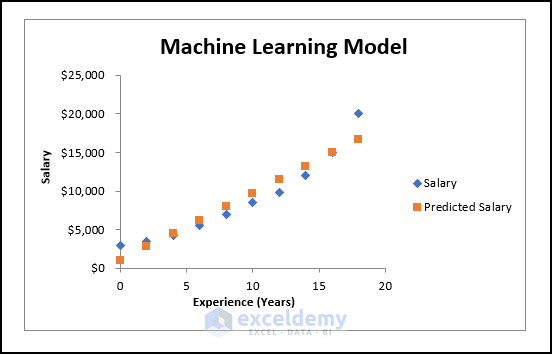
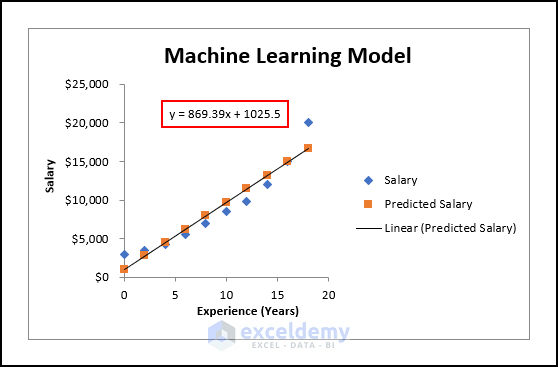
- You will need the analysis data from the graph. It plots both the Series Data (approximate salaries) and Predicted Data (salaries for modeling).
- Give your graph a title if you want. We named this chart Machine Learning Model.
Step-3: Predict Data
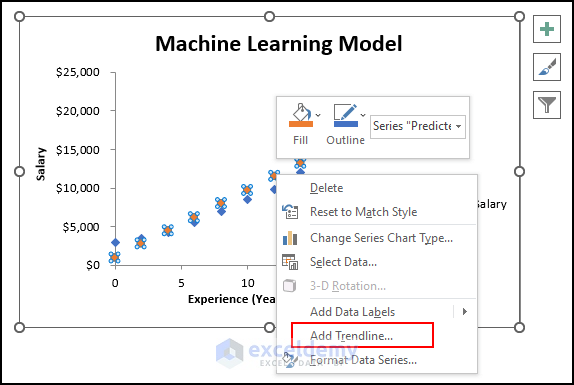
- Right-click on any of the points on this chart and select Add Trendline.
- Select Linear and check Display Equation on Chart from the Format Trendline window.
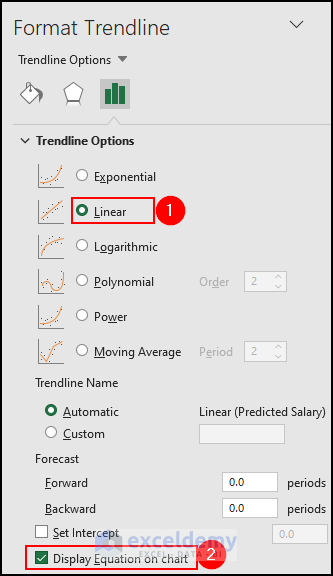
- You will see the straight-line plot and the equation for this machine-learning model.
- Develop a formula using this equation to model the salaries. We have created a new column to store the Modeled Salaries.
- Type the following formula in cell E5 and press ENTER.
- AutoFill the remaining columns in the column to apply the formula.
- This will provide the salary for an employee with 0 years of experience.
=C5*869.3939394+1025.454545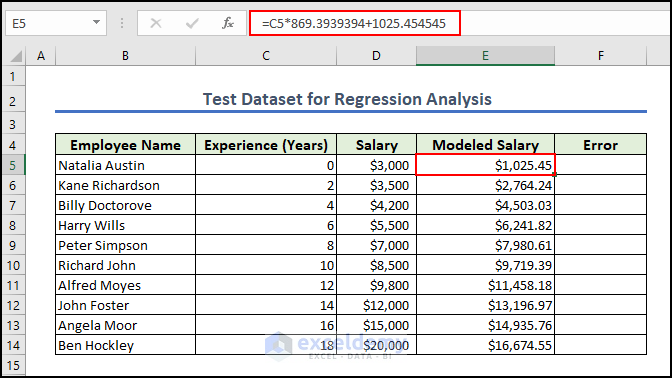
Step-4: Evaluate Model’s Performance
- Type the formula in cell F5 to compare with real data and press Enter.
- Then AutoFill the rest of the cells to apply the same formula.
=D5-E5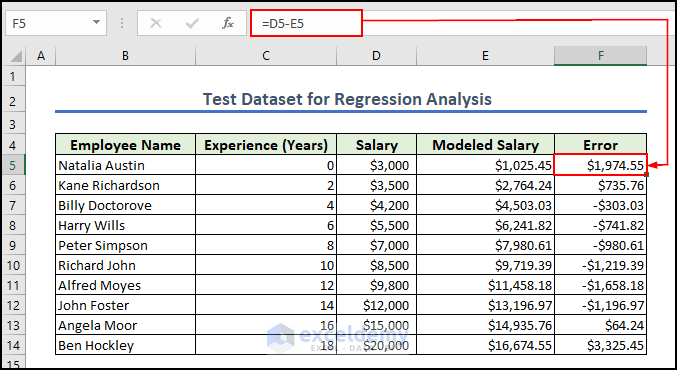
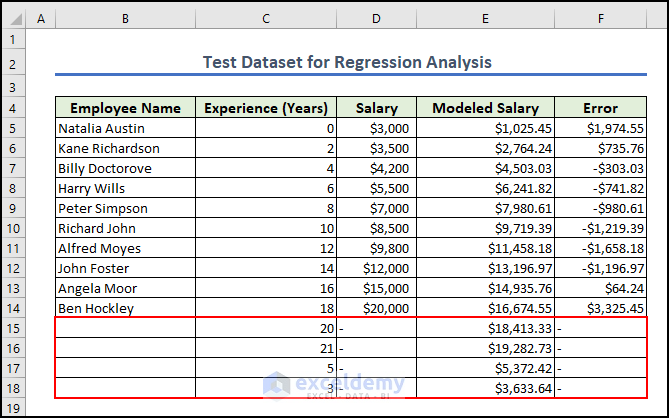
- We found the predicted salaries for four more unknown values.
- If the actual values are known, you can rerun the regression analysis using them, improving the model.
We require this for various reasons, including working with time. Hopefully, you can now make the necessary adjustments with ease.
Method 2 – Betting Algorithm
We will discuss another type of algorithm named Betting Algorithm. A sports betting algorithm locates objective reference points from which to calculate the likelihood of each possible outcome. The program will eventually find lucrative betting opportunities by assessing teams’ ability more accurately than bookmakers. A good betting model, however, can present opportunities that most bettors would never consider. The algorithm can help us to find:
- Identifying the issue
- Constructing the solution
- Monitoring outcomes
- Professionalism
Using Excel functions and the calculation of the data given, we can build an algorithm that will provide us with possible outcomes in no time. To illustrate, we take a dataset representing the Soccer Kicker fixtures of a week. Columns B & C have the list of the teams, and the rest consists of their previous match records. We show a portion of the dataset in the image below.
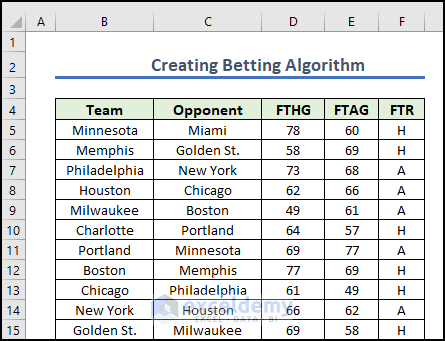
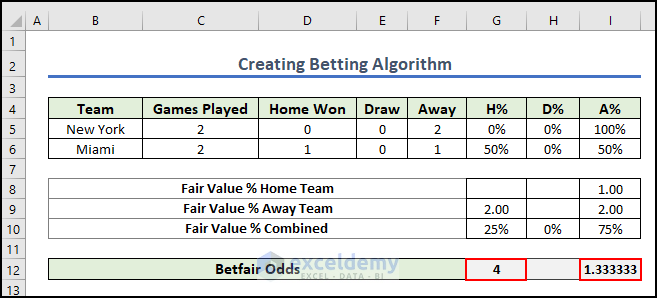
We will use Excel’s COUNTIF, SUM and IFERROR functions to calculate the data. After implementing the functions accurately we can predict the winning possibilities of any team. We selected two teams: New York and Miami. You can select any team to calculate the possibilities.
We can see from the result that we get 4 points for the home team and 1.333333 for the away team. We can predict that the home team has a much higher chance of winning.
Method 3 – Lottery Prediction Algorithm
We will discuss the Lottery Prediction Algorithm. An algorithm that assists in selecting the appropriate number combinations is known as a lottery prediction algorithm. This algorithm will generate a large number of random numbers, and we will predict the numbers that are most likely to occur based on the random numbers. We will repeat the tasks multiple times to increase the probability of prediction.
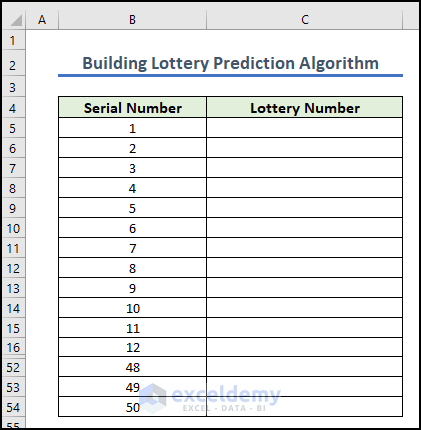
To demonstrate the procedure of building a lottery prediction algorithm in Excel, we will use 2 columns. In the 1st column, there will be a series of lottery numbers. And in the 2nd column, we will calculate the weightage value of the serial number. Weightage value means the probability of selecting the serial number. We have inserted the Serial Number of the lottery up to 50.
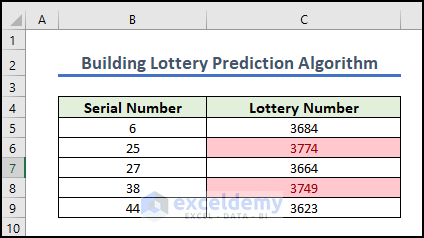
We will use the COUNTIF function, Conditional Formatting and the RANDBETWEEN function to complete the whole calculation. As mentioned earlier we have repeated the tasks multiple times to increase the probability of prediction and reached the stage shown in the image. We can see that Serial Numbers 25 and 38 are the most probable numbers.
Also quickly determine the probability of a specific lottery by using the COMBIN function. The COMBIN function will find the total number of groups from the given values.
Method 4 – Decision Tree Algorithm
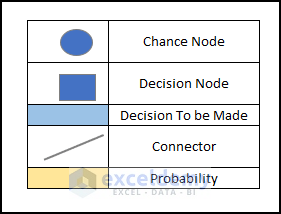
The three major components of a decision tree are decision nodes (possible options), chance nodes (probability), and end nodes (outcomes).
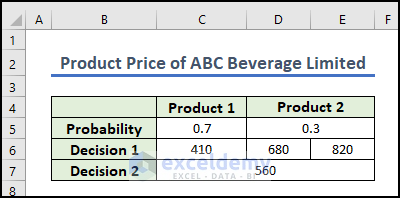
We take a dataset, namely “Product Price of ABC Beverage Limited”. We will create a decision tree for four different events where we have attached a dataset that describes two decision compressing of four different events.
The image attached below depicts the required shapes that we will use to draw the tree.
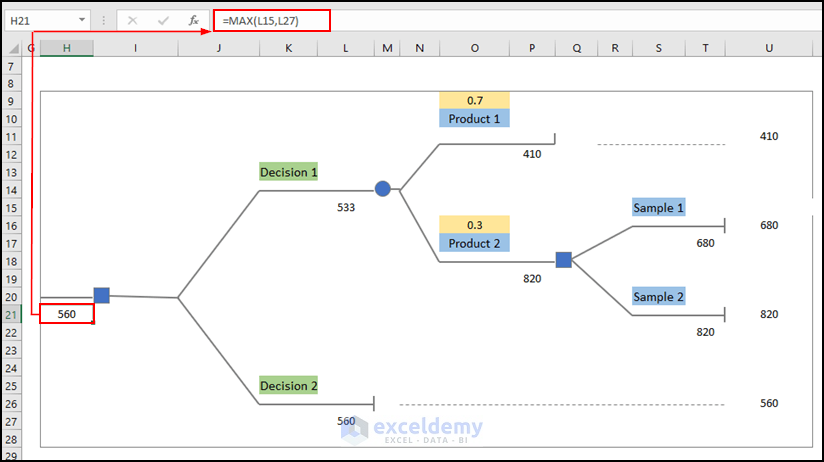
We made a basic outline of the tree and then we have labeled & input values in the Decision Tree. With Excel’s IF, SUM, ABS, and MAX functions, we are able to get the best decision from our dataset, which is 560.
Method 5 – Rainflow Counting Algorithm
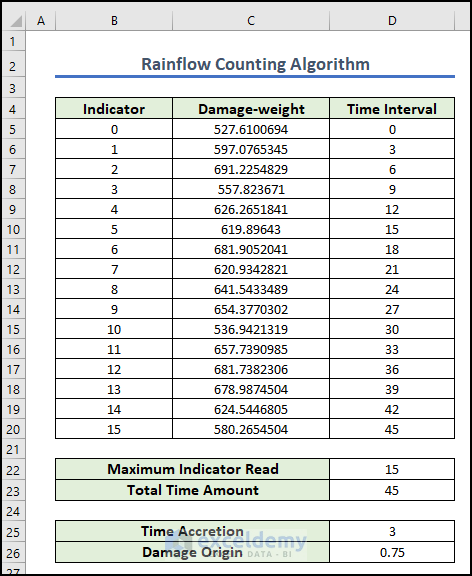
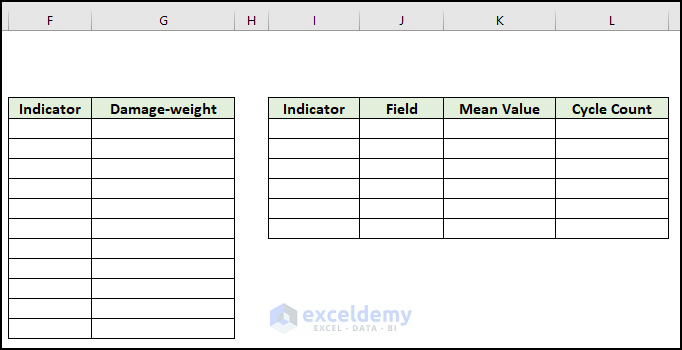
Establish a data model for the Rainflow Counting theorem. The dataset has three columns: Indicator, Damage-weight, and Time Interval. In the next steps, make other necessary information, like Maximum Indicator and Total Time Amount. Time Accretion and Damage Origin are the next two information boxes.
For the reversal array, two columns will be needed, titled Indicator and Damage-weight. Show the other four columns: Indicator, Field, Mean Value, and Cycle Count.
Open the Visual Basic for Applications window to build the Rainflow Algorithm in Excel and run the VBA code to determine the rainflow cycles.
It will provide the desired output, like the following.

Make a Flowchart in Excel
A flowchart is a diagrammatic representation of a workflow or process. Basically, we use flowchart to analyze and design a solution model. You can create a flowchart in Microsoft Excel, Word, and PowerPoint. Flowcharts can help show the connections between different data points, making your numbers clearer. Moreover, flowcharts help a viewer to understand the whole procedure of a new project plan in brief steps. They especially come in handy when presenting a new project to the board of executives.
Flowcharts display steps as different-shaped boxes. To represent the order of the workflow, the boxes are connected by lines and arrows. A more effective kind of flowchart is an Interactive Flowchart. In this flowchart, decision steps are included instead of just showing the one-way workflow. The workflow order can also be modified.
Check out these two articles on ExcelDemy for a detailed overview of creating a one-way workflow flowchart and an Interactive Flowchart in Excel: Create a Flowchart in Excel and Make an Interactive Flowchart in Excel
Frequently Asked Questions
1. What are 3 ways to write an algorithm?
We can express an algorithm in many ways, including natural language, flow charts, pseudocode, and of course, actual programming languages. Natural language is a popular choice since it comes so naturally to us and can convey the steps of an algorithm to a wide audience.
2. What are the 4 main algorithms?
Here are four main types of algorithms:
- Sorting Algorithms
- Searching Algorithms
- Graph Algorithms
- Machine Learning Algorithms
3. What are the 4 logical functions in Excel?
In Microsoft Excel, there are four main logical functions that we often use to analyze logical conditions and return true or false values. These functions help you do conditional calculations and make choices based on certain factors. The four logical functions in Excel are:
Key Takeaways from the Article
- In this article, we have provided a brief and thorough overview of create an algorithm in Microsoft Excel.
- First, we have discussed what an algorithm means in Excel.
- Then we have explained create 5 different types of algorithms in Excel.
- Showed a step-by-step procedure of all methods.
- Also discussed make a flowchart in Excel.
- Provide solutions to frequently asked questions by readers.
Download Practice Workbook
You can download the practice workbook from here.
Create Algorithm in Excel: Knowledge Hub
- Perform Machine Learning in Excel
- Use Artificial Intelligence in Excel
- Make Decision Tree Algorithm in Excel
- Build Lottery Prediction Algorithm in Excel
- Create a Betting Algorithm in Excel
- Create Rainflow Counting Algorithm in Excel
- Use Fuzzy LOOKUP Algorithm in Excel
- Data Mining In Excel
<< Go Back to Learn Excel
Get FREE Advanced Excel Exercises with Solutions!
