Step 1 – Prepare Training Data
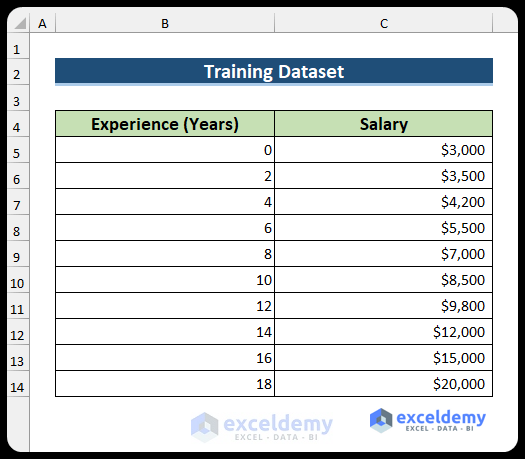
For illustration, we have a sample preprocessed dataset.
You need to preprocess your data by discarding missing data, encoding categorical data, etc.
Step 2 – Select Model
- Enable the Analysis Toolpak.
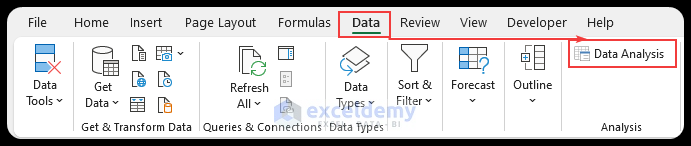
- Go to the Data tab and select Data Analysis.
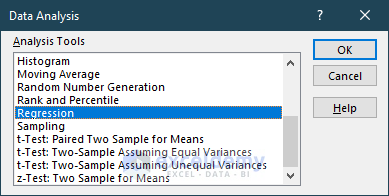
- The Data Analysis dialog box will appear. Select Regression and click OK.
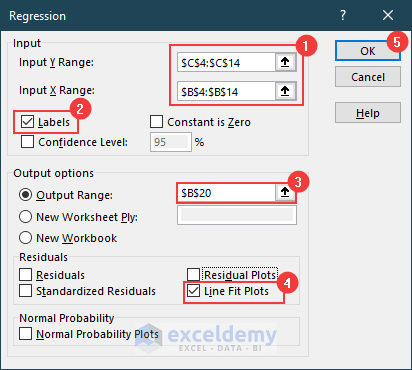
- In the Regression window, insert the Y and X. Enter the salary range (B4:B14) and experience range (C4:C14) in the Input Y Range and Input X Range sections respectively.
- Check Line Fit Plots and Labels.
- Select B20 as the Output Range.
- Click OK.
- The regression analysis outcome and some regression parameter values will be displayed as shown:
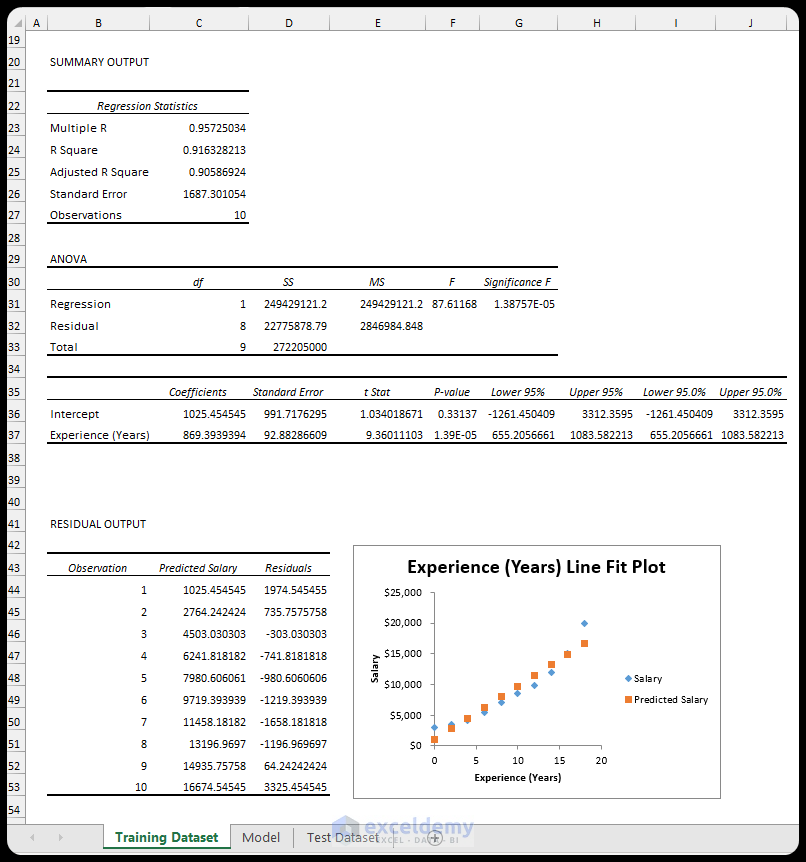
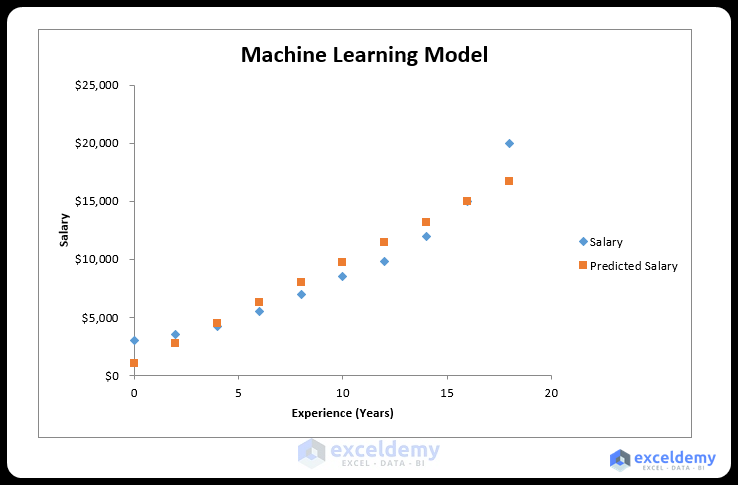
- It plots both the Series Data (approximate salaries) and Predicted Data (salaries for modeling) in the graph.
- Name your graph. We named this chart Machine Learning Model.
Step 3: Predict Data
Create a machine-learning model chart and a modeled salary structure for the employees. The chart analyzes the given data and, in turn, provides a predicted trendline equation which can be used to generate a modeled salary structure.
- Right-click on any of the points on this chart and select Add Trendline.

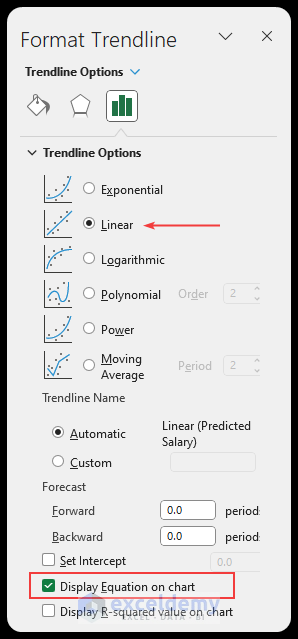
- The Format Trendline window will appear.
- Select Linear and check Display Equation on the Chart.
- The Machine Learning Model will appear as shown below.
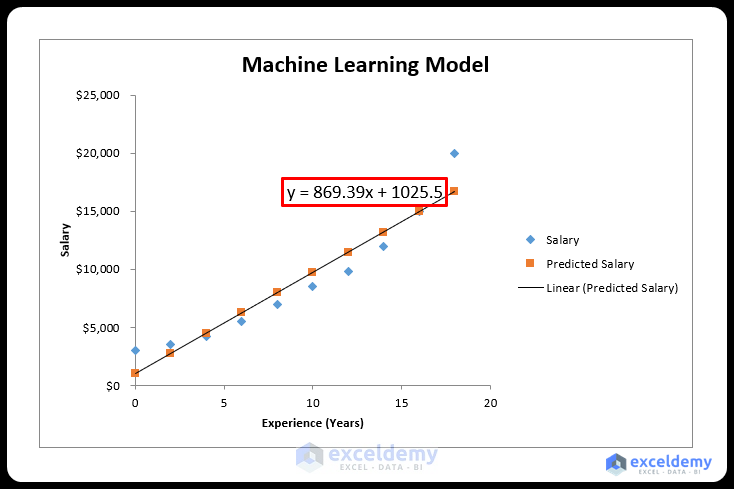
- To develop a formula using this equation to model the salaries, create a new column to store the Modeled Salaries.
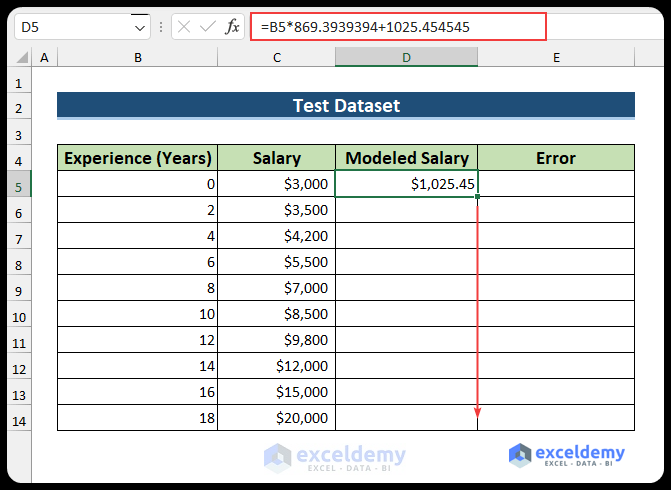
- Enter the following formula in cell D5, and press ENTER. This will provide the salary for an employee with 0 years of experience.
=B5*869.3939394+1025.454545
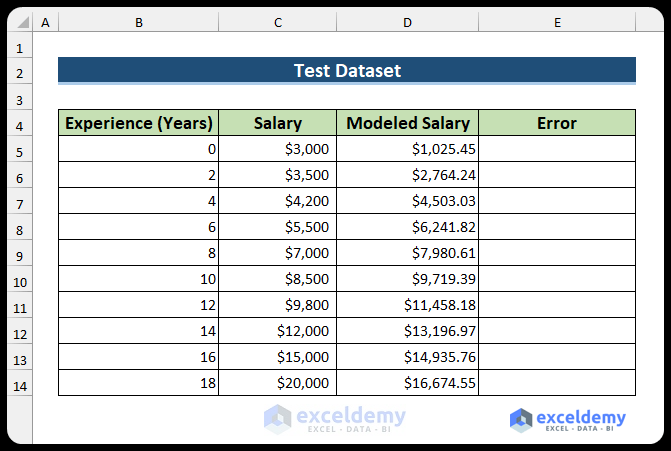
- Use the Fill Handle to apply the formula to the entire column.
Read More: How to Create Betting Algorithm in Excel
Step 4 – Evaluate the Model’s Performance
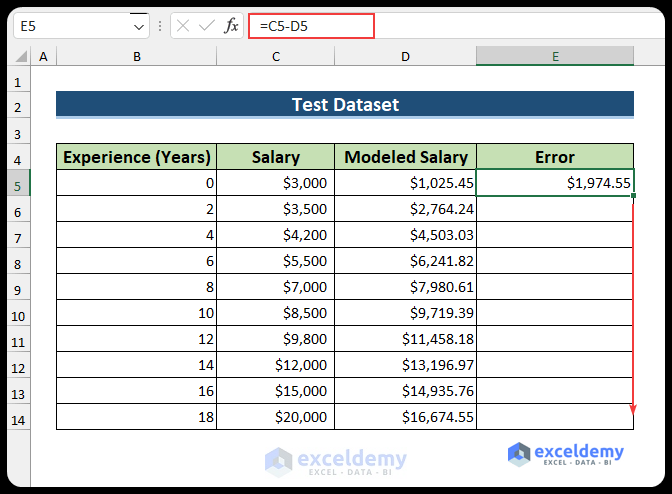
Find the difference between the actual values and the predicted values. The difference values can be used to evaluate the accuracy of the model. If more values are known, the model can be updated.
- Enter the following formula in cell E5 to compare with the real data and press Enter.
=C5-D5
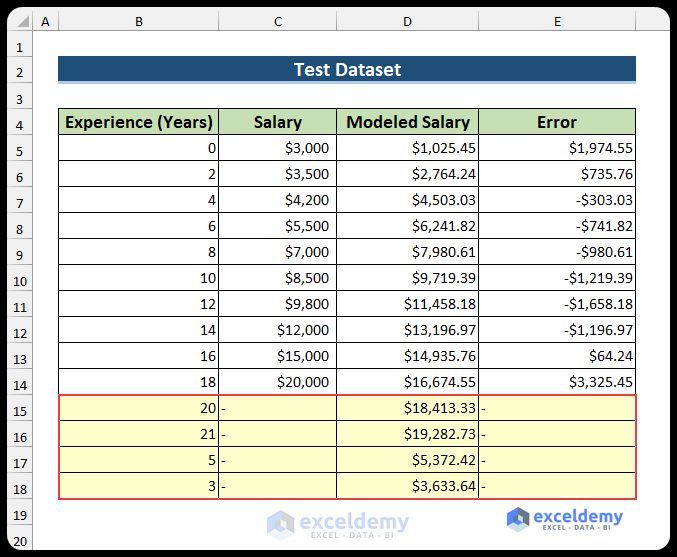
- Use the Fill Handle to fill the rest of the cells.
- The predicted salaries for four more unknown values have been found.
- If the actual values are known, you can rerun the regression analysis using these values to get a better model.
Download Practice Workbook
Related Articles
- How to Use Fuzzy LOOKUP Algorithm in Excel
- How to Use Artificial Intelligence in Excel
- How to Make Decision Tree Algorithm in Excel
- How to Create Rainflow Counting Algorithm in Excel
<< Go Back to Algorithm in Excel | Learn Excel
Get FREE Advanced Excel Exercises with Solutions!

Muchas Gracias!
Hello Eduardo,
De nada! You are most welcome. Keep learning Excel with ExcelDemy!
Regards
ExcelDemy
There are a couple of simple changes that could help automate this approach. Since you’re focussing on linear regression (and there’s a whole science in choosing the right regression model, which I’ll defer for now), you can use the LINEST function to return the coeffiecients dynamically. If the data source for LINEST is an Excel Table, then the coefficients will update automatically as new data are appended to the table. Using the coefficients supplied by LINEST allows construction of your regression prediction equation.
Another approach is to use FORECAST.LINEAR. This does not show you the equation but does allow calculation of linear predictions directly, based on a cloud of points. So, use with caution.
Worth noting that in either of these approaches one must be sure that linear regression is appropriate and this, of course, comes with the usual caveats of extrapolating outside the boundaries of one’s data.
Hello Damien Mazzone,
Thank you for sharing these valuable insights! You’re absolutely right, using LINEST with an Excel Table is a great way to make the regression coefficients update automatically when new data is added. It really streamlines the workflow and keeps the model dynamic.
FORECAST.LINEAR is indeed another handy option for quickly generating predictions without manually building the regression equation, though, as you mentioned, it’s important to confirm that a linear model is appropriate before applying it, and to be cautious with extrapolation beyond the data range.
Your suggestions add a nice layer of automation to the process, thanks again for contributing!
This is Simple Linear regression, not Machine Learning.
Hello Dear,
You’re right that the example is simple linear regression—but linear regression is also one of the most common machine learning (supervised learning) methods. In the article, it’s used as a beginner-friendly ML starting point.
If you’d like, we can add a quick note and show a more “classic ML” Excel example too (e.g., classification with logistic regression or a basic decision-tree-style model).
Regards,
ExcelDemy
See https://github.com/ngpepin/ExcelML
ExcelML is an experimental platform that brings real machine learning and deep learning workflows directly into Microsoft Excel — without Python, Jupyter, or external services. We are developing an Excel-based environment to familiarize our clients and business partners with basic ML concepts in the most approachable way we can think of. For the moment we’re limiting ourselves to core ML concepts, but we plan to eventually extend it to LLM’s as well.
Hello Nicolas G Pepin,
Thanks for sharing this project. It’s interesting to see an Excel-native approach to introducing ML concepts without external tools. This could be useful for users who want to explore ML ideas directly inside Excel.
Regards,
ExcelDemy