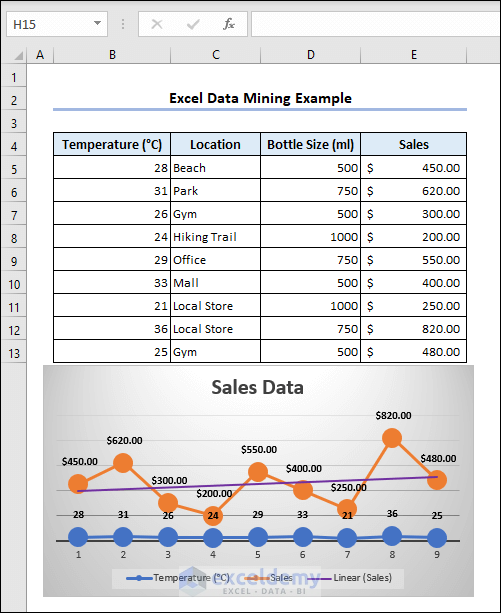
Here’s a simplified overview of data mining in a smaller dataset.
Download the Practice Workbook
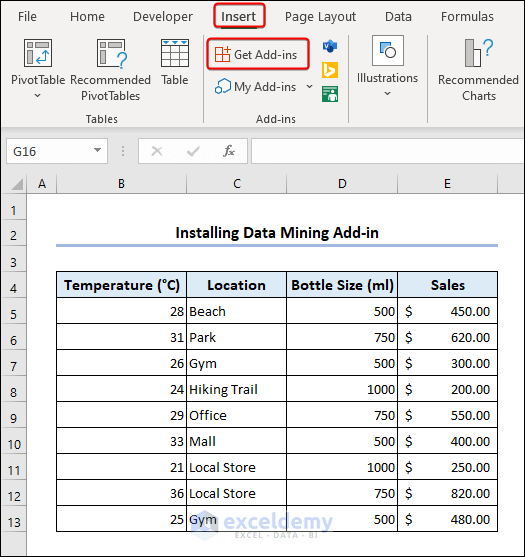
How to Install the Data Mining Add-in in Excel
- Click on Insert and select Get Add-ins.
- In the Search bar of the Office Add-ins window, write Data Mining.
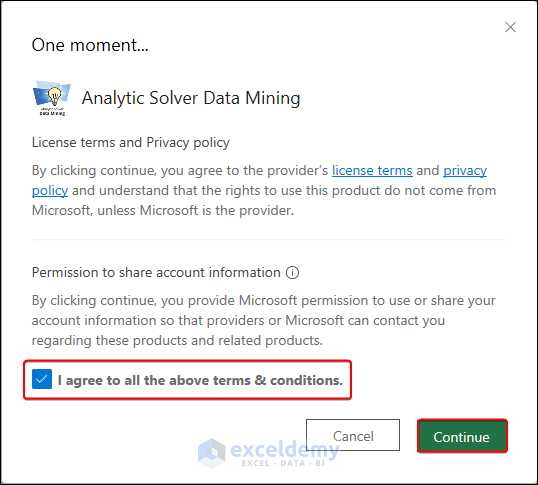
- Select Analytic Solver Data Mining, or another add-in for mining, and click Add.

- Check the I agree to all the above terms & conditions box and go to Continue.
- The Data Mining tab appears in your ribbon.

How to Prepare Data Before Data Mining in Excel
Step 1 – Use Excel Tools for Data Cleaning
Tool 1 – Remove Duplicates
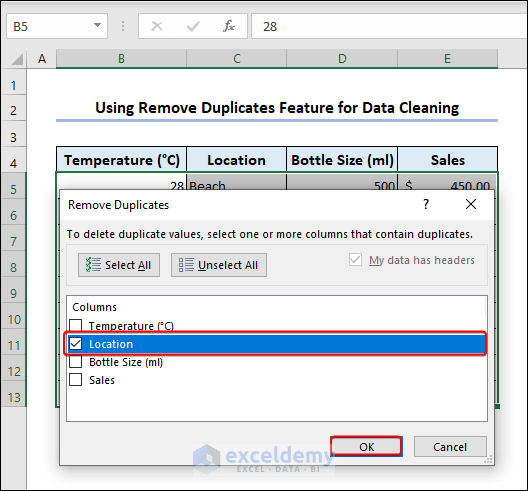
- Select the range B5:E13 you want to clean.
- Go to the Data tab and select Remove Duplicates.
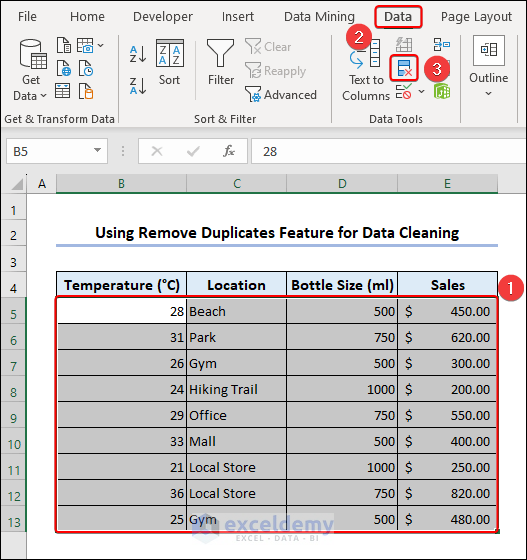
- In the Remove Duplicates dialog, check Location and select OK.
- Click OK in the Excel notification box.
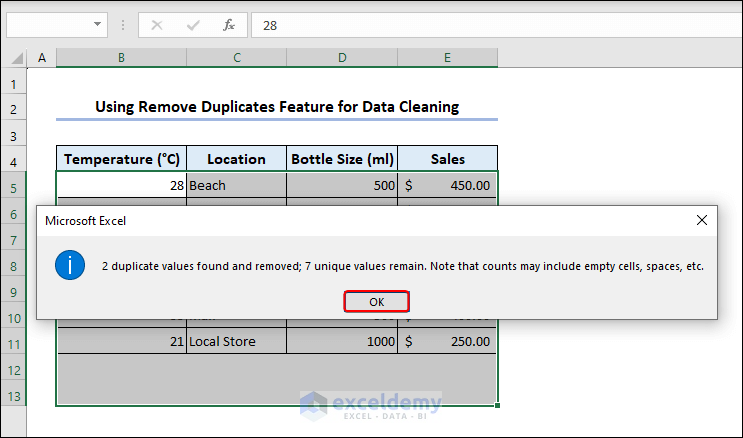
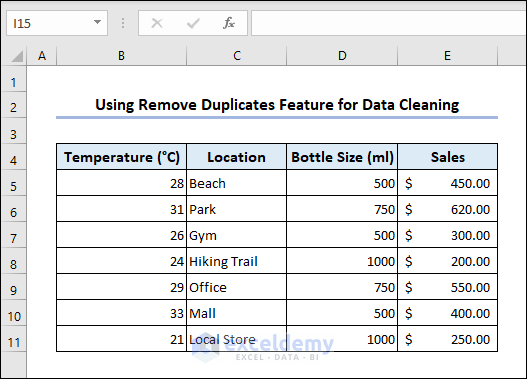
- The duplicates in the Location column disappear.
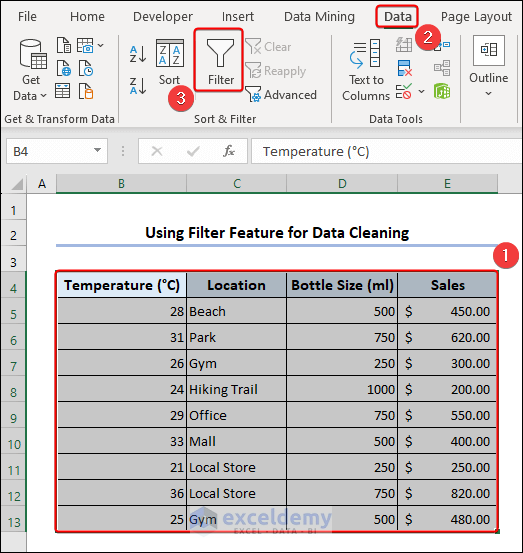
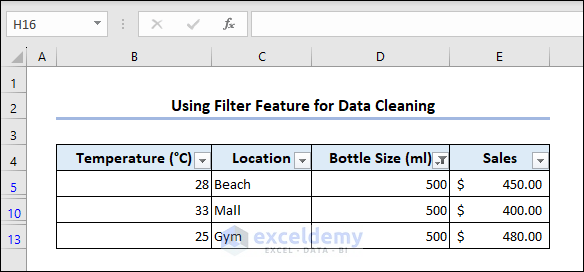
Tool 2 – Filter
- Select the range B4:E13, click on Data, and choose Filter.
- Click the Filter dropdown icon for the Bottle Size (ml) column.
- Check 500 and click OK.

- The filter displays only rows that contain the value 500 in the Bottle Size(ml) column.
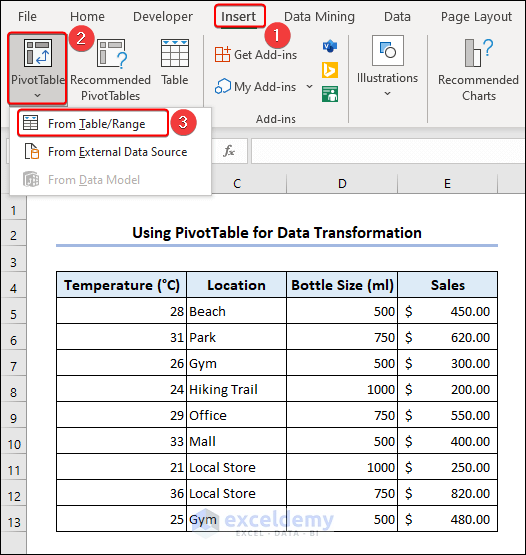
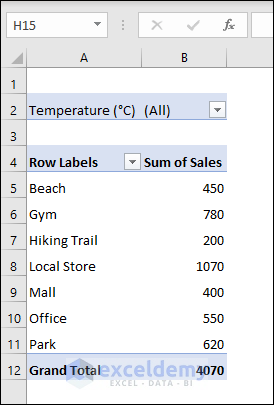
Step 2 – Transform Data Using a PivotTable in Excel
- Go to the Insert tab and click on PivotTable, then select From Table/Range.
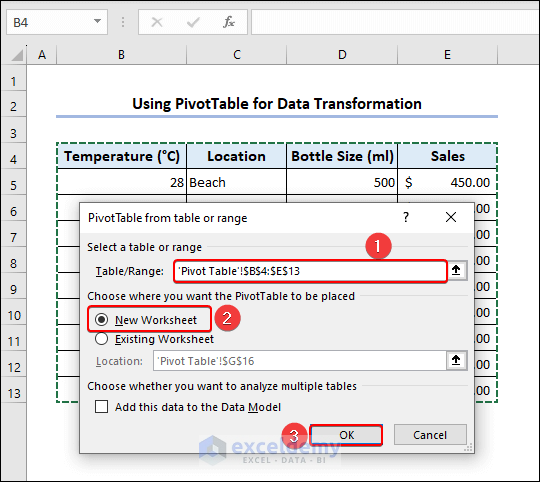
- In the PivotTable from table or range dialog box, input B4:E13 as Table/Range.
- Check New Worksheet and click OK.
- In the PivotTable Fields pane, drag Temperature (°C) to the Filters field, Location to Rows field, and Sales to Values field.
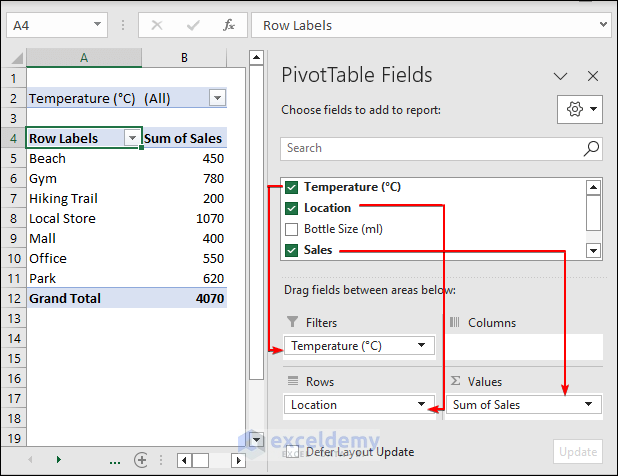
- The Pivot Table pops up.
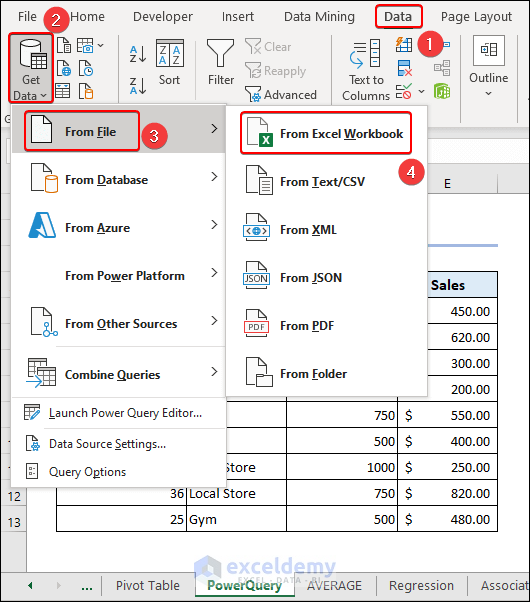
Step 3 – Insert Excel Power Query for Data Integration
- Go to Data and select Get Data, then From File, and choose From Excel Workbook.
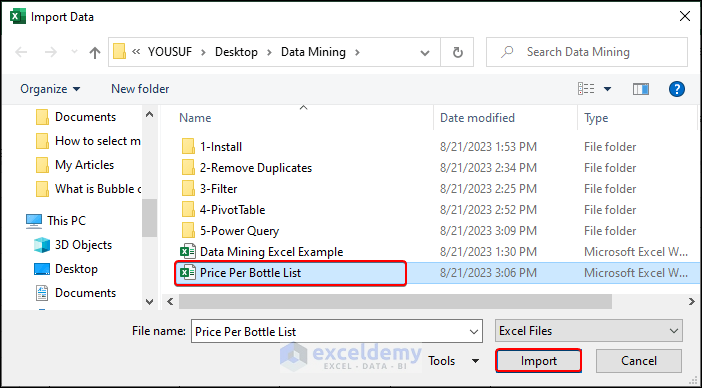
- In the Import Data window, select the source file and hit Import.
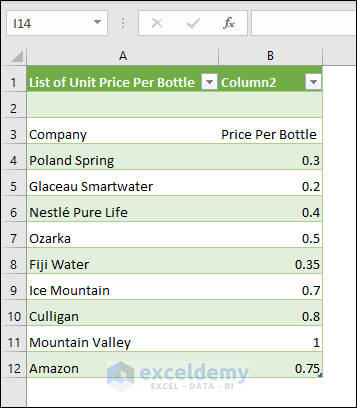
- Go to List and select Load on the Navigator window.

- We get the List query.
- You can combine, merge, or connect this with the main query table.
Step 4 – Use the Excel AVERAGE Function for Data Reduction
- In cell D15, use the following formula and press Enter.
=AVERAGE(B5:B13)- Enter the following AVERAGE formula in D16,
=AVERAGE(E5:E13)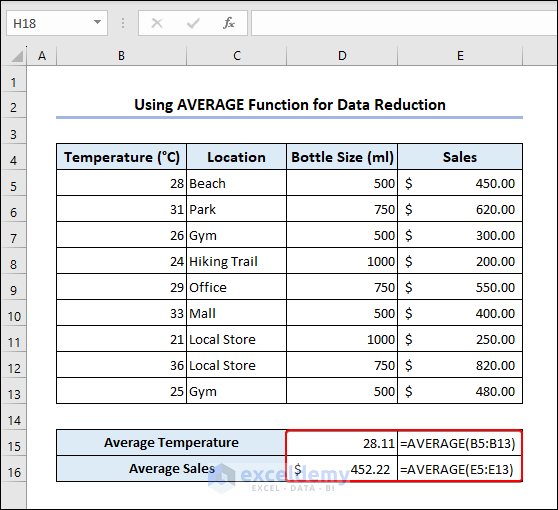
- The formulas return averages of temperature and sales, respectively.
Examples of Data Mining in Excel
Example 1 – Regression Analysis
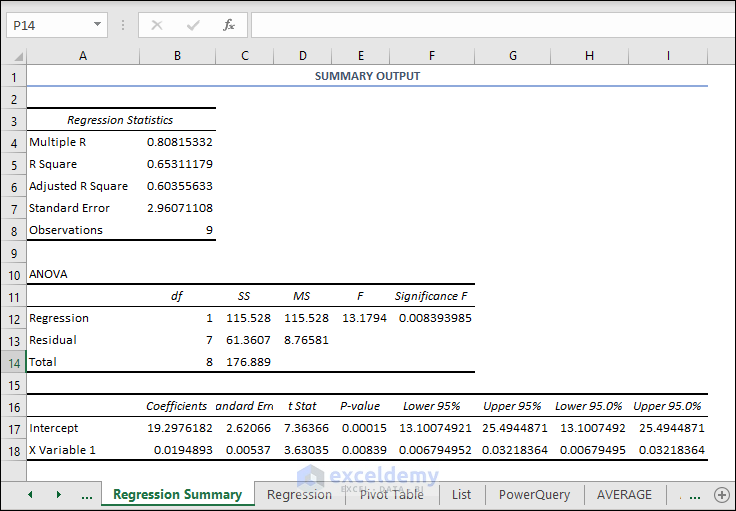
We will apply a Regression Analysis to predict sales of cold water bottles based on the weather forecast.
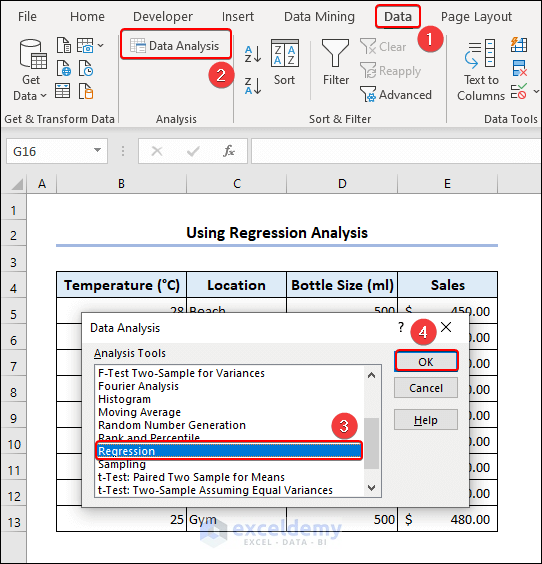
- Go to the Data tab and select Data Analysis.
- Select Regression in the Data Analysis dialog box and hit OK.
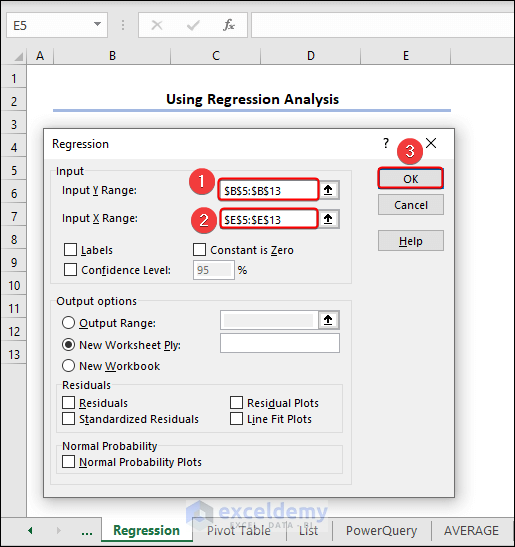
- Input B5:B13 in the Input Y Range box and E5:E13 in Input X Range, then hit OK.
- Here’s the summary output.
Example 2 – Data Visualization with One Independent Variable
Let’s consider the Sales column as the independent variable.
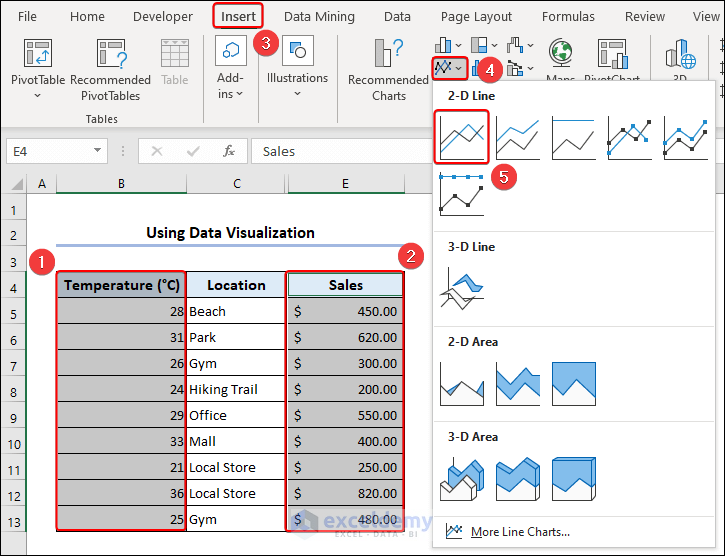
- Select the ranges B4:B13 and E4:E13.
- Go to the Insert tab, choose Insert Line or Area chart, and select Line chart.
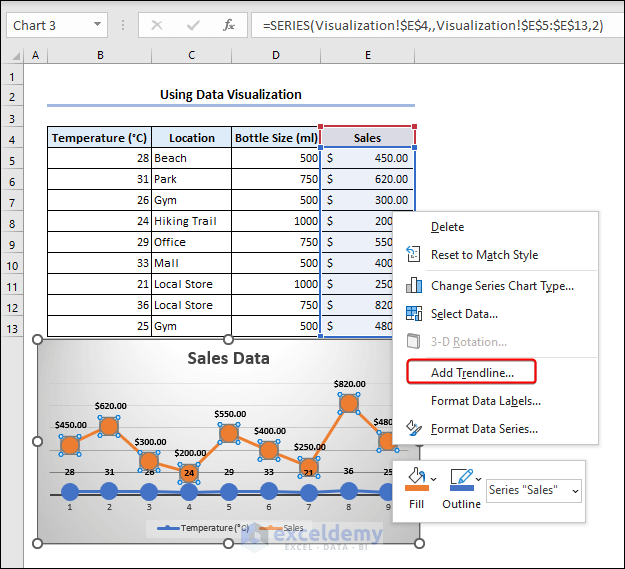
- Right-click on a Node and click Add Trendline from the Context Menu.
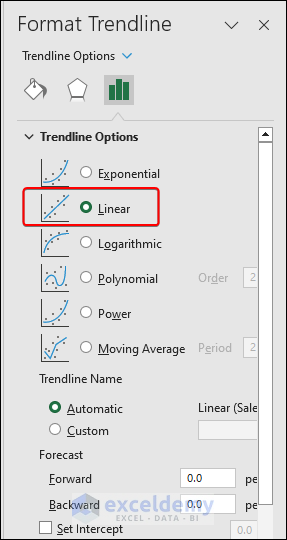
- In the Format Trendline pane, select Linear for Trendline Options.
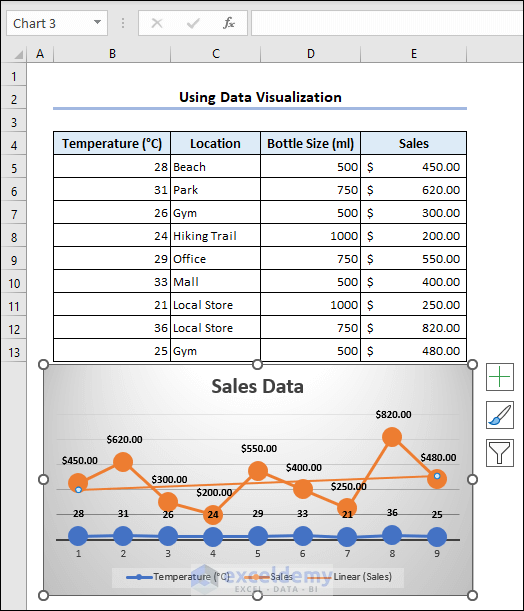
- The trendline appears suggesting the sales trend.
Example 3 – Use the LINEST Function
We will predict our future sales with the change in temperatures using this function.
- Use the LINEST formula in E5:
=LINEST(C5:C13,B5:B13,TRUE,TRUE)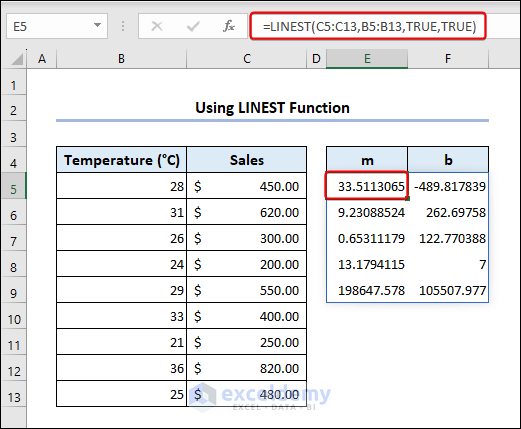
- The output of m and b columns indicate the changing temperature and predicted sales respectively.
Advantages and Disadvantages of Data Mining in Excel
Advantages of Data Mining:
- User-friendly interface: People can explore ways to do data mining, even without much programming knowledge.
- Versatile: People can do various data mining methods like grouping, prediction, and finding connections. They can also make their calculations and rules.
Disadvantages of Data Mining:
- Lack of Scalability: Excel has limits in handling big data. For big organizations needing to grow, it might not be the best choice.
- Slow Processing: Excel provides slower analysis and less exact outcomes for large data.
Frequently Asked Question
Can we customize our data analysis result in Excel?
You can customize analysis results through Excel formulas or rules.
What is the function of Outliers in Excel data mining?
The Outliers command provides a proper way to clean the information.
What is the data mining cycle?
Business Understanding ⇆ Data Understanding ⇆ Data Preparation ⇆ Modeling → Evaluation → Deployment → Business Understanding.
<< Go Back to Algorithm in Excel | Learn Excel
Get FREE Advanced Excel Exercises with Solutions!
