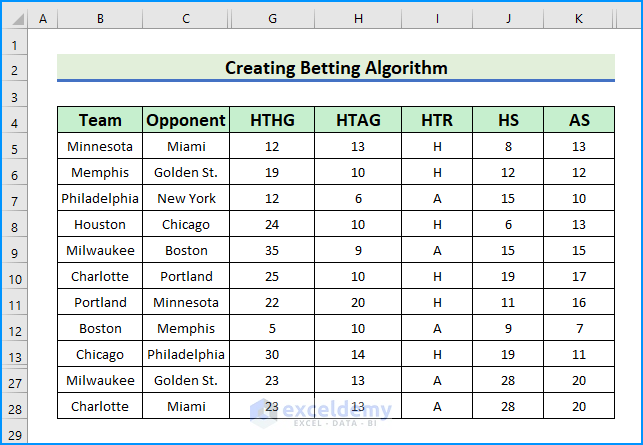
Method 1 – Create Dataset with Proper Parameters
- HTHG: Half-Time Home Goals. Further, add the total home goals as values in the dataset.
- HTAG: Half-Time Away Goals. Again, we add the team’s away goal records. Similarly, specify the following headers.
- HTR: Half-Time Result.
- HS: Home Score.
- AS: Away Score.
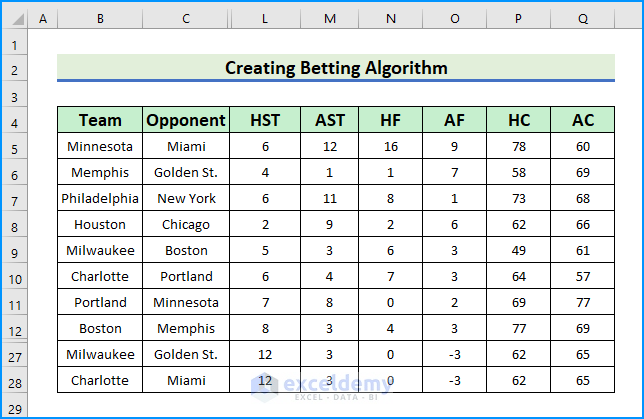
- Add the following sub-headers as well.
- HST (Home Team Shots), AST (Away Team Shots), HC (Home Corners), AC (Away Corners), HY (Home Yellow Cards).
- Finally, add their values to the dataset.
Method 2 – Embed COUNTIFS and SUM Functions
This step’s objective is to create the desired algorithm. We calculated the data using the COUNTIFS and SUM functions. The COUNTIFS function returns an integer from a variable with multiple conditions. The SUM function returns the sum of a range or array.
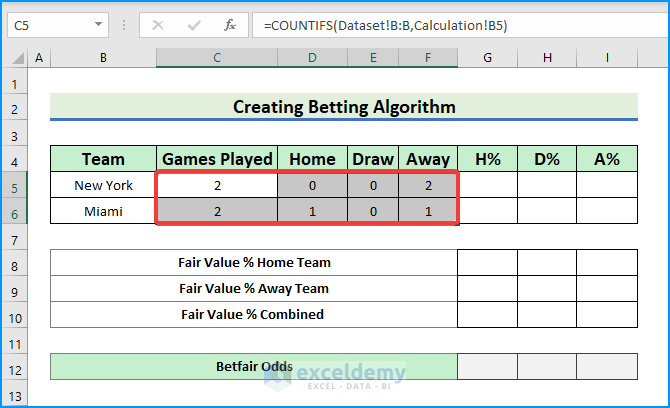
- In C5, type the following COUNTIFS formula.
=COUNTIFS(Dataset!B:B,Calculation!B5)
- Press the Enter key.
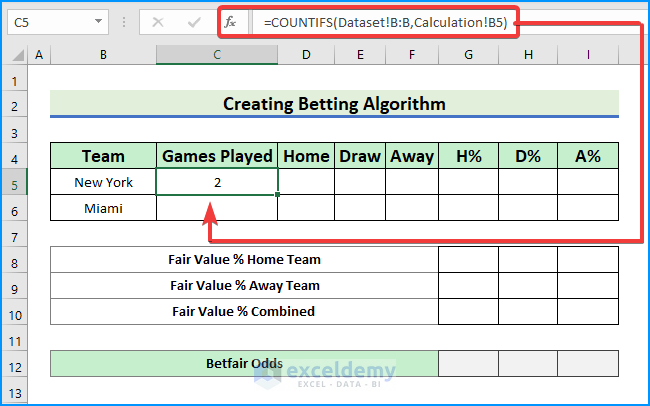
- The function counts the total games of New York played from the B range of the Dataset sheet and puts it into cell B5 in the Calculation sheet.
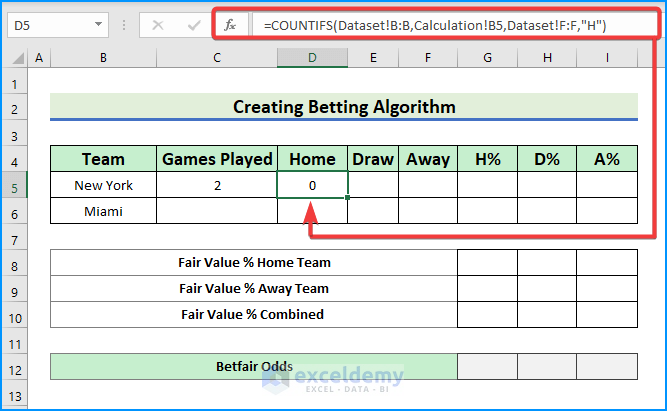
- In cell D5, write the formula below.
=COUNTIFS(Dataset!B:B,Calculation!B5,Dataset!F:F,"H")
- Press the Enter key.
- The function will count the total number of home wins for New York.
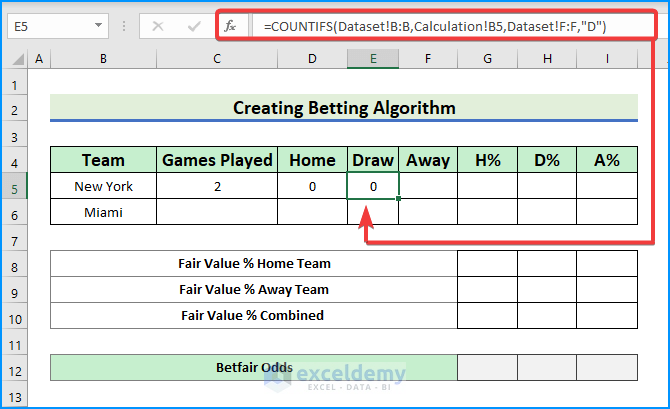
- Let’s count the total draws of New York To do so, type the given formula in cell E5,
=COUNTIFS(Dataset!B:B,Calculation!B5,Dataset!F:F,"D")
- Hit Enter.
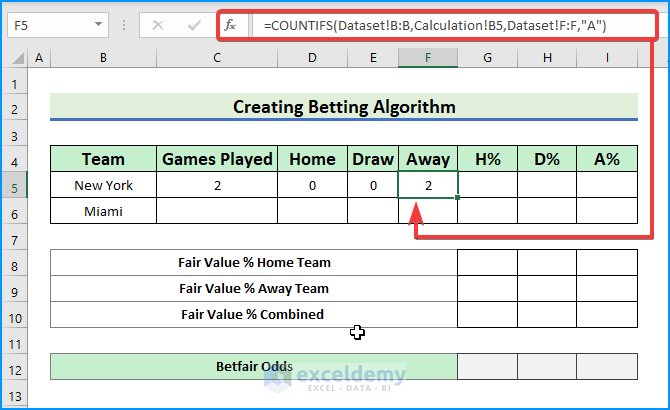
- Count the total away wins; the formula is:
=COUNTIFS(Dataset!B:B,Calculation!B5,Dataset!F:F,"A")
- Press Enter.
- To count the results for the Miami team, drag the range C5:F5 down or use the AutoFill tool.
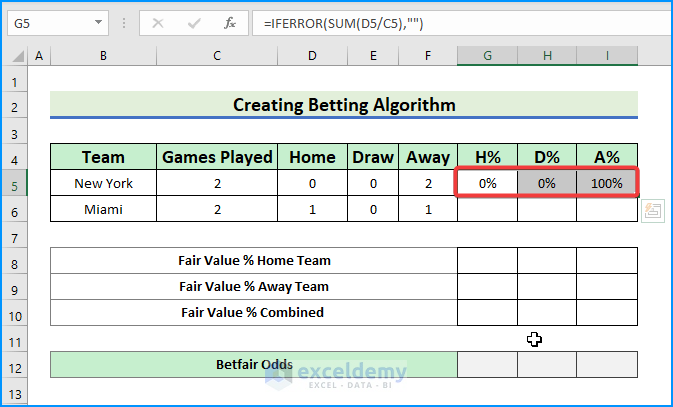
- Calculate the home win percentage for New York using the following formula.
=IFERROR(SUM(D5/C5),"")
- For the draw percentage,
=IFERROR(SUM(E5/C5),"")
- Determine the away win percentage,
=IFERROR(SUM(F5/C5),””)
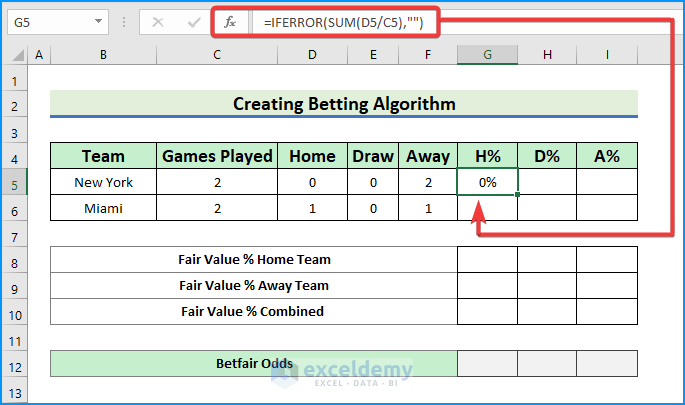
- We obtained the desired percentages for the New York team.
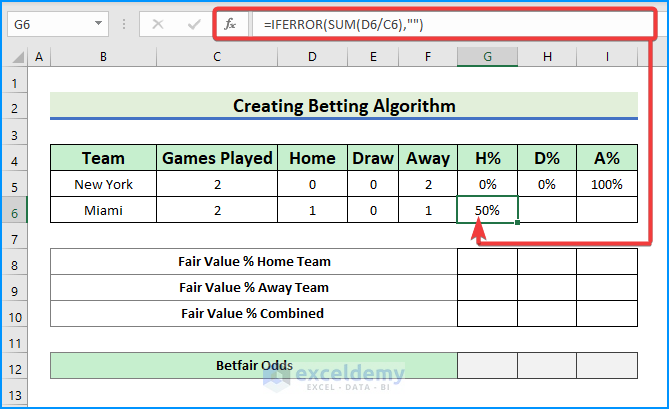
- Calculate the home win percentage of the Miami team, see the formula in G6,
=IFERROR(SUM(D6/C6),"")
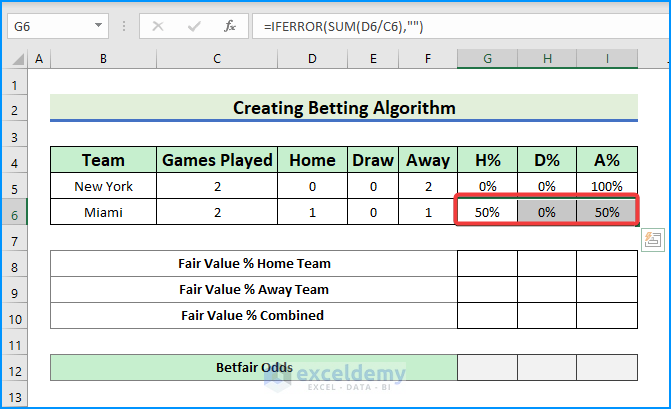
- For the draw percentage,
=IFERROR(SUM(E6/C6),"")
- For Miami’s away win calculation,
=IFERROR(SUM(F6/C6),"")
- Tap the Enter key again.
- The percentages for Miami pop up.
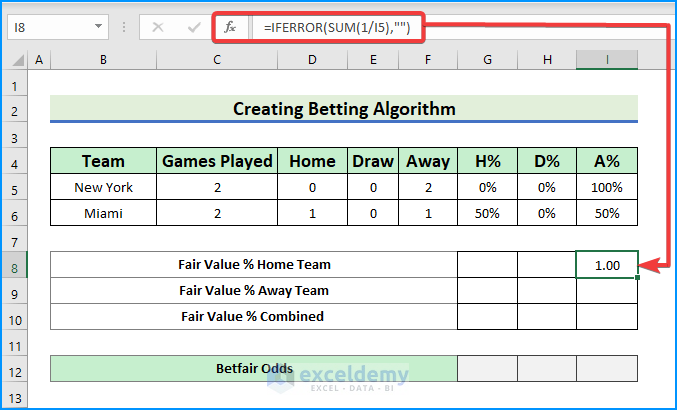
- Calculate the fair value percentages for home, away, and combined of both teams.
- In cell I8, write the SUM formula.
=IFERROR(SUM(1/I5),"")
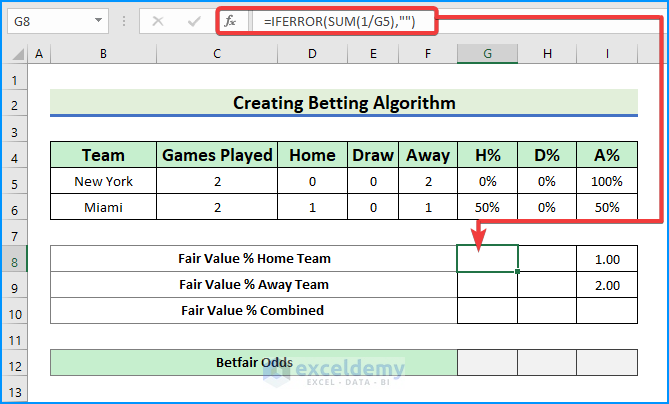
- In G8, use the SUM function.
=IFERROR(SUM(1/G5),"")
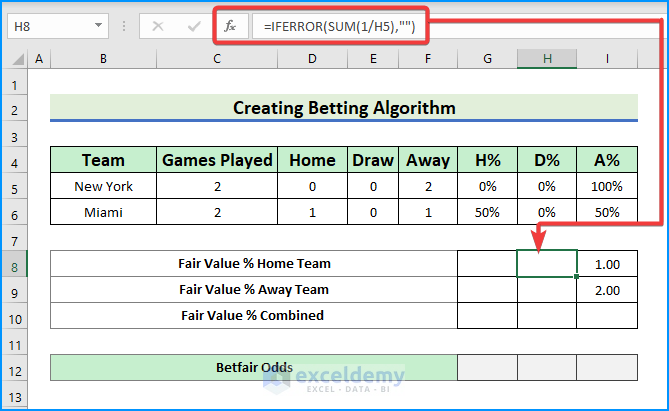
- In H8, type:
=IFERROR(SUM(1/H5),"")
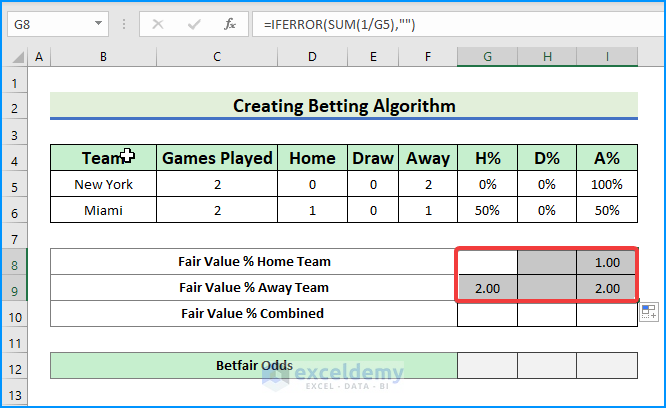
- Select the range G8:I9 and drag it down to 1 row to get the away team fair value.
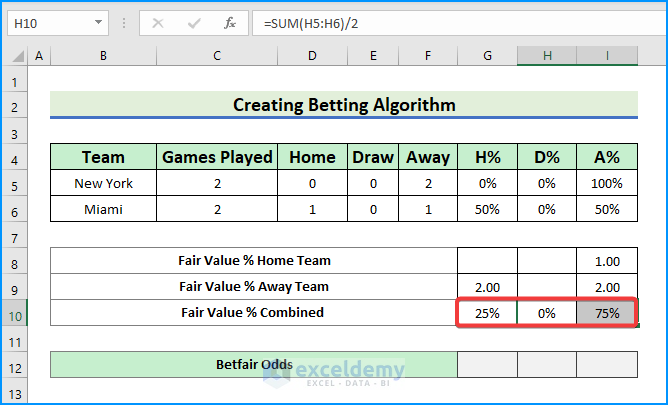
- We calculate the combined fair value in percentages. To do so, type:
=SUM(G5:G6)/2
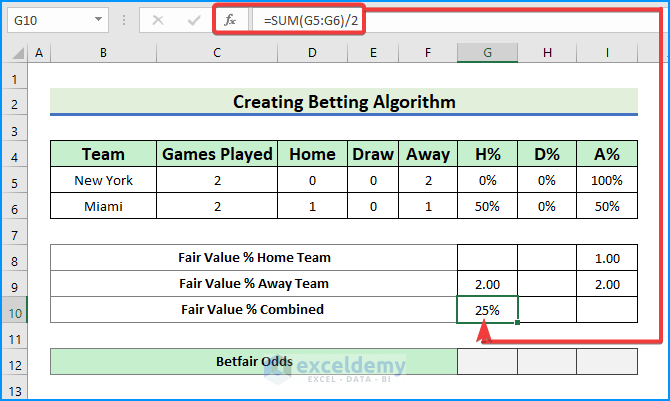
- Drag the cell to the right to obtain the other cell values.
Method 3 – Test and Monitor Betting Model
- In G12, use the divide formula with IFERROR,
=IFERROR(1/G10,"")
- Tap the Enter key.
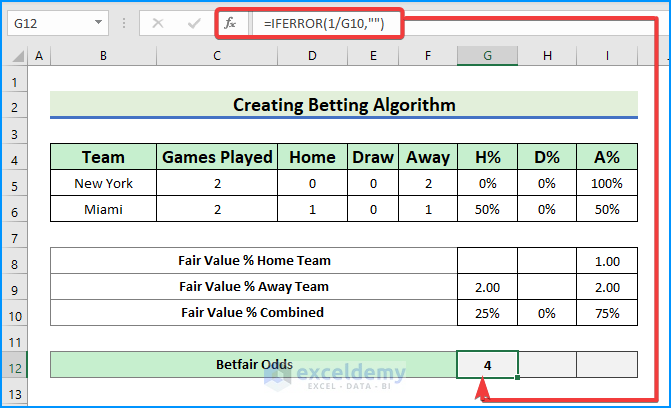
- Drag the cells and use the AutoFill handle to get all the Betfair odds.
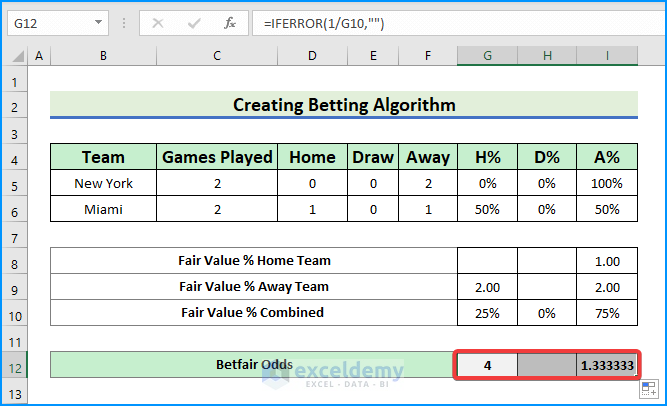
- Get the result.
- We get 4 points for the home team and 1.333333 for the away team.
- The possibility of winning the home team is much higher.
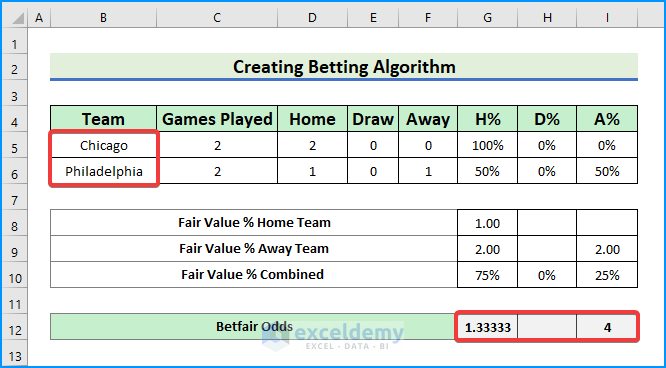
- Put other teams as input and see their odds of winning against each other.
Download Practice Workbook
Download this practice workbook to exercise while you are reading this article. It contains all the datasets in different spreadsheets for a clear understanding. Try it yourself while you go through the step-by-step process.
Related Articles
- How to Build Lottery Prediction Algorithm in Excel
- How to Perform Machine Learning in Excel
- How to Use Artificial Intelligence in Excel
- How to Make Decision Tree Algorithm in Excel
- How to Create Rainflow Counting Algorithm in Excel
<< Go Back to Algorithm in Excel | Learn Excel
Get FREE Advanced Excel Exercises with Solutions!
