Sometimes, we need to apply regression statistics in our dataset to know which factors impact the dataset. We can also find the relation between two variables using regression statistics. Today, we will demonstrate 3 easy methods to get regression statistics in Excel. So, without further ado, let’s start the discussion.
What Is Regression Statistics?
Regression statistics is a method that defines relationships between two or more variables. There are two types of variables in regression statistics.
Dependent Variable: It is the main variable you need to predict with regression analysis.
Independent Variable: It influences the dependent variable. There can be one or more independent variables.
There are many types of regression models. But today we will use the linear regression model to explain the process. You can also find other types of regression models after reading the whole article.
The linear regression equation is given below:
y = bx + a + eHere:
- y is the dependent variable.
- x is the independent variable.
- b is the slope of a regression model and it indicates the rate of change for y as x changes.
- a is the Y-intercept. It is the point where the line crosses the Y-axis.
- e indicates the amount of error.
In Excel, we use the regression without the error. This is called the least-squares regression. So, the equation becomes:
y = bx + aIn the following section, we will demonstrate how we can get the regression statistics easily in Excel.
How to Get Regression Statistics in Excel: 3 Easy Ways
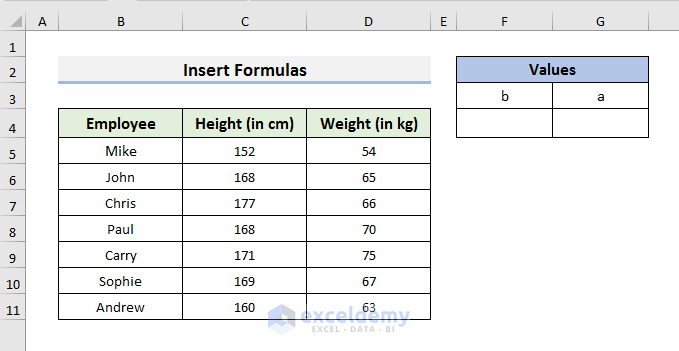
To explain the methods, we will use a dataset that contains information about the height (in cm) and weight (in kg) of some employees. Here, we will use the dataset and create a relationship between height and weight. We want to know how the weight changes if the height changes. So, in this case, weight is the dependent variable and height is the independent variable. Throughout the article, we will use the same dataset.

1. Enable Analysis ToolPak to Get Regression Statistics in Excel
In the first method, we will enable the Analysis ToolPak to get regression statistics in Excel. This process is very easy and efficient. To know more about the technique, pay attention to the steps below:
STEPS:
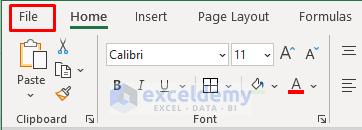
- First of all, click on the File tab.
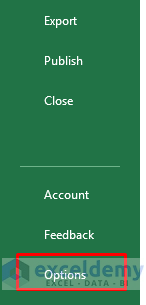
- Secondly, select Options. It will open the Excel Options window.
- In the Excel Options window, select Add-ins >> Excel Add-ins >> Go.
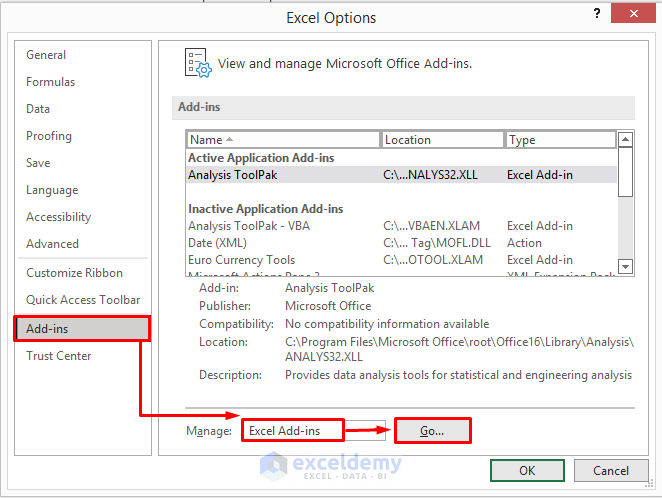
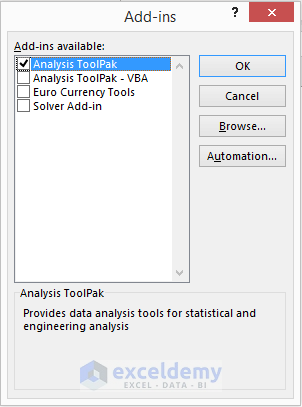
- After that, the Add-ins message box will pop up.
- Check Analysis ToolPak and click OK to proceed.
- In the following step, go to the Data tab and select Data Analysis.
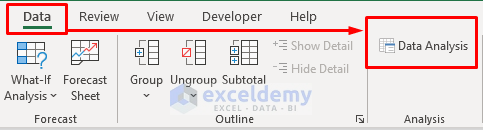
- Next, select Regression from the Data Analysis message box and click OK. It will open the Regression dialog box.
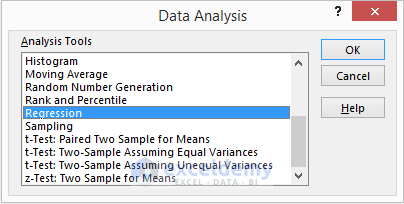
- In the Regression dialog box, select the Input Y Range and then, select Input X Range.
- Then, select Labels, New Worksheet Ply, and Residuals.

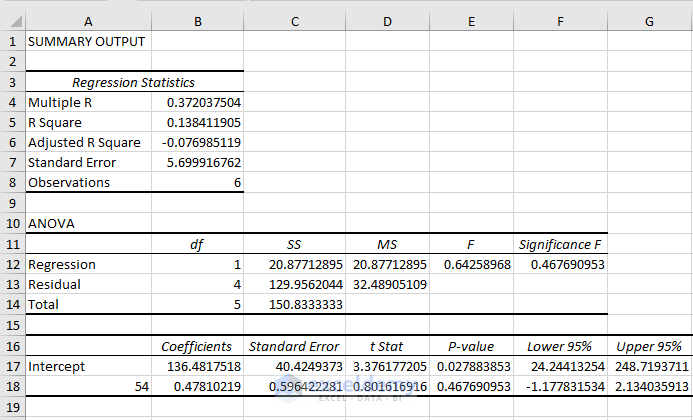
- In the end, click OK to get Regression Statistics in a new sheet like the picture below. Here, the first table indicates the Regression Statistics.
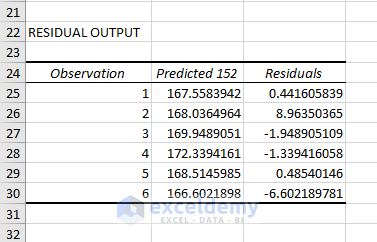
- You will also see the RESIDUAL OUTPUT in the same sheet.
Note: If you want to plot the dataset to show the graph of regression statistics, then please learn Method-3.
2. Insert Formulas to Get Regression Statistics in Excel
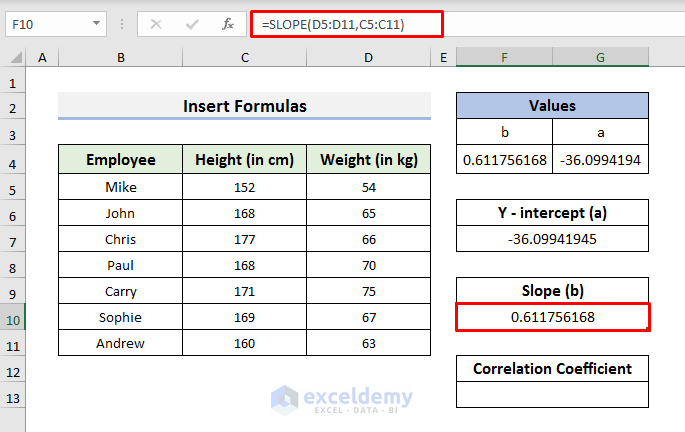
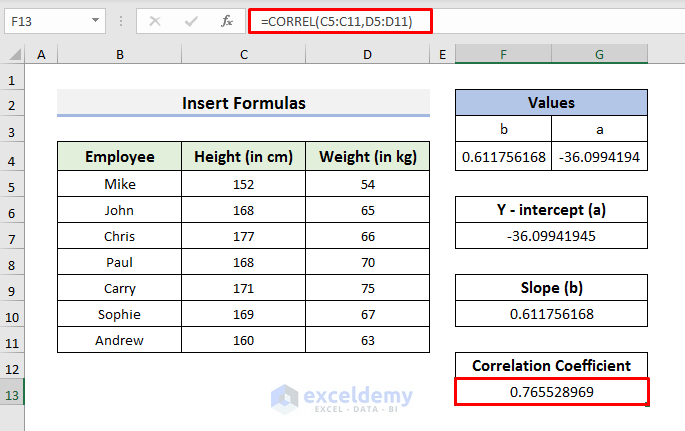
We can also use some formulas to get regression statistics. Here, you will see an array formula. Also, we will show how to compute it without an array formula. To get the results, we will use the LINEST, INTERCEPT, SLOPE, and CORREL functions. Here, we will use the same dataset but the structure will be slightly different. Here, a is the Y-intercept and b is the slope of the regression line.
Let’s follow the steps below to learn more.
STEPS:
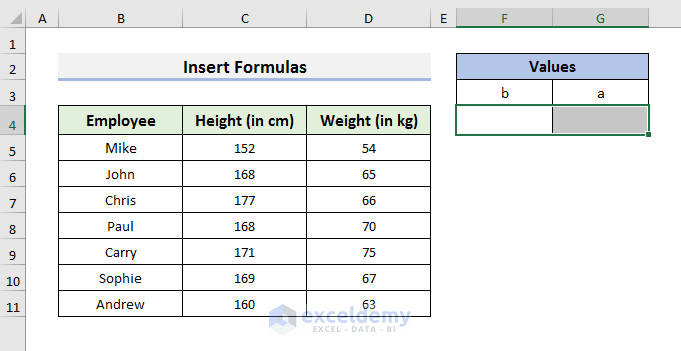
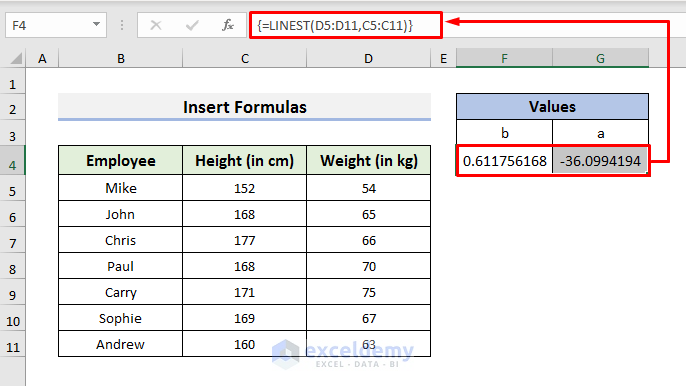
- In the first place, select Cell F4 & G4.
- Secondly, type the formula in the Formula Bar:
=LINEST(D5:D11,C5:C11)
- After that, press Ctrl + Shift + Enter to see the result.
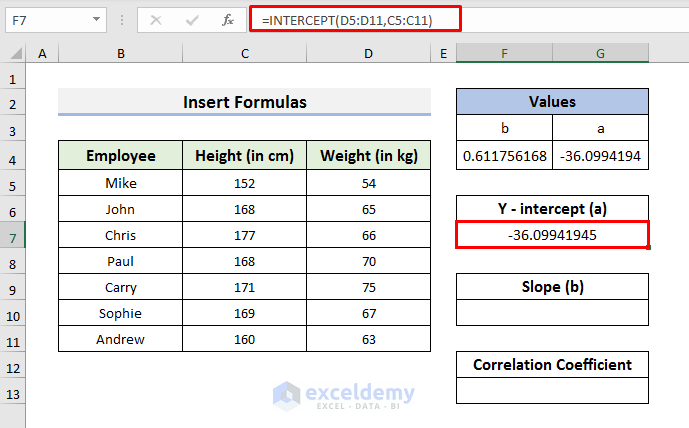
- Alternatively, you can avoid the array formula.
- To do so, select Cell F7 and type the formula:
=INTERCEPT(D5:D11,C5:C11)- Hit Enter to see the result.
- Now, to find the slope, type the formula in Cell F10:
=SLOPE(D5:D11,C5:C11)- And press Enter.
- Finally, to see the correlation coefficient, type the formula in Cell F13:
=CORREL(C5:C11,D5:D11)- And press Enter.
3. Get Regression Statistics with Scatter Plot in Excel
We can also get the regression statistics with a scatter plot in Excel. Here, we will plot the variables in a graph and see the trend of change or dependence. So, without any delay, let’s observe the steps below to know more.
STEPS:
- In the beginning, select the data with headers.

- In the second step, go to the Insert tab and select the Insert Scatter icon. A drop-down menu will occur.
- Select the first icon from the drop-down menu. It indicates the scatter plot.

- After that, you will see a graph on your worksheet.

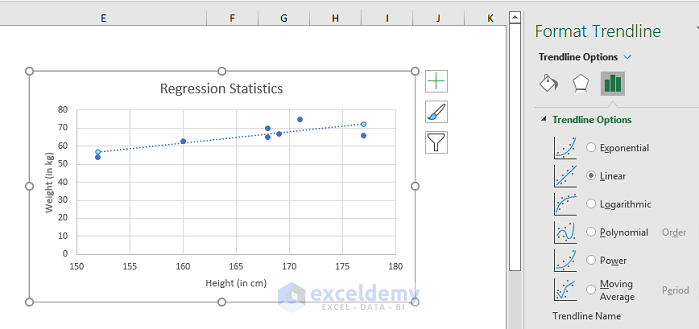
- Now, click on the plus (+) sign to add Axis Titles.

- Next, change the title and axis titles to make the graph more meaningful.

- In the following step, click on the plus (+) sign again and select Trendline.

- After selecting Trendline, you will see a line in the graph like the picture below.

- In the end, if you click on the Trendline, the Trendline Options will appear on the left side of the screen. You can choose different types of regression from here.
Read More: How to Plot Least Squares Regression Line in Excel
Things to Remember
There are certain things you need to remember when you are trying to get regression statistics in Excel.
- In Method-1 & Method-3, select the values of the X-axis and Y-axis.
- In Method-2, use Ctrl + Shift + Enter to use the array formula perfectly.
Download Practice Book
Download the practice book here.
Conclusion
In this article, we have demonstrated 3 easy methods to Get Regression Statistics in Excel. Here, we have used practical datasets to explain the process. I hope these methods will help you to perform your tasks easily. Furthermore, we have also added the practice book at the beginning of the article. To test your skills, you can download it to exercise. Last of all, if you have any suggestions or queries, feel free to ask in the comment section below.
Related Articles
- How to Interpret Multiple Regression Results in Excel
- How to Calculate P Value in Linear Regression in Excel
- How to Do Logistic Regression in Excel
- How to Interpret Linear Regression Results in Excel
- How to Do Multiple Regression Analysis in Excel
- How to Interpret Regression Results in Excel
- How to Do Simple Linear Regression in Excel
- Multiple Linear Regression on Excel Data Sets
<< Go Back to Regression Analysis in Excel | Excel for Statistics | Learn Excel
Get FREE Advanced Excel Exercises with Solutions!
