In a chart, a Trendline additionally referred to as a line of the first-class suit, is an immediate or curved line that depicts the overall sample or fashionable course of the information. This analytical method is maximum often used to illustrate information adjustments over the years or the connection among variables. A trendline resembles a line chart visually, however, it would not hyperlink the real information factors in the manner a line chart does. A first-class-suit line presents the general sample in all of the information at the same time as heading off statistical flaws and insignificant outliers. It can every now and then be used to expect trends. In this article, we will show you how to extend Trendline in Excel.
Step-by-Step Procedures to Extend Trendline in Excel
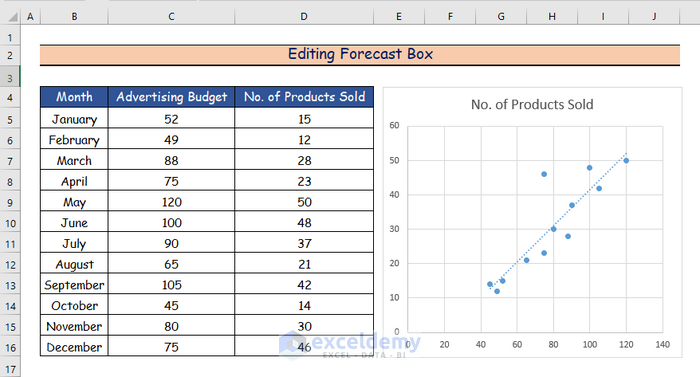
A useful technique for forecasting future data values is using a trend line. To extend a Trendline, we will edit Forecast Box in Excel creating Trendline first. Let’s say we have a sample data set to extend the trendline in Excel using step by step procedure. The following steps are given below.
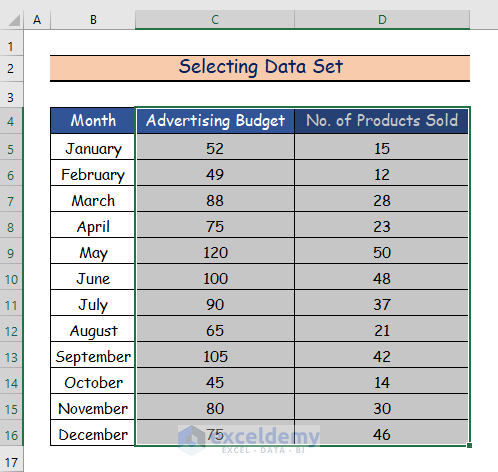
Step 1: Selecting Data Set
- Firstly, select the C and D columns from the given data set.
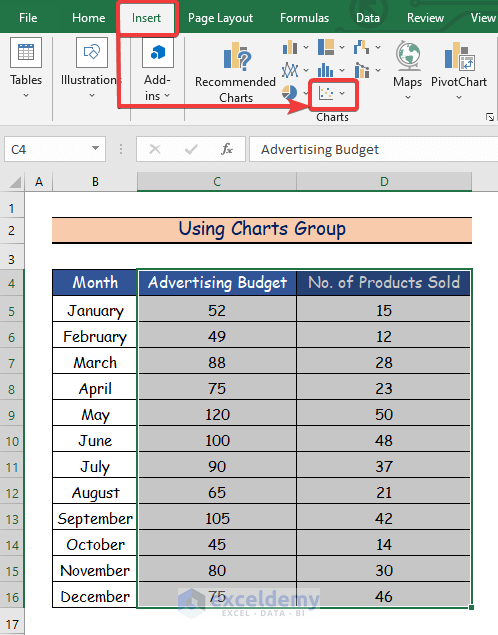
Step 2: Using Charts Group
- Now, select the Insert.
- Then, select the Insert Scatter Chart command from the Charts.
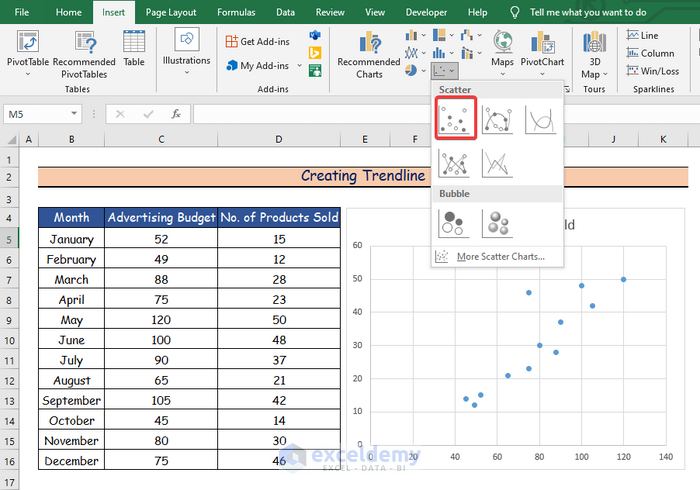
- Now, click on the Scatter Chart option to create a scatter chart first.
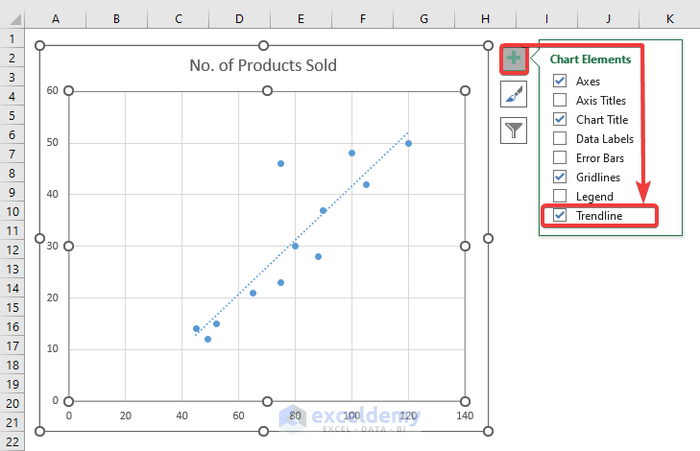
Step 3: Creating Trendline in Excel
- Now, select the Trendline option from the Chart Elements.
Read More: How to Add Trendline Equation in Excel
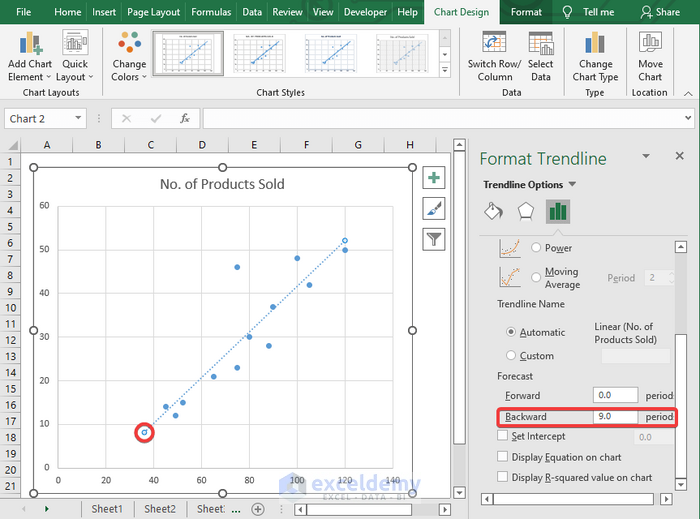
Step 4: Editing Forecast Box to Extend Trendline in Excel
- This is the initial trendline chart with the given data set.
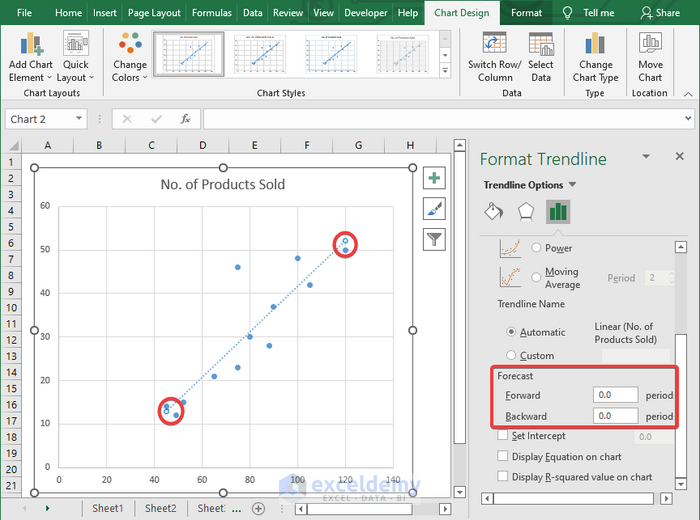
- Firstly, Double-click on the trendline to open the Format Trendline Panel.
- Besides, the two red circles represent the two initial values of the trendline chart.
- Finally, you will see that the Forward and Backward values are zero under the Forecast Box.
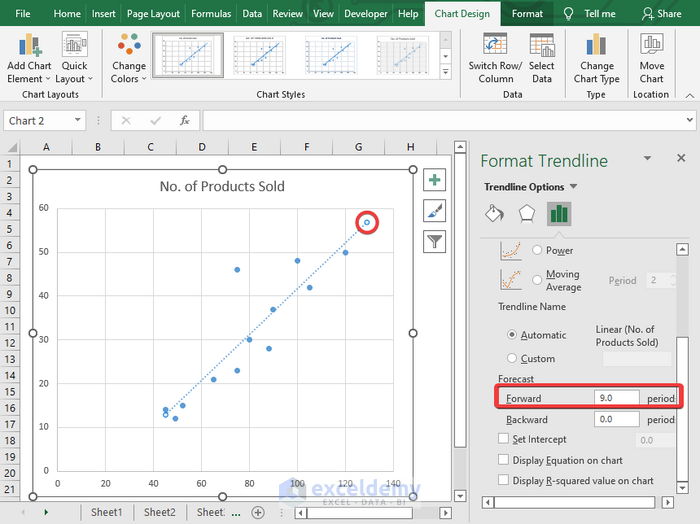
- Now, to extend the trendline, type your desired value in the Forward Box.
- Secondly, we will use 9 for extending the trendline, and you will see the following red circle showing the extending point.
- Now to decrease the trendline, type your desired value in the Backward Box.
- Then, we will use 9 to decrease the trendline, and you will see the following red circle showing the decreasing point.
Read More: How to Add a Trendline to a Stacked Bar Chart in Excel
Download Practice Workbook
You may download the following Excel workbook for better understanding and practice yourself.
Conclusion
In this article, I’ve covered the step-by-step process of how to extend Trendline in Excel. I sincerely hope you enjoyed and learned a lot from this article. If you have any questions, comments, or recommendations, kindly leave them in the comment section below.
Related Articles
- How to Visualize Trends in Excel
- How to Find Unknown Value on Excel Graph
- How to Exclude Data Points from Trendline in Excel
- How to Add Multiple Trendlines in Excel
- [Solved]: Trendline Option Not Showing in Excel
- How to Add Trendline in Excel Online
- How to Use Trendline Equation in Excel
- How to Insert Trendline in an Excel Cell
- How to Calculate Trend Analysis in Excel
<< Go Back To Trendline in Excel | Excel Charts | Learn Excel
Get FREE Advanced Excel Exercises with Solutions!
