Excel is a versatile tool that can be used to analyze data and create charts and graphs. One common use of Excel is to plot the best-fit line through ...
We will use a sample dataset that contains four columns along with the scatter plot. These columns represent some collected data of a company about ...
We have an independent variable in Column C marked as X and a dependent variable in Column B marked as Y. We will use this dataset to determine the ...
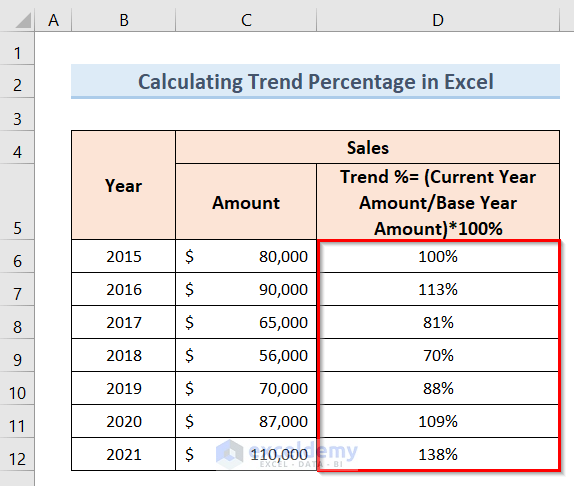
Trend Percentage represents the comparison of financial information like net sales, operating expenses, gross profit, inventory, cost of goods sold, ...
In a chart, a Trendline additionally referred to as a line of the first-class suit, is an immediate or curved line that depicts the overall sample or ...
Finding the slope of a linear trendline is relatively straightforward in Excel. You just have to find out the equation and declare the coefficient of ...