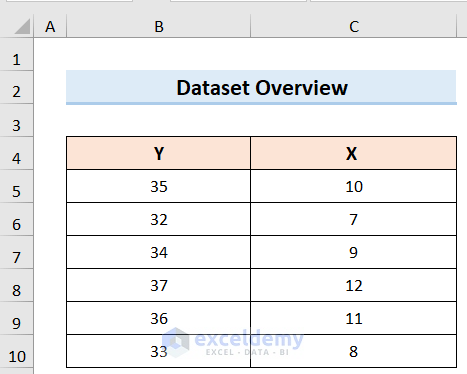
We have an independent variable in Column C marked as X and a dependent variable in Column B marked as Y. We will use this dataset to determine the slope of a trendline.
Method 1 – Finding the Slope in Excel Using a Trendline
Steps:
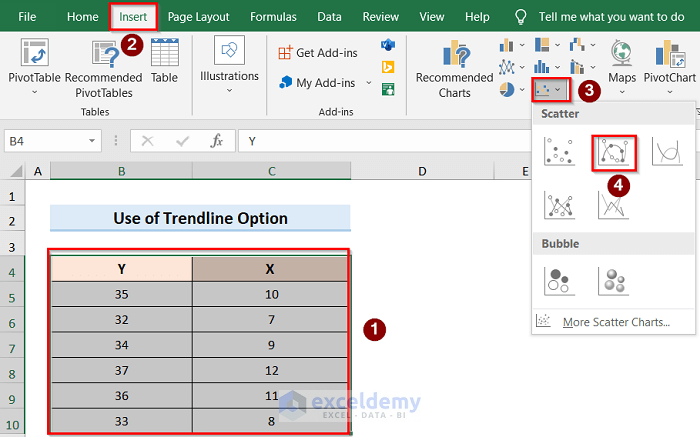
- Select the whole dataset.
- Go to the Insert tab.
- From Recommended Charts, choose a Scatter Chart.
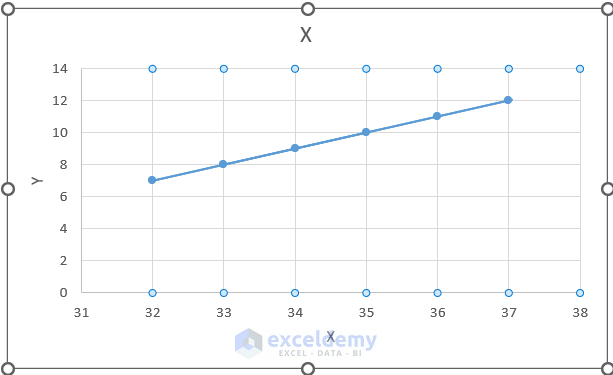
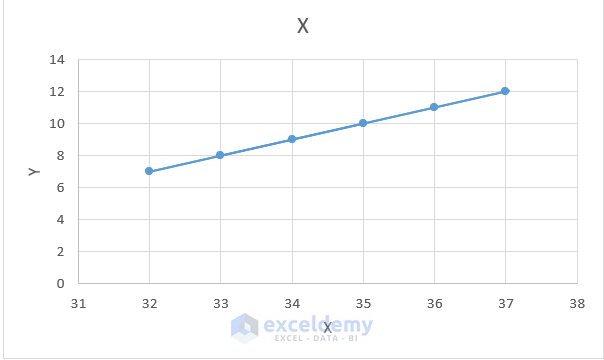
- You will get a graph.
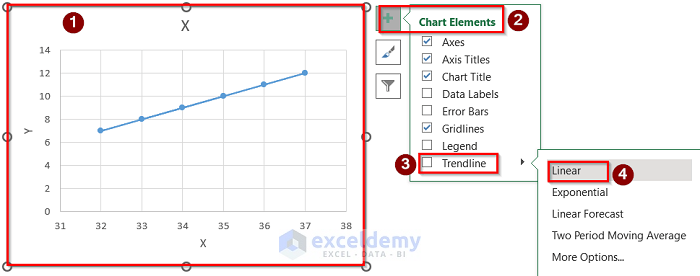
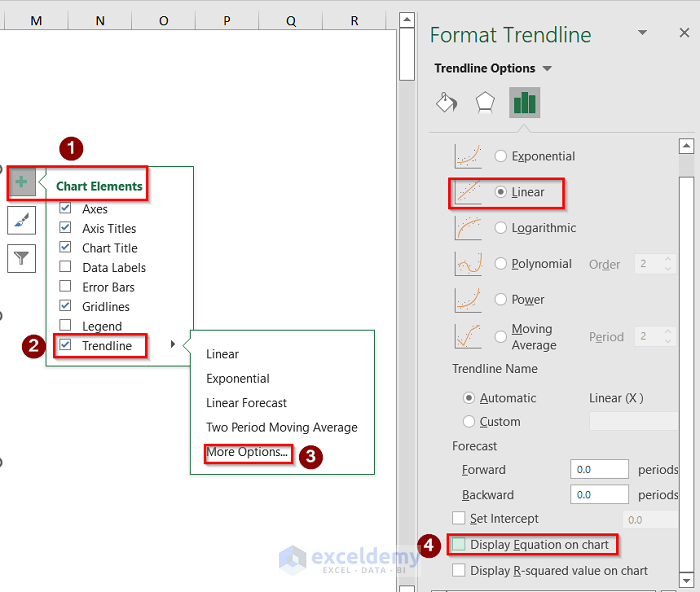
- Select the graph and click on the Chart Elements option.
- Click on the Trendline option and select the Linear option to show the linear relation between the graph axes.
- If this directly does not work, select the Trendline option and go to More Options.
- The Format Trendline tab will open on the right side of the window.
- Select the Linear option to show the relationship.
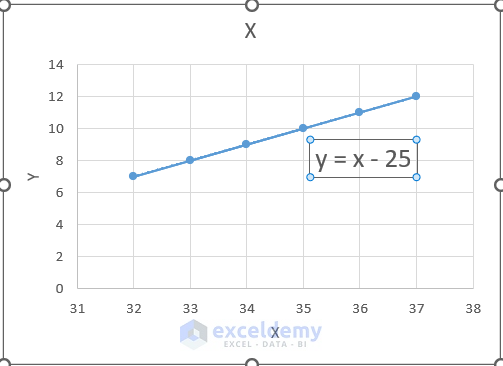
- You can select the Display Equation on Chart option to show the graph equation on the display screen.
- Note that the linear relationship equation is y=mx+c. In this case, we have found the equation like y = x-25. If we compare these two equations together, we can see that the slope of the is m=1.
Read More: How to Add Trendline Equation in Excel
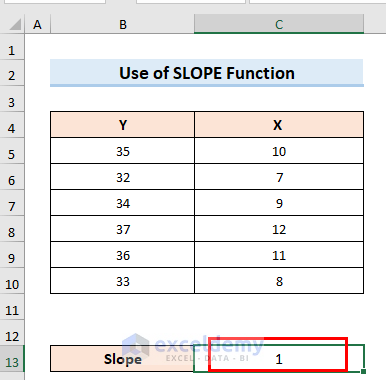
Method 2 – Calculating the Slope of a Trendline with the SLOPE Function
Steps:
- Use the dataset and make a scatter chart as described in Method 1.
- Select any empty cell and use the following formula.
=SLOPE(B4:B10,C4:C10)
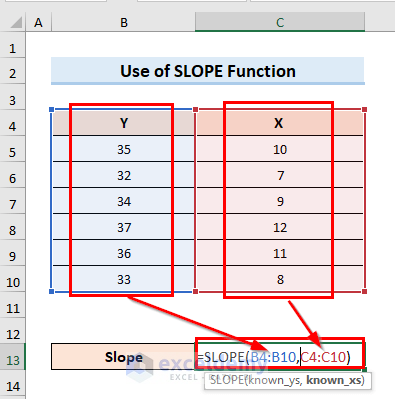
- You will get the slope of the trendline.
Things to Remember
- Directly choosing the Linear option from the Trendline tab might not work most of the time. So, it is recommended for most cases to go to More Options and select Linear and Display Equation on the Chart option manually from the Format Trendline.
- In the second method, in the Slope function, select the column for Y values then the column for X values. The two arrays have to be the same size
- After getting the equation, you have to compare it with the y=mx+c equation to determine the slope manually. But, in the second method, the slope of the trendline is directly shown in the cell where the Slope function is used.
Download the Practice Workbook
Related Articles
<< Go Back To Trendline in Excel | Excel Charts | Learn Excel
Get FREE Advanced Excel Exercises with Solutions!
