Method 1 – Single Trendline
Steps
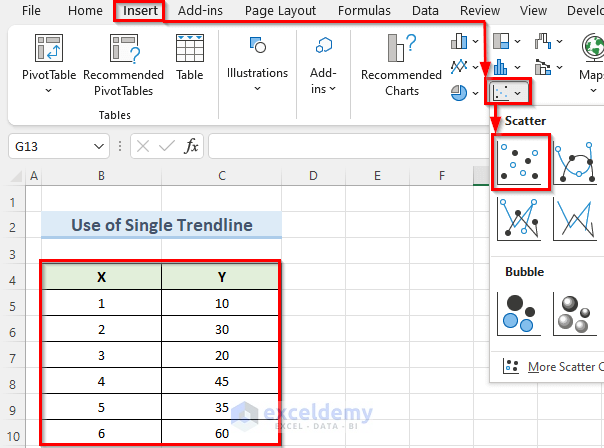
- Choose your dataset using the mouse.
- Go to the Insert tab and select Scatter from the Insert Scatter (X, Y) or Bubble Chart dropdown.
- This will create a scattered chart with your data points.
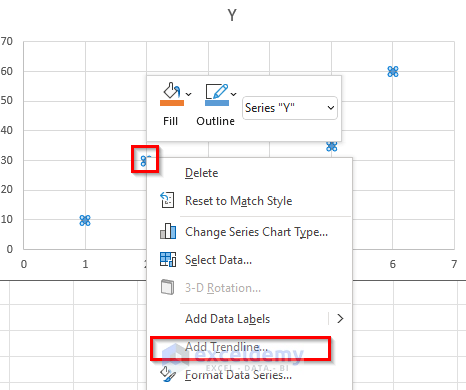
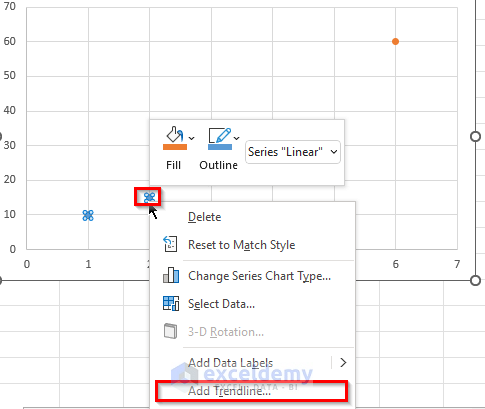
- Right-click on any chart point and choose Add Trendline.
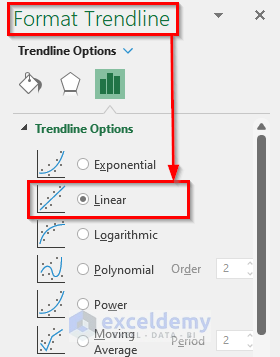
- In the Format Trendline window, select Linear as the trendline option.
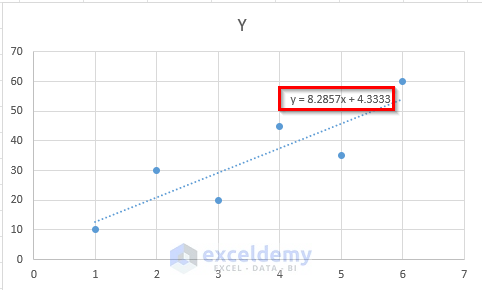
- Check Display Equation on Chart to see the equation.
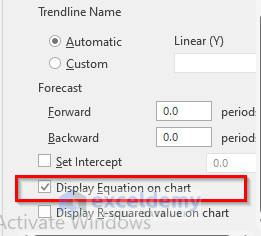
- You should see a trendline on your chart with the equation.
Read More: How to Find the Equation of a Line in Excel
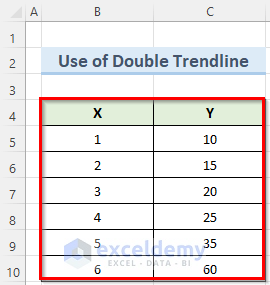
Method 2 – Use Double Trendline
When you have an Excel dataset that has different categories of data points, you can use this method to find the equation of a trendline.
Steps
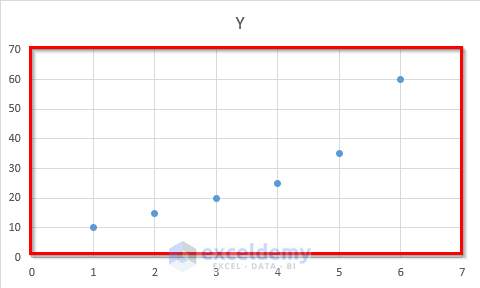
- Select your dataset and create a scatter plot (similar to the one shown below).
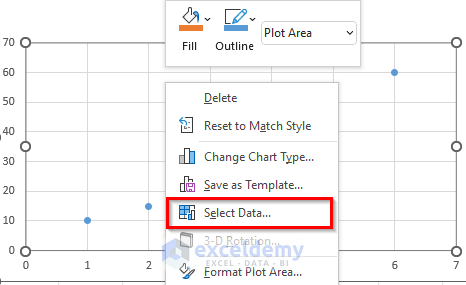
- Right-click on the chart and choose Select Data.
- In the new Select Data Source window, select the data series Y and click Remove.
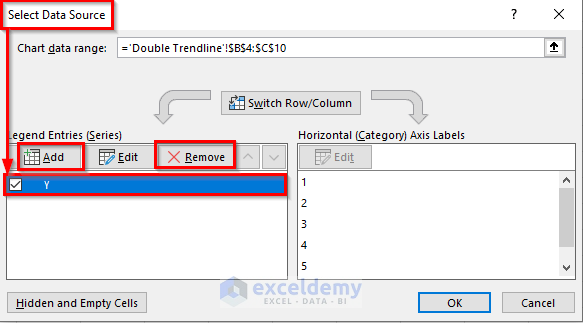
- A new Edit Series window will open.
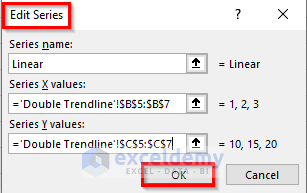
- Click Add and create a new data series named Linear.
- Select cells B5 to B7 as the Series X values.
- Select cells C5 to C7 for the Series Y values.
- Press OK.
- Create another dataset with the name Polynomial.
- For the Series X values select cells B8 to B10, and for Series Y values select cells C8 to C10.
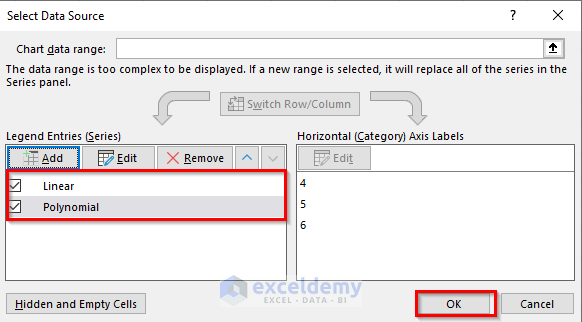
- You will see a scatter plot of the two data series we just created.
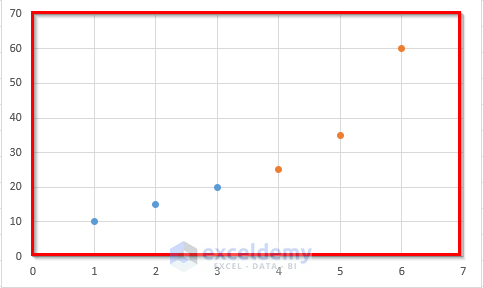
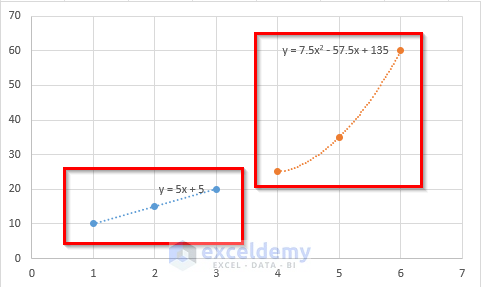
- Right-click on any of the blue data points and select Add Trendline.
- Follow the steps from Method 1 to display the Linear trendline equation.
- Repeat for orange data points using the Polynomial option.
Method 3 – Column Chart Trendline
Steps
- Select your data and go to the Insert tab.
- Click on the Insert Column or Bar Chart dropdown and select the Clustered Column option.
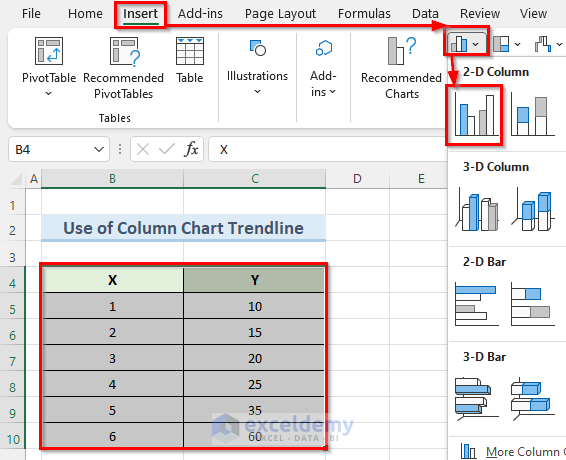
- Excel will generate a 2-D clustered column chart.
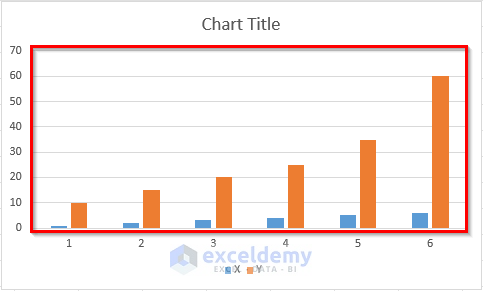
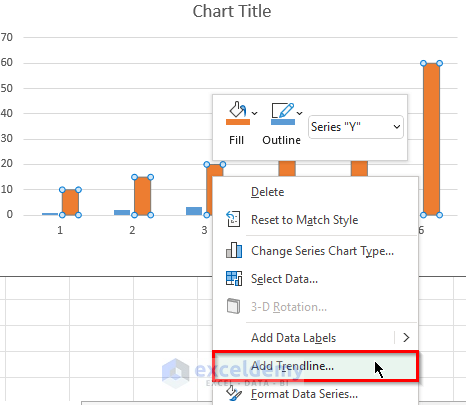
- Right-click on any of the orange-colored columns and select Add Trendline.
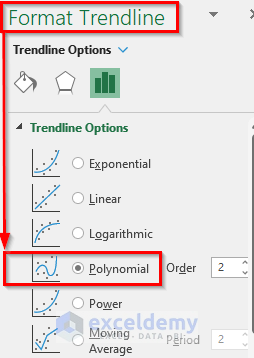
- In the new Format Trendline window, choose Polynomial as the Trendline Options.
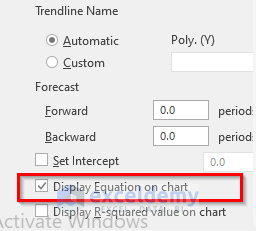
- Check Display Equation on Chart option to see the polynomial equation.
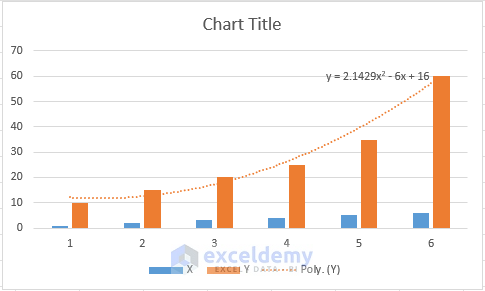
- A polynomial trendline will show on your chart.
Download Practice Workbook
You can download the practice workbook from here:
Related Articles
- How to Show Equation in Excel Graph
- How to Create Equation from Data Points in Excel
- How to Use Trendline Equation in Excel
- How to Find Slope of Trendline in Excel
- How to Find Intersection of Two Trend Lines in Excel
- How to Find Unknown Value on Excel Graph
<< Go Back To Trendline Equation Excel | Trendline in Excel | Excel Charts | Learn Excel
Get FREE Advanced Excel Exercises with Solutions!
