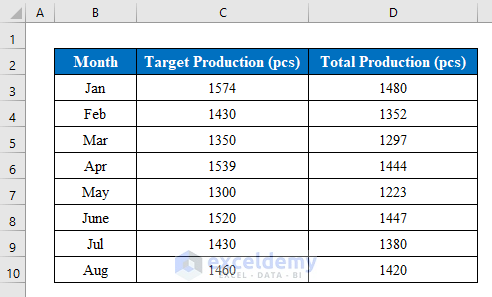
We have a dataset of a manufacturing company’s Total Production and Target Production month-wise. We will make a chart and create an equation from data points inside the chart.
Method 1 – Using the Trendline Option
Steps:
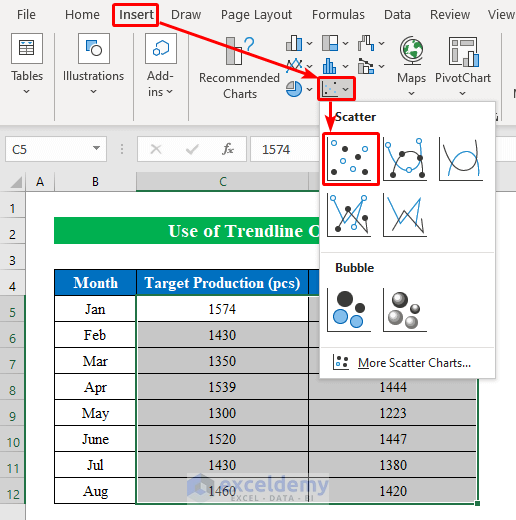
- Select numeric data from the list and draw a “Scatter Chart” from the “Insert” option.
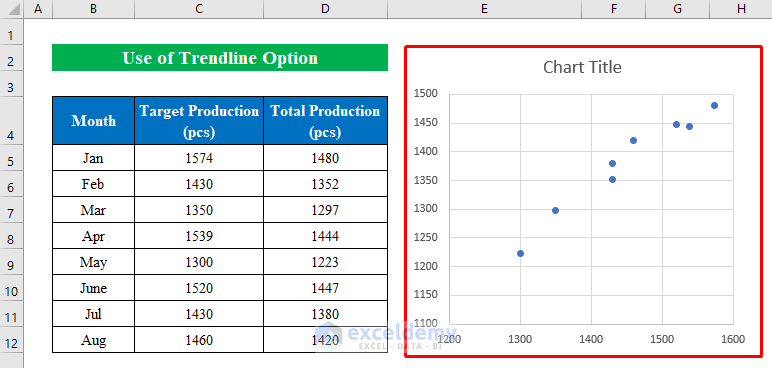
- You will get the scatter chart with data points inside the worksheet.
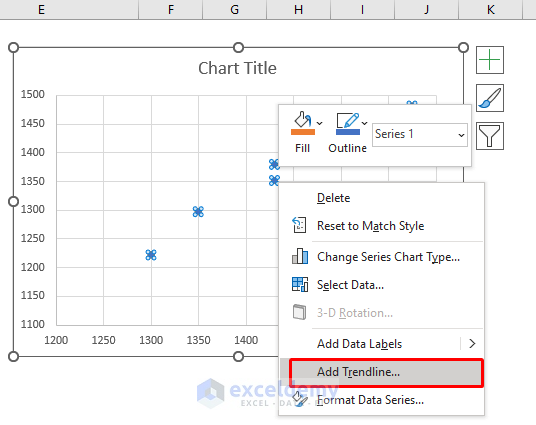
- Select any data point from the graph.
- Right right-click and choose “Add Trendline” to draw the trendline.
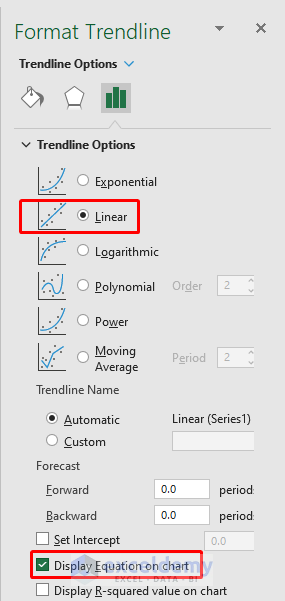
- Choose “Linear” to draw a linear trendline and check the “Display Equation on chart” to get the equation.
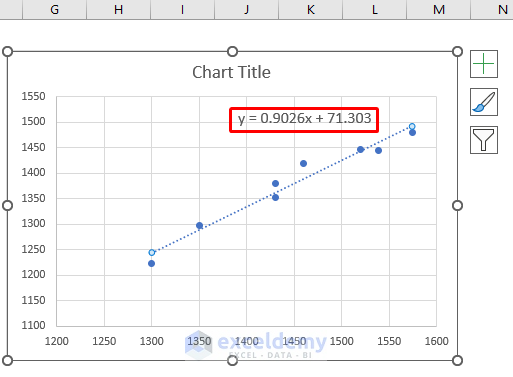
You will get the equation inside the graph, as shown in the following screenshot.
- Select a cell (E5) and enter the following formula:
=0.9026*C5 + 71.303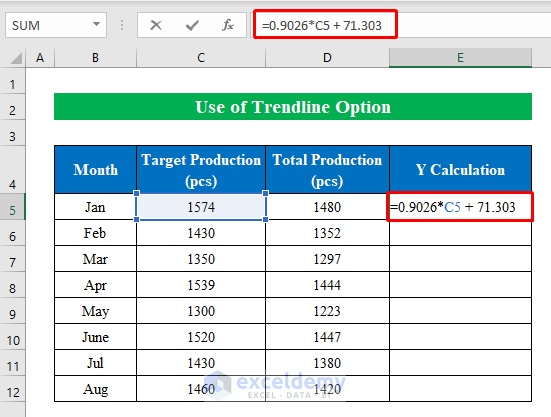
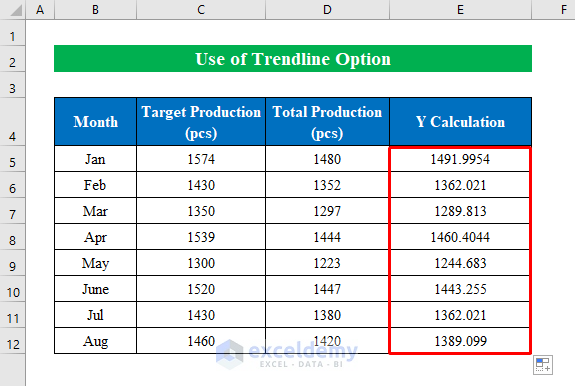
- Press Enter and drag the “fill handle” down to fill all the cells.
We have successfully created an equation from data points in Excel.
Read More: How to Show Equation in Excel Graph
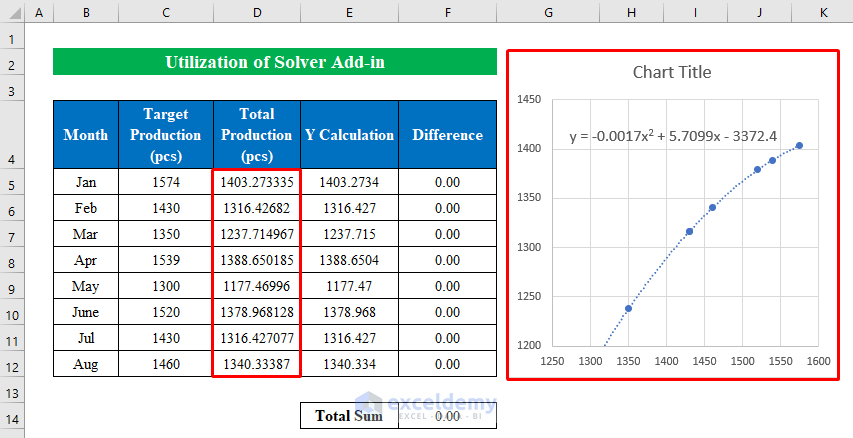
Method 2 – Utilizing the Solver Add-in
Steps:
- Draw a scatter chart with the numeric values from the list.
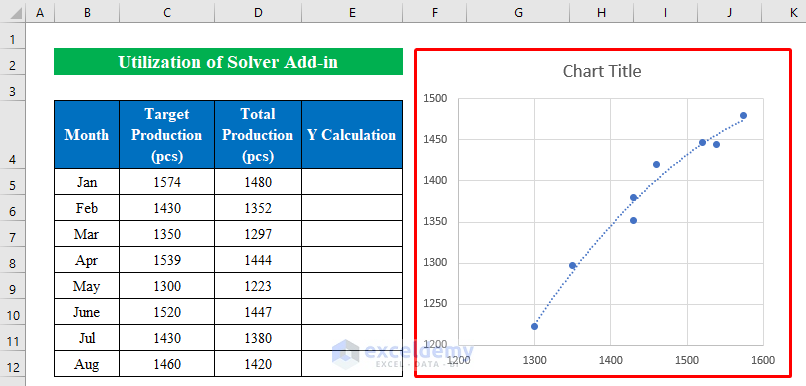
- This time, we will create a “Polynomial Trendline” to better understand the data.
- Inside the chart, click the right button and choose “Format trendline” from the options.
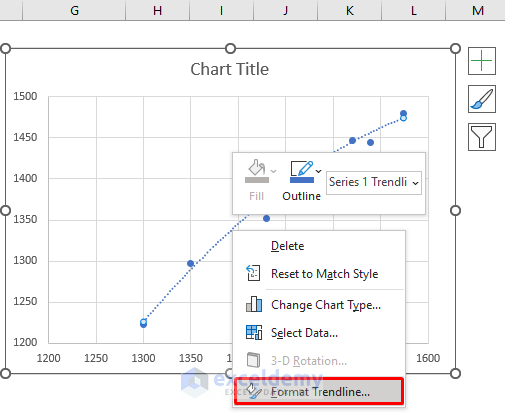
- Select “Polynomial” and check the “Display Equation on chart”.
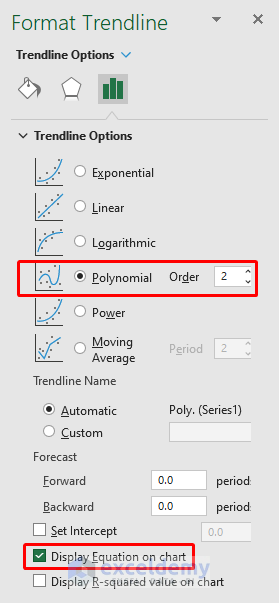
We will get the equation from the data points plotted in the chart.
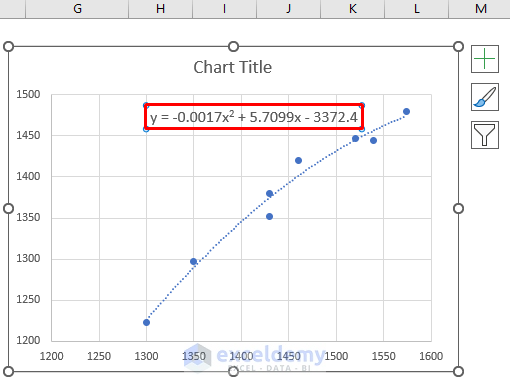
- Choose a cell (E5) and enter the following formula:
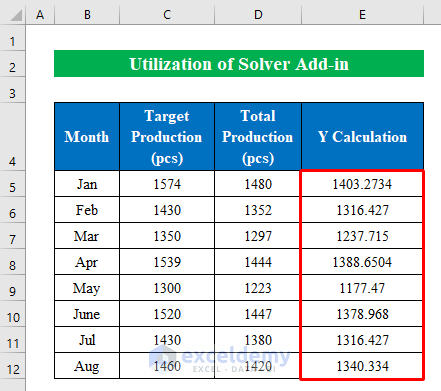
=-0.0017*C5^2 + 5.7099*C5 - 3372.4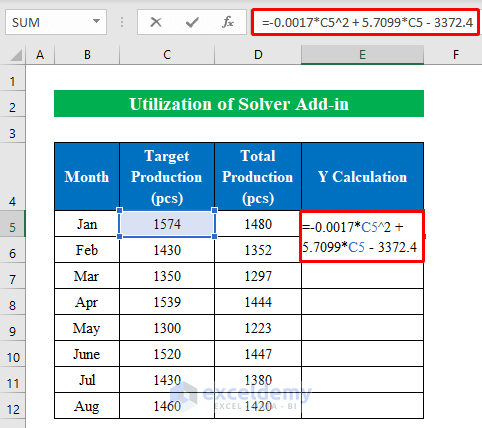
- Press Enter and drag down the “fill handle” to fill.
- We will calculate the difference between the variable and the data point value.
- Choose a cell (F5) and enter the following formula:
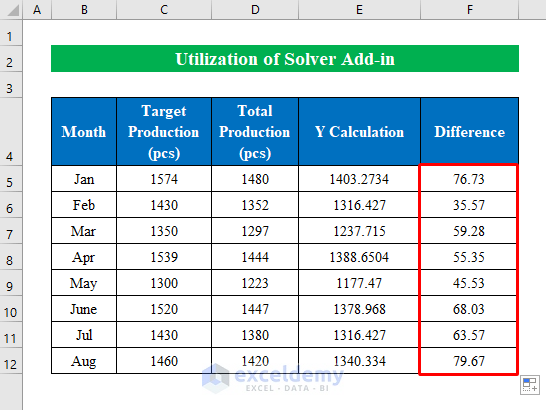
=D5-E5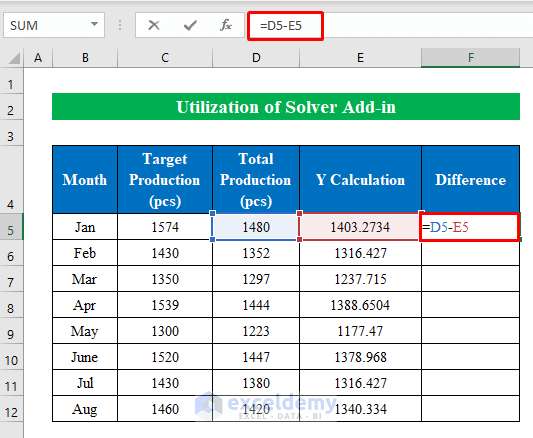
- Press Enter and drag down the “fill handle” to fill with precious output.
- To minimize the difference,
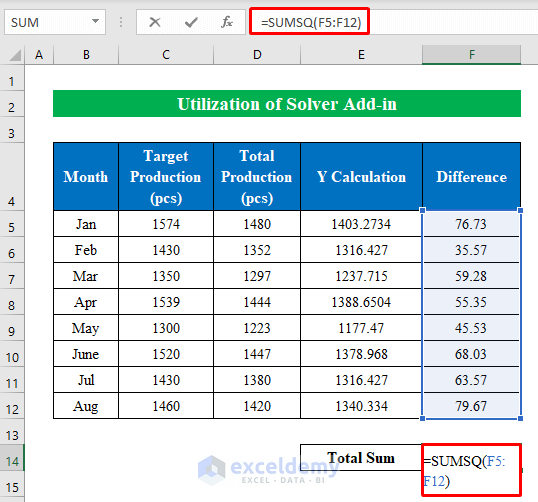
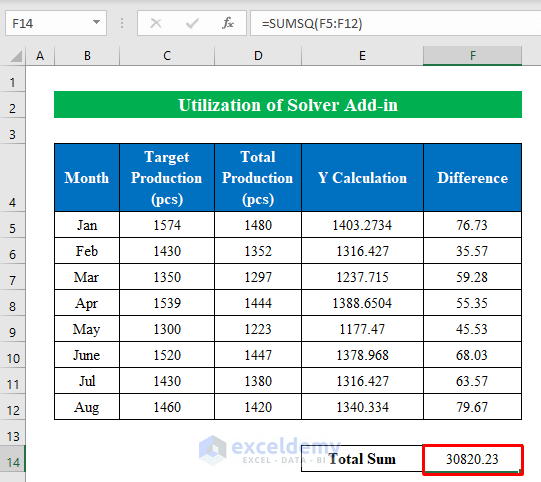
- Select a cell (F14) and enter the following formula:
=SUMSQ(F5:F12)Where,
- The SUMSQ function returns the sum of the squares value the string provides.
- Press Enter to see the results.
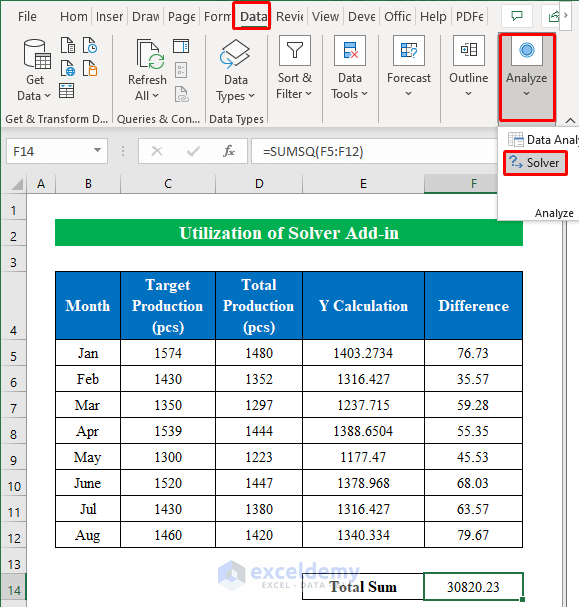
- In order to minimize the difference go to the “Solver” option from the “Data” option.
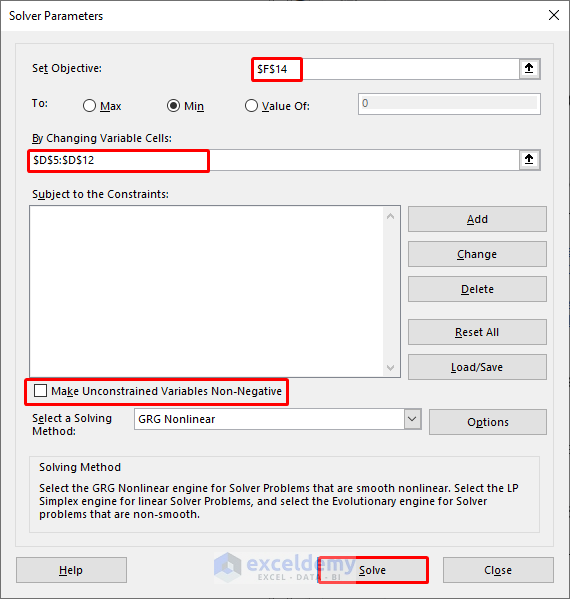
- In the new window, select the total difference output cell in the “Set Objective” cell.
- Select the changing variables and remove the check mark from the “Make Unconstrained Variables Non-Negative” option.
- Press “Solve” to get the final output.
We have completely minimized the differences; thus, the chart has plotted a trendline over all the data points.
Read More: How to Make a Polynomial Trendline in Excel
Things to Remember
- If you are not getting the “Solver” option in your “Data” feature just follow the instructions to get it. Go to File > Options > Add-ins. Then checkmark the “Solver Add-ins” option and get it inside the “Data” ribbon.
Download the Practice Workbook
Download this workbook to practice.
Related Articles
- How to Find the Equation of a Line in Excel
- How to Find the Equation of a Trendline in Excel
- How to Use Trendline Equation in Excel
- How to Find Slope of Trendline in Excel
- How to Find Intersection of Two Trend Lines in Excel
<< Go Back To Trendline Equation Excel | Trendline in Excel | Excel Charts | Learn Excel
Get FREE Advanced Excel Exercises with Solutions!

You just modified the original data set to match the trendline that excel has created in first place. What is the use of this?
It will be useful only when you are able to fine tune the equation excel gave to suit your data points and not change the data points to match the excel equation.
Dear Yogiraj,
Thank you for your comment.
You are absolutely right about your opinion regarding its use.
By creating equation from data points you can also see the difference between the plotted and actual data points.
Thanks