Finding the slope of a linear trendline is relatively straightforward in Excel. You just have to find out the equation and declare the coefficient of x from the equation as the slope. But the slope of a curve varies at different points of x. Excel provides curved polynomial trendlines of degrees up to 6. Unfortunately, there is no straightforward way to find the slope at different points in Excel. Nevertheless, this article will provide a workaround to find the slope of a polynomial trendline in Excel.
What Is Polynomial Trendline?
A trendline, as the name suggests, indicates the trend of change of variables in a graph. It generally measures the change of a particular parameter, like y, with respect to another parameter(like x values). This trendline can be linear or move in various upward and downward directions.
In a polynomial trendline, the trendline curve moves upwards and downwards multiple times. This movement indicates the oscillating values on the y-axis
. The degree of the polynomial curve is determined by the number of bends in the curve, as it is directly proportional to the degree of the equation it represents. These bends are generally called hills or valleys depending on their shapes. Among the polynomial curves, a quadratic one has 1 bend, a cubic one has typically 2 bends, and so on.
Step-by-Step Process to Find Slope of Polynomial Trendline in Excel
As a polynomial trendline is a curve, the slope will be different at different points of the curve- which can not be directly derived in Excel till now. The general idea to find the slope of these types of polynomial trendlines is to differentiate y with respect to x, and insert the abscissa of the point in the differentiated equation. But fear not, we can still work around that with excel tools. As Excel can only provide polynomial trendlines of degrees up to 6, we can use formulas to make a custom dataset that can calculate the slope at different points.
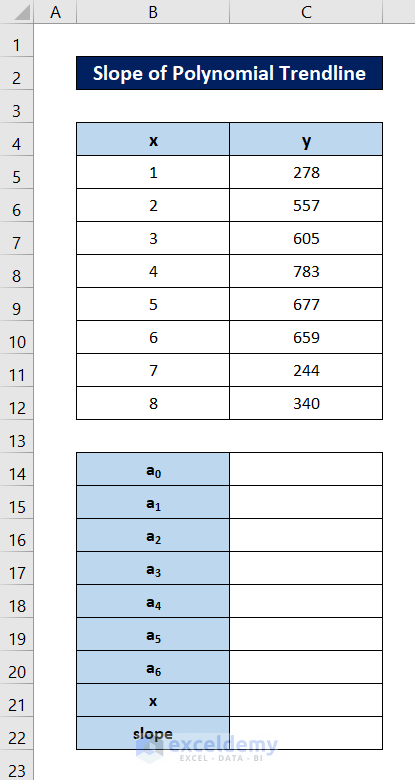
For demonstration, we are using the following dataset.

Follow these detailed steps to see how we can measure the slope of the curve plotted from the dataset.
Step 1: Plot Clustered Column Chart
To calculate the slope of the polynomial trendline, we need to plot the curve first in an Excel spreadsheet. Follow these steps to plot a curve from the dataset.
- First of all, select the whole dataset (the range B4:C12).
- Then go to the Insert tab on your ribbon.
- After that, select Recommended Charts from the Charts group.

- Now select your preferred chart from the Insert Chart We are using the clustered column chart for the demonstration.

- Then click on OK.
As a result, a chart will pop up on the Excel spreadsheet that represents the dataset.

Step 2: Plot Polynomial Trendline
As we can see from the end of the previous step the values of y fluctuate with the change of x values. So a logical next step would be plotting a trendline to track these changes. Since the values change upward and downward many times, a polynomial trendline would be more suitable in this particular case. Follow these steps to plot a polynomial trendline in Excel.
- First, select the chart by clicking on it once.
- As a result, three additional options for the chart will appear on the top-right of the chart. Now select Chart Elements from it.
- After that, click on the arrow beside Trendline in the Chart Elements options.
- Next, select More Options from the menu.

- Thus, the Format Trendline window will appear on the right of the Excel spreadsheet. First, select the Trendline Options tab in it.
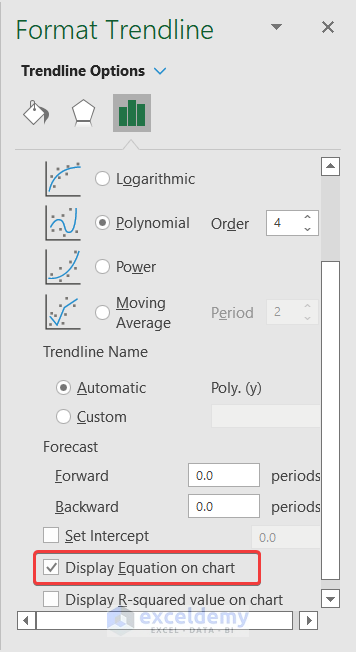
- Then select Polynomial as the trendline and the order of it beside the same option under the Trendline Options See the figure below.

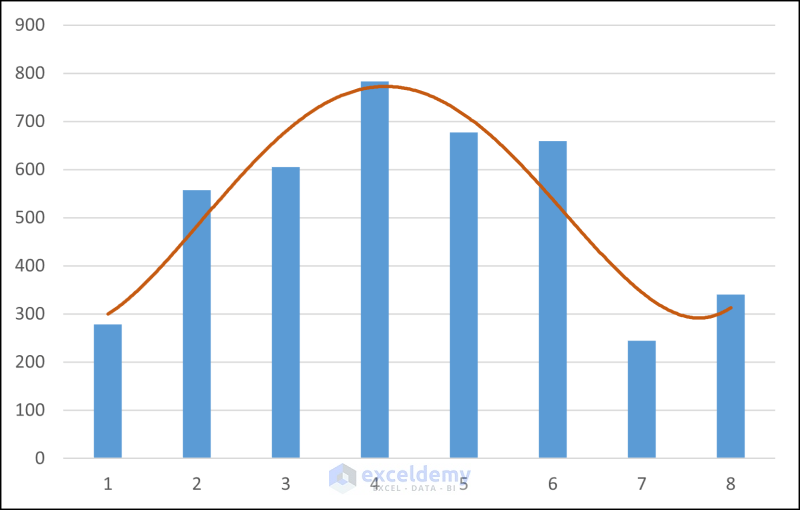
We are selecting an order of 4, as it closely resembles the trend of the graph.
Hence, the trendline will appear on the chart.
Read More: How to Make a Polynomial Trendline in Excel
Step 3: Display Equation on Chart
The equation is the most essential part when it comes to determining the slope of a curve. Luckily, Excel has a quick and easy step to find out the equation of the polynomial trendline which will help us find the slope of the curve at different points.
- To display the equation of the polynomial trendline in Excel, double-click on the trendline first.
- As a result, the Format Trendline window will appear on the right of the Excel spreadsheet. Now go to the Trendline Options tab in it.
- Then, under the Trendline Options section, check the Display Equation on chart option.
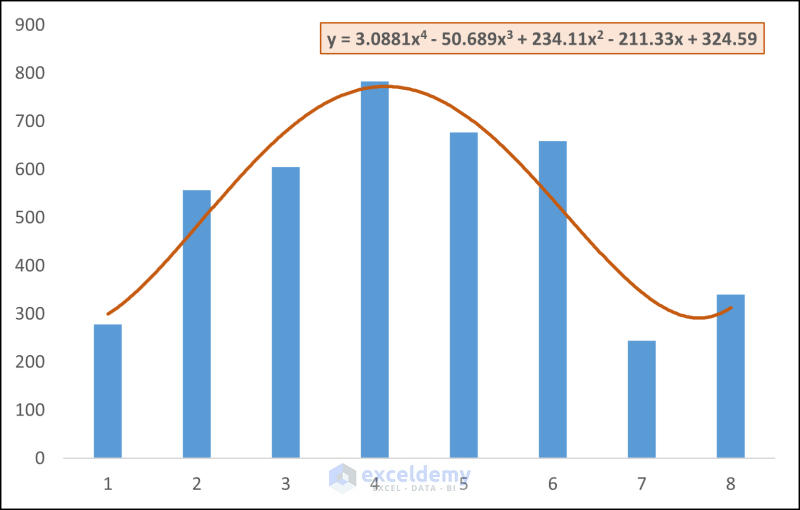
As a result, the equation will appear on top of the chart, Modify it to make it more visible and presentable.
Read More: How to Add a Trendline to a Stacked Bar Chart in Excel
Step 4: Create Dataset for Coefficients
For linear trendlines, this equation would have been y=mx+c. There, we could directly say the value of m as slope. But in the case of polynomials, the equation is of the form y=a0x6+a1x5+a2x4+a3x3+a4x2+a5x+a6. For polynomial equations like this, the value of dy/dx will indicate the slope for a particular point.
In this step, we will make a template that can determine this differential value for polynomial equations up to the 6th degree (the Excel permitted order limit). For Inputs, we need the values from a0 to a6. So let’s first create a chart that can take these values.

We need a value for x too, as the slope varies with it. Also, we need a spot for the slope calculations.
Finally, select cell C22 and write down the following formula.
=C14*6*C21^5+C15*5*C21^4+C16*4*C21^3+C17*3*C21^2+C18*2*C21+C19
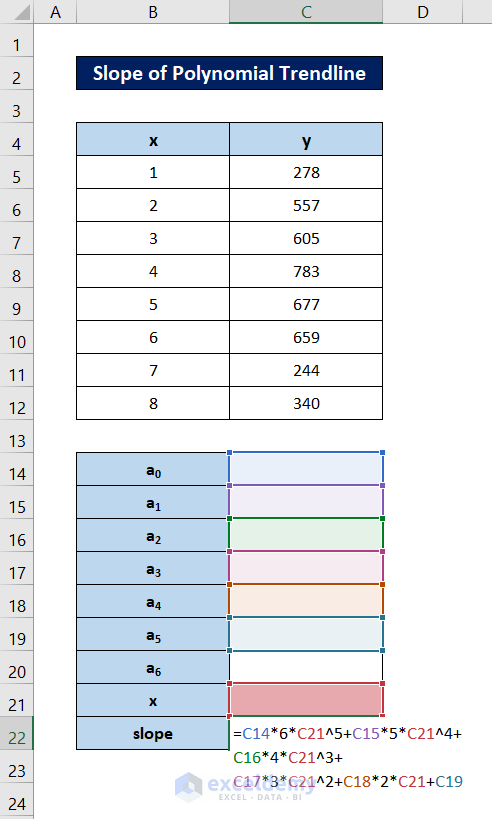
Once you are done, press Enter.
Step 5: Enter Values of Coefficients
In this step, put in the values of the coefficient and the x value of the point where you want to calculate the slope. As our equation was of degree 4, it started with the term a2x4. And so, the value of a0 and a1 is absent in this case.
Putting the values of our equation according to the equation y=a0x6+a1x5+a2x4+a3x3+a4x2+a5x+a6 , the chart will look something like this now.

Now put the value of your desired position’s abscissa in cell C21. For example, we are putting a value of 2 here. The value of the slope will automatically show in cell C22.

So, we can say that the slope of our dataset at x=2 is 215.6112, which indicates a massive increase of y at the point.
Step 6: Find Slope for Other Values
From the chart plotted in step 2, we can see that at x=2, the graph was going upward which matches with the result obtained in step 5. Let’s try it out for a different value of the same dataset. This time, let’s take a value where the polynomial trendline is going downward, like x=5.
Putting the value in cell C21, we find the following.
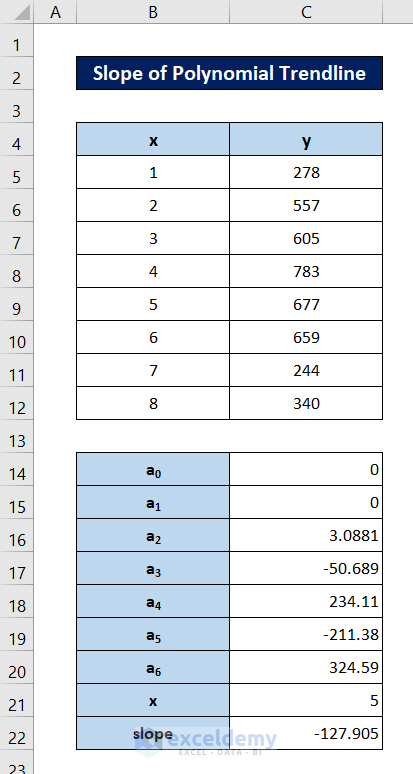
We can see that the number is negative, which also represents the downward direction of the slope in the polynomial trendline we have created in Excel.
Read More: How to Find Slope of Trendline in Excel
Things to Remember
👉 With these Excel calculations, you can only calculate the slope of a polynomial trendline up to the order 6.
👉 The second dataset’s values should follow the equation y=a0x6+a1x5+a2x4+a3x3+a4x2+a5x+a6. For lower-order equations, carefully, enter the values in this dataset.
👉 Although, unnecessary, this process also yields accurate results for linear trendlines.
Download Practice Workbook
You can download the workbook with datasets and the demonstration chart from the link below.
Conclusion
That is how you can find the slope of a polynomial trendline in Excel up to the current version. Hopefully, you can easily calculate the slopes of polynomial trendlines in Excel now. I hope you found this guide helpful and informative. If you have any questions or suggestions, let us know below.
Related Articles
- How to Find the Equation of a Line in Excel
- How to Find the Equation of a Trendline in Excel
- How to Show Equation in Excel Graph
- How to Get Y Equation on Excel Graph
- How to Create Equation from Data Points in Excel
- How to Use Trendline Equation in Excel
- How to Find Intersection of Two Trend Lines in Excel
<< Go Back To Trendline in Excel | Excel Charts | Learn Excel
Get FREE Advanced Excel Exercises with Solutions!
