In this article, we will explain how to add a trendline in Excel Online.
A trendline is a straight or curved line on an Excel chart that indicates the main pattern or direction of the data. It is an analytical tool, typically used to illustrate data changes over time or the relationship between two variables.
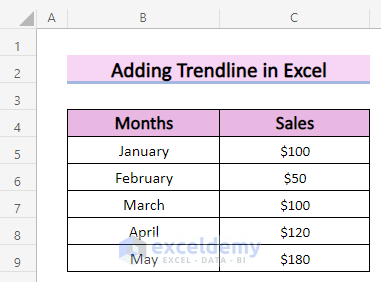
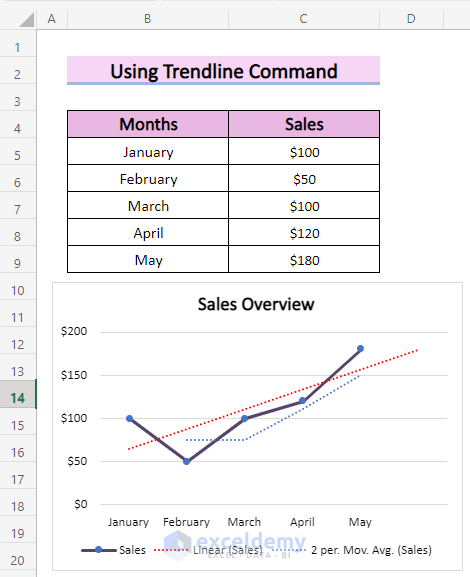
To explain the procedure, we’ll use the dataset below containing Months and Sales to make a chart, then add a trendline.
Step 1 – Inserting a Chart
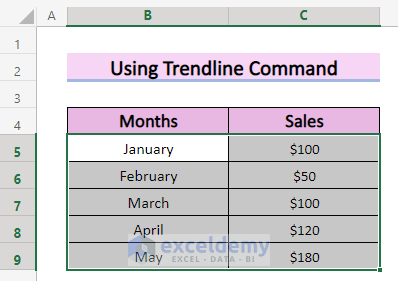
First, we’ll insert a chart for the dataset.
- Select the dataset.
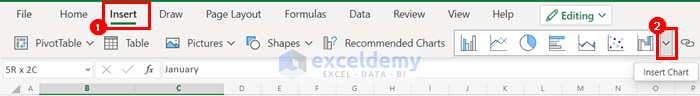
- Go to the Insert tab.
- Select the Insert Chart option.
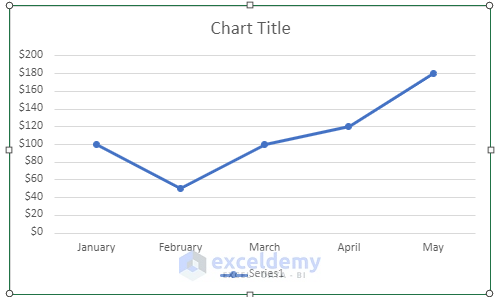
- Select the Line with Marker option from the drop-down.
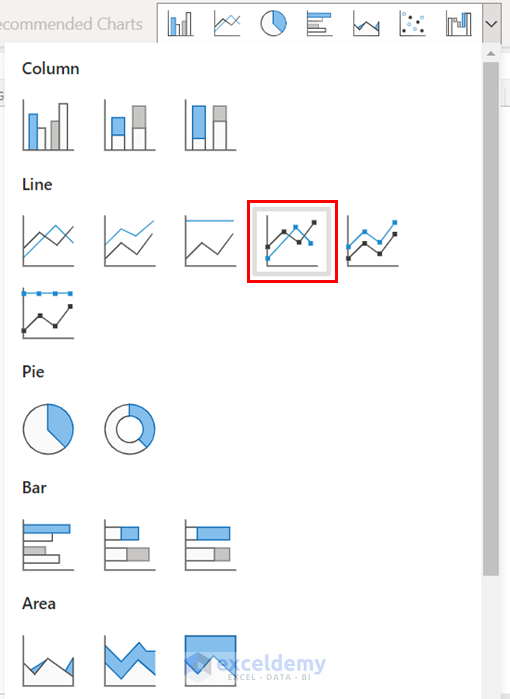
A line chart is inserted into your worksheet.
Let’s format the chart:
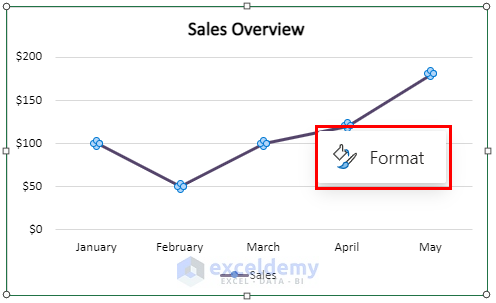
- Right-click on the chart.
- Select Format.
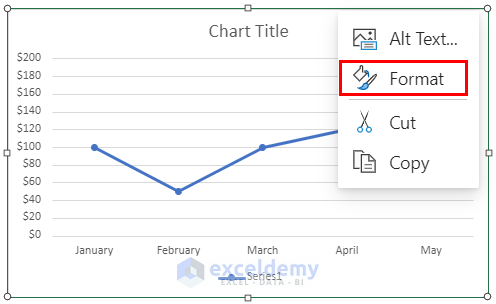
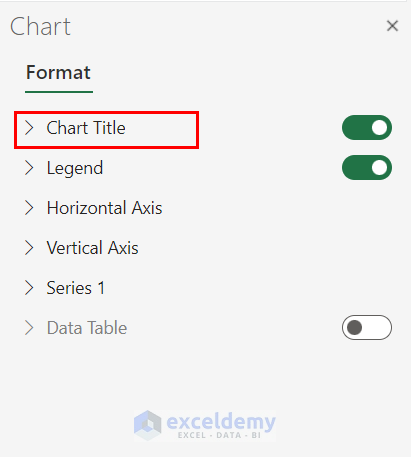
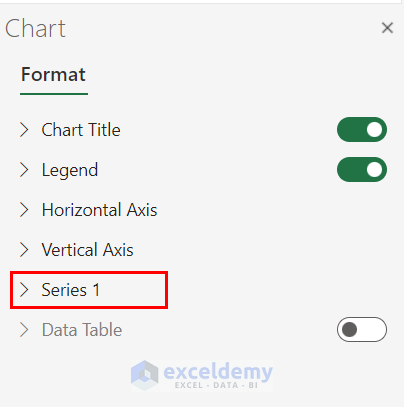
The Chart Format option will appear on the right side of the screen.
- Select Chart Title.
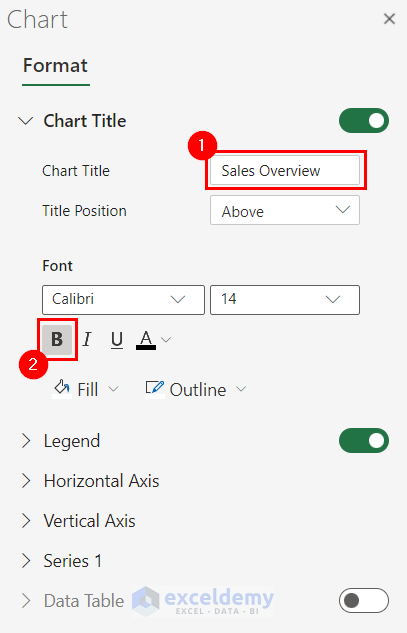
- Enter a title for your chart.
- Format the title as you like, for instance make it bold.
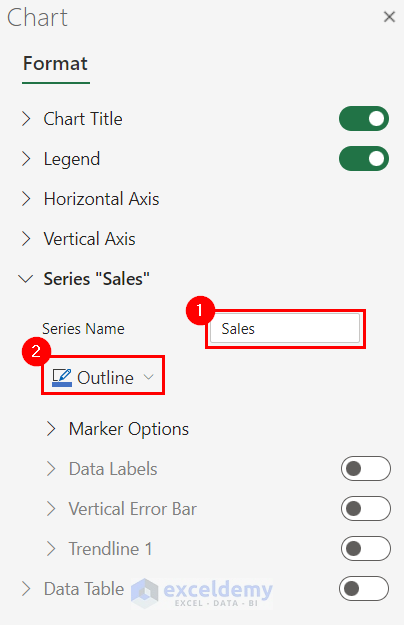
- Select Series 1.
- Change the Series Name as you like.
- Select Outline to change the color of the chart.
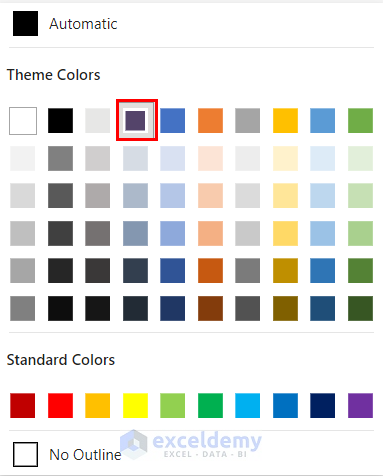
A list of colors will be presented.
- Select the color you want.
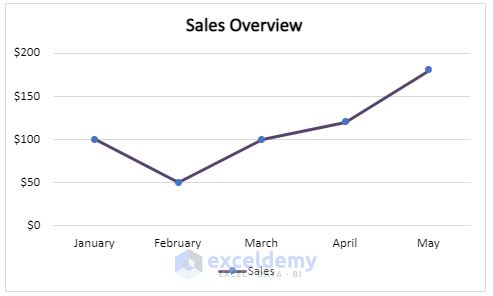
Our chart looks something like this:
Step 2 – Adding a Trendline in Excel Online
Now we’ll add a trendline to our chart.
- Right-click on the line of the chart.
- Select Format.
The Chart Format option will appear on the right side of the screen.
- Select Add Trendline 1.
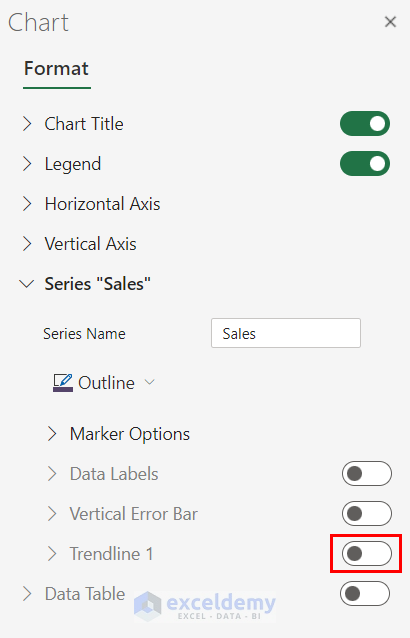
The options for the Trendline are displayed.
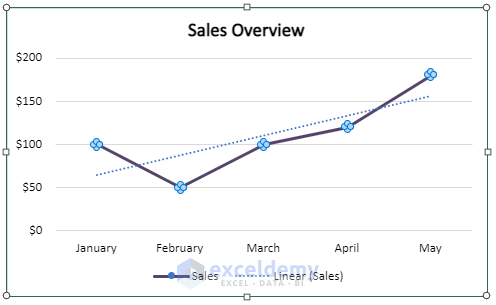
- Select the Trend type. Here, Linear.
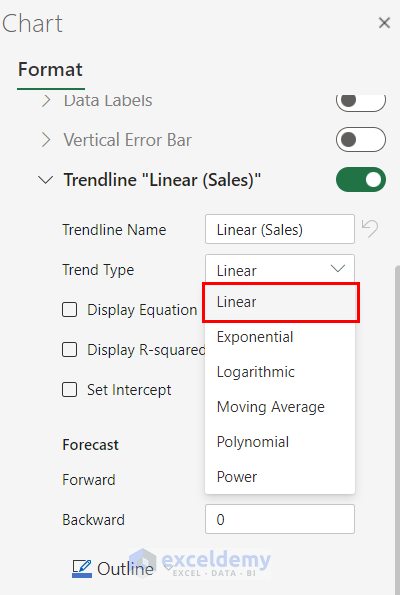
A linear trendline is added to the line chart.
Read More: How to Add Trendline Equation in Excel
Step 3 – Formatting the Trendline
Now we format the trendline.
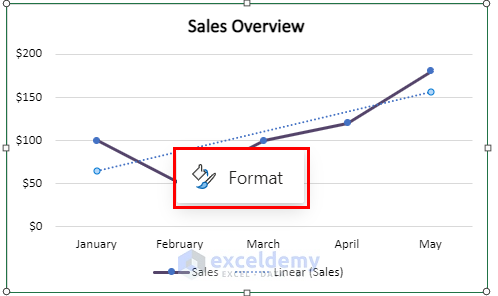
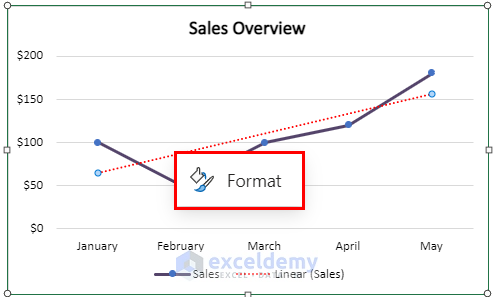
- Right-click on the trendline.
- Select Format.
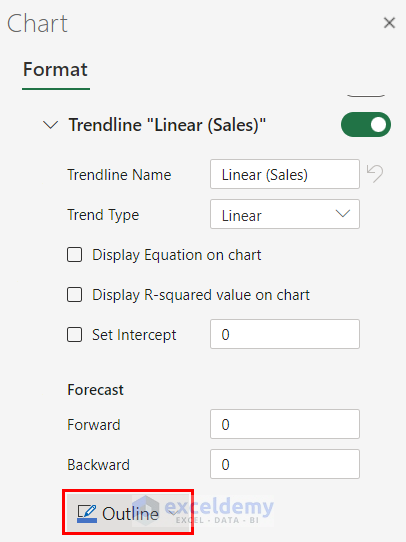
The Chart Format option will appear on the right side of the screen.
- Select Outline to change the color.
A list of colors will appear.
- Select a color for your trendline.
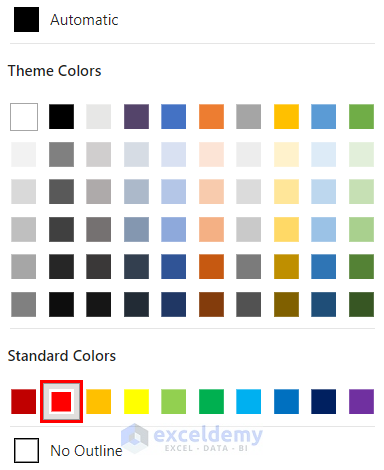
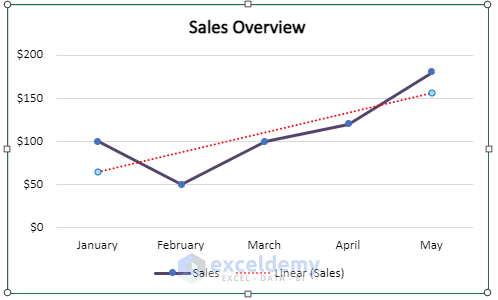
We have a lovely red dotted trendline.
Step 4 – Using the Trendline to Forecast Future Data
In addition to showing past trends, we can use our trendline to forecast future data.
- Right-click on the trendline.
- Select Format.
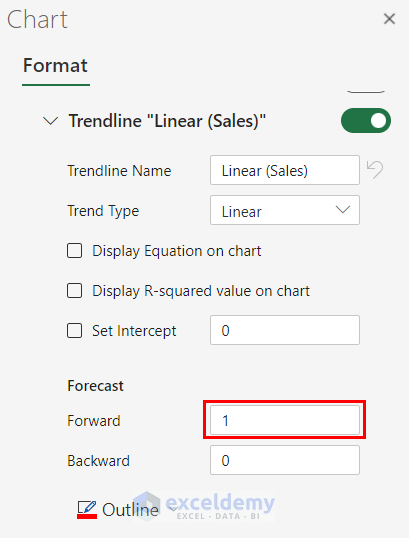
The Chart Format option will appear on the right side of the screen.
- Select a Forward period, the number of months into the future to Forecast.
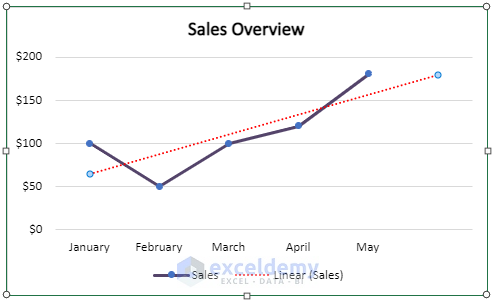
The trendline now includes a forecast of future data for the next month.
Read More: How to Create Monthly Trend Chart in Excel
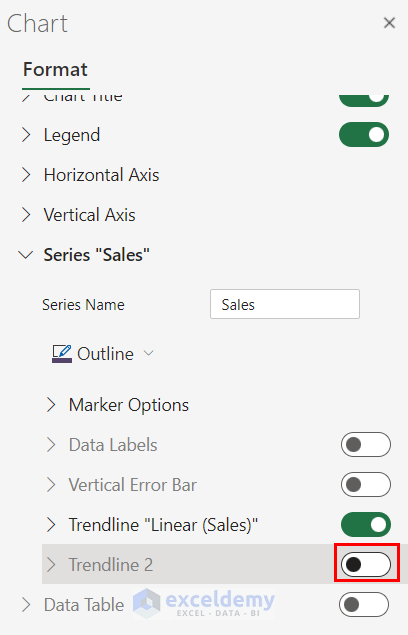
Step 5 – Adding Multiple Trendlines
We’ll now explain how to add multiple trendline in Excel Online.
- Right-click on the trendline.
- Select Format.
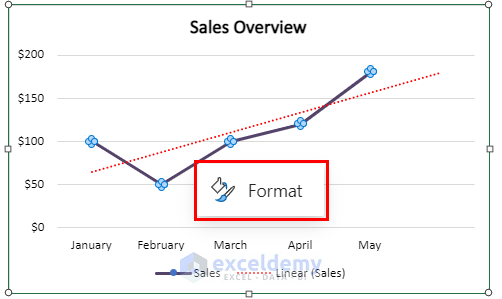
The Chart Format option will appear on the right side of the screen.
- Select Add Trendline 2.
- Select a Trend Type, for example Moving Average.
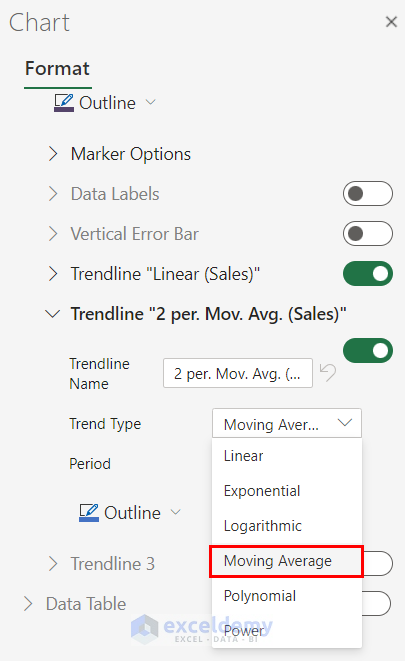
Another trendline is added to the line chart.
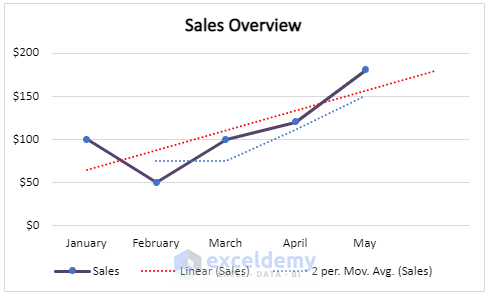
We have successfully added trendlines in Excel Online. The final output looks like this:
Things to Remember
- If you use more than 1 trendline, use different colors for each trendline for better visualization.
Download Practice Workbook
Related Articles
- How to Add a Trendline to a Stacked Bar Chart in Excel
- How to Find Unknown Value on Excel Graph
- How to Extend Trendline in Excel
- How to Exclude Data Points from Trendline in Excel
- [Solved]: Trendline Option Not Showing in Excel
- How to Use Trendline Equation in Excel
- How to Make a Polynomial Trendline in Excel
<< Go Back To Add a Trendline in Excel | Trendline in Excel | Excel Charts | Learn Excel
Get FREE Advanced Excel Exercises with Solutions!
