The article will show you how to solve a blending Linear Programming problem with Excel Solver. Linear programming is an important application when ...
In this example, we’ll consider a watersports business. They offer the Activity cruise, Nature cruise, and Sunset cruise. Here, we will analyze the ...
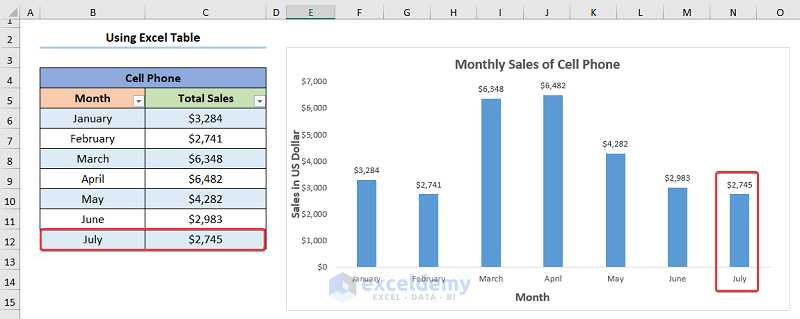
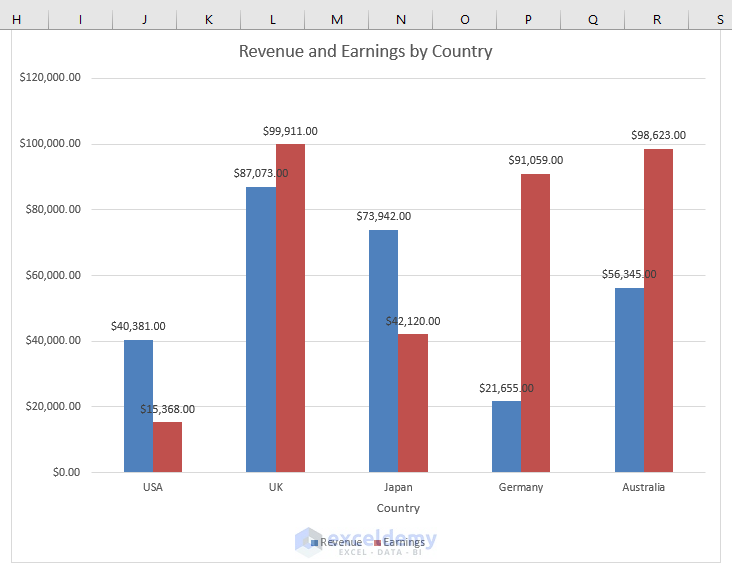
This article demonstrates the features of a Column Chart vs Bar Chart in Excel. Without any doubt, Excel charts are an excellent tool. It's suitable ...