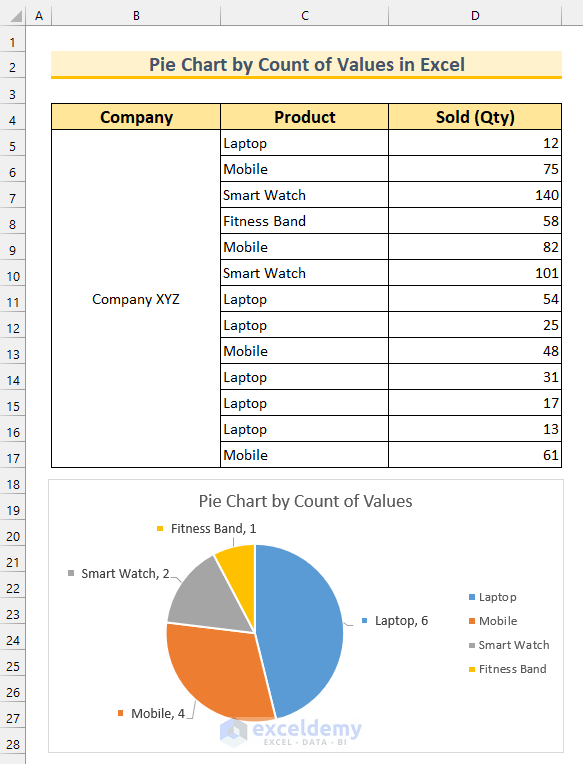
This article deals with the excel area chart data label position. An area chart is used to plot data arranged in rows or columns on a worksheet. You ...
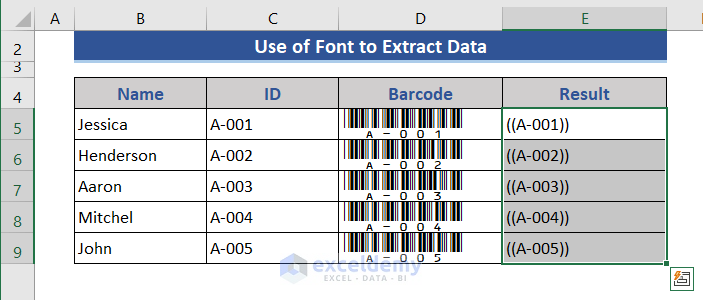
We always try to make the best out of our limits. In order to make the best use of our monthly income, it is best to make a personal monthly budget. ...