Method 1 – Using Data Analysis Tool to Do Exponential Smoothing in Excel
Step 1 – Enabling Data Analysis ToolPak Add-In
In Excel, Data Analysis ToolPak is not enabled by default so you have to enable it manually. Follow the steps below to enable the Data Analysis ToolPak.
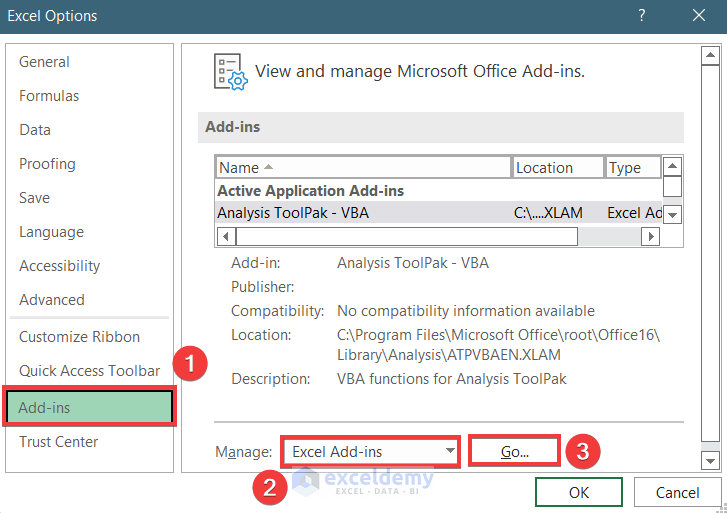
- Open any workbook in Excel and Go to File Tab >> Options.

- See a window named Excel Options will open.
- Go to the Add-ins options.
- Select Excel Add-ins in the Manage tools and press Go.
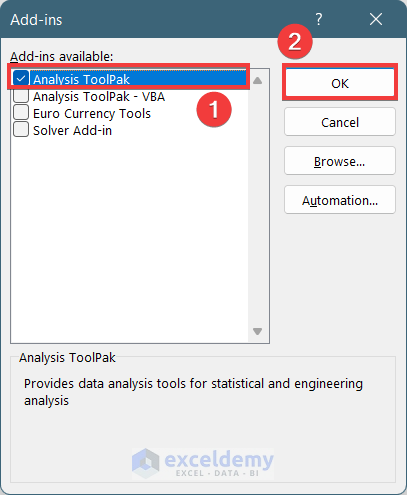
- Mark the Analysis ToolPak box and press OK.
Step 2 – Selecting Exponential Smoothing in the Data Analysis Dialog
- Go to the Data Tab.
- Select the Data Analysis option in the Analyze portion.
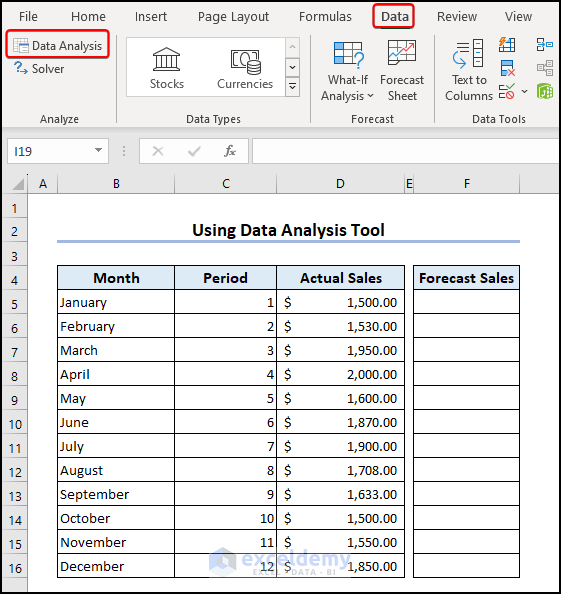
- After clicking on the Data Analysis option, a window named Data Analysis will appear.
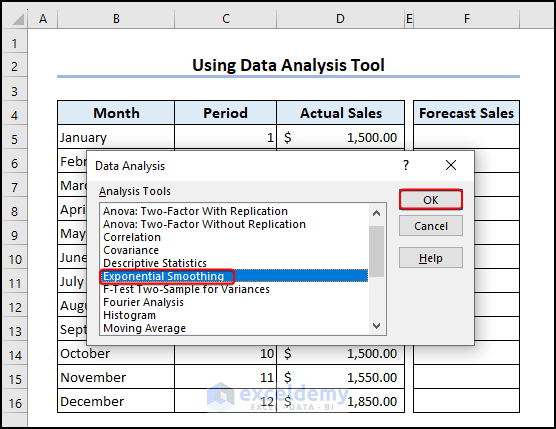
- Select Exponential Smoothing from the Analysis tools.
- Press OK.
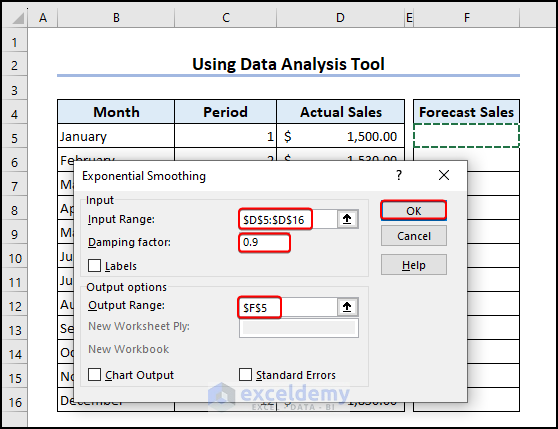
Step 3 – Inserting Proper Inputs in Exponential Smoothing Window and Apply
- After selecting Exponential Smoothing, a window will appear.
- Select the cells in the Actual Sales column as the Input Range.
- Insert the Damping Factor as 0.9 if the Alpha value is 0.1.
- Select the first cell of Forecast column F5 as Output Range.
- Press OK.
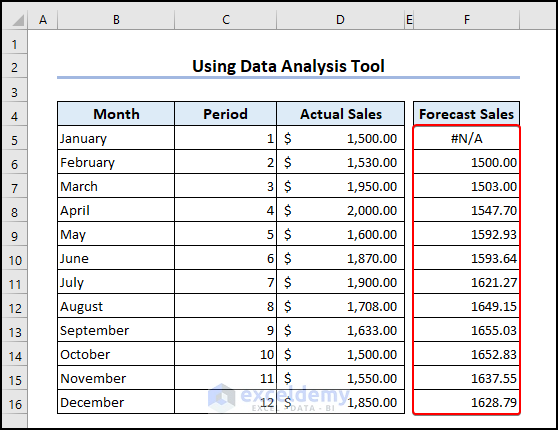
- After clicking the OK, you will see the Forecast column will be filled.
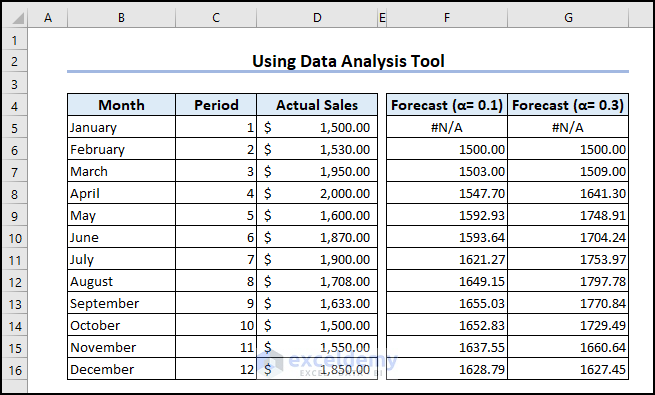
- You can create time series forecasting with an alpha value of 0.3 in a similar way. Insert (1-0.3)= 0.7 in the Damping factor box.
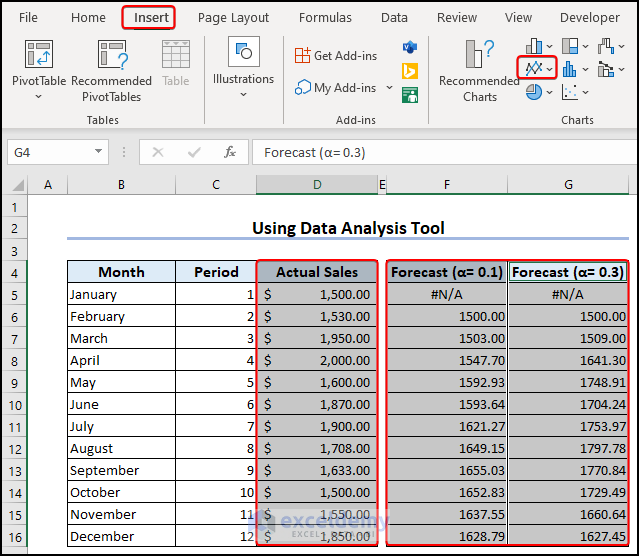
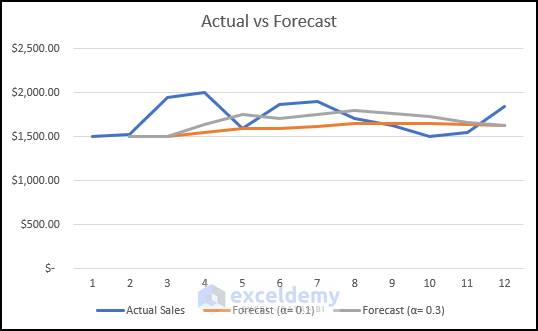
Step 4 – Inserting a Graph to Compare
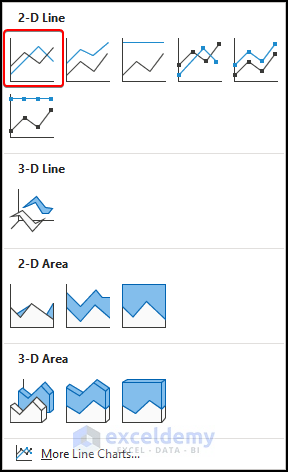
- Select range D4:D16 and F4:G16 simultaneously >> go to Insert tab >> Select Line or Area Chart.
- Tap on the Line chart in 2-D Line.
- Obtain the chart showing the differences.
Method 2 – Using Excel Solver Add-in to Do Exponential Smoothing
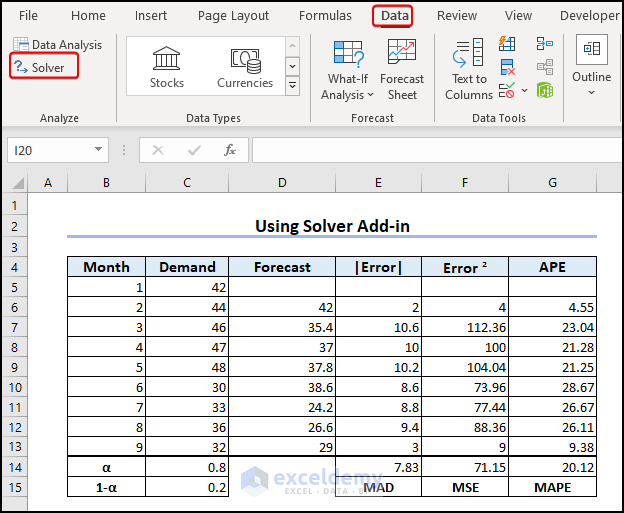
The first forecast value will be equal to the actual value. So, type the following formula in D6,
=C5Input the following formula in D7,
=$C$14*C6+$C$15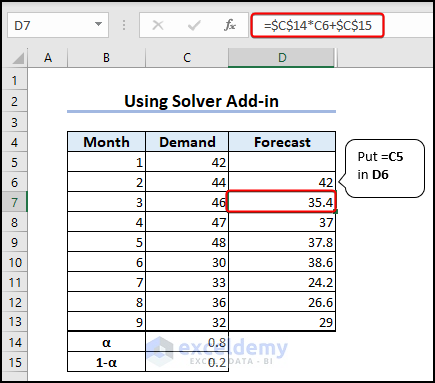
Write the ABS function in E6,
=ABS(C6-D6)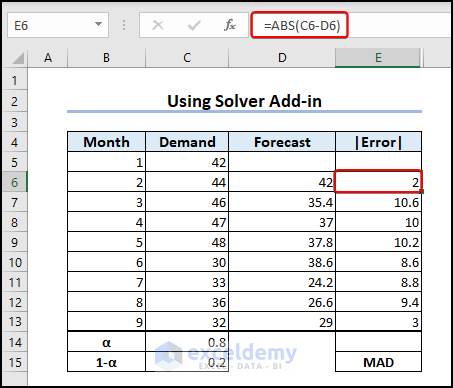
Type the basic formula in F6,
=E6^2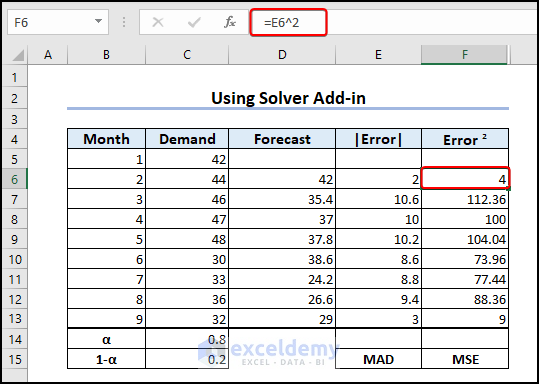
Type the following formula in G6 to find the Absolute Percent Errors.
=E6/C6*100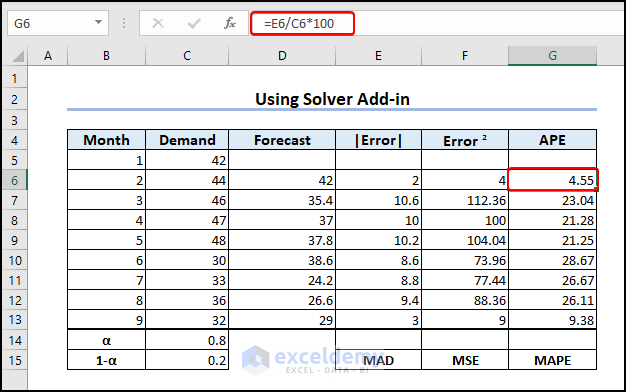
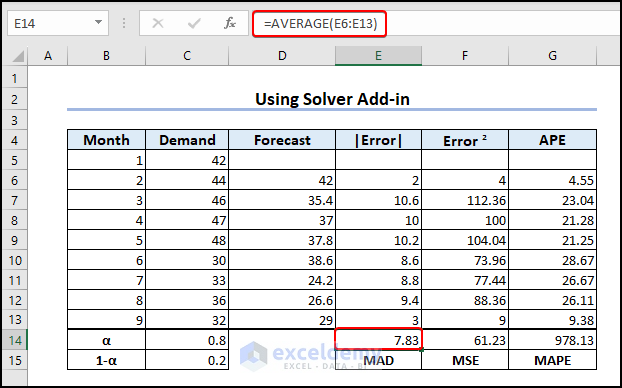
In E14, enter the following formula >> copy the cell by dragging it to G14.
=AVERAGE(E6:E13)Obtain the Mean Absolute Deviation, Mean Squared Error, and Mean Absolute Percent Error in E14, F14, and G14.
- Mean Absolute Deviation is the sum of Absolute Forecast Errors per n. Mean Square Error is the sum of the Square of absolute forecast per (n-1).
- The Mean Absolute Percentage Error (MAPE) is a statistical metric used to assess the accuracy of a forecasting method in terms of predictions.
Go to File >> Options.

Click Add-ins >> Go.
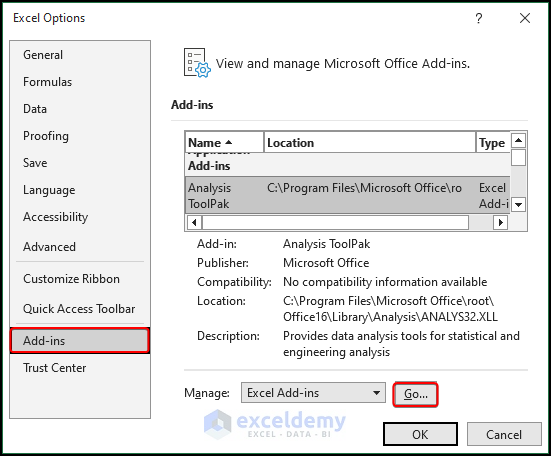
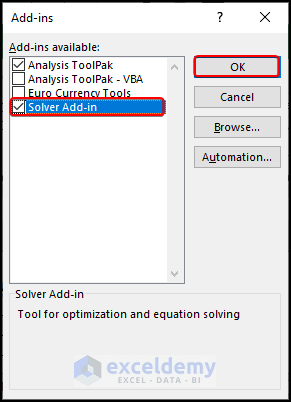
Tap on Solver Add-in in Add-ins dialog >> OK.
Add Solver Add-in. Go to Data tab >> Solver.
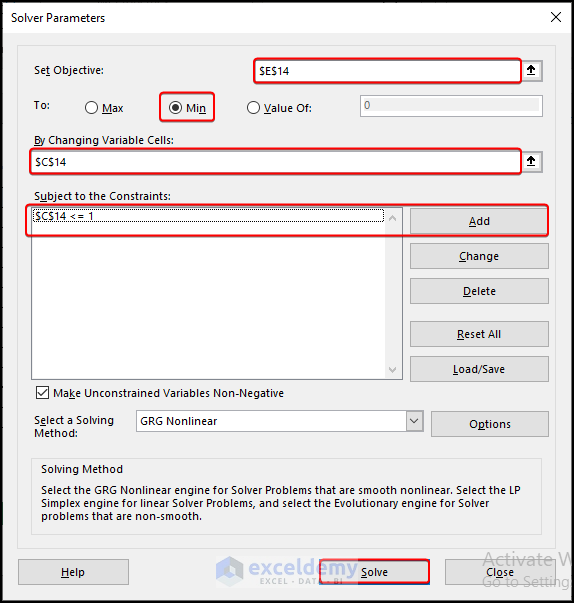
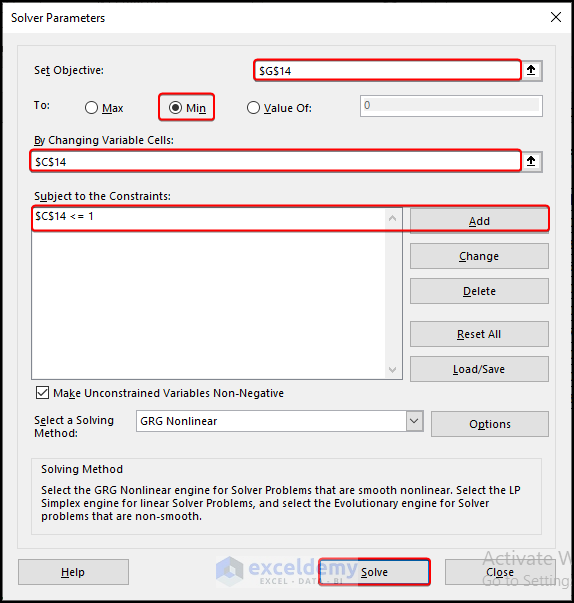
In Solver Parameters, put E14 as the value of MAD in Set Objective >> Check Min option >> put C14 in By Changing Variable Cells >> add C14 <=1 in Add box >> Solve.
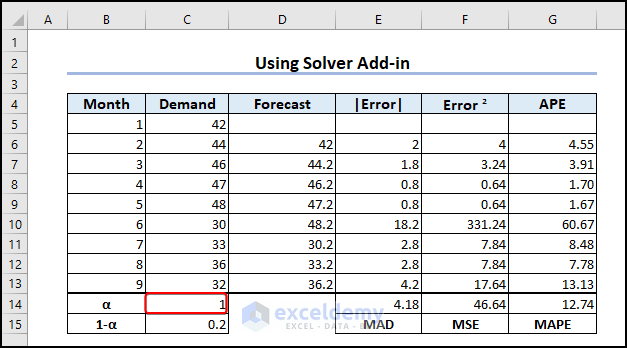
The value of alpha changes to 1 in C14. To get the smallest MAD possible, we should set the alpha to 1.
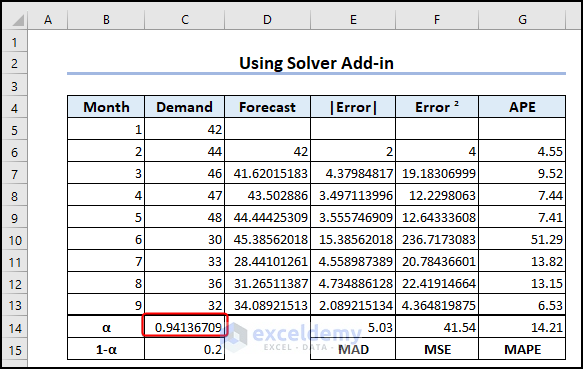
Put F14 as the value of MSE in Set Objective >> Check Min option >> put C14 in By Changing Variable Cells >> add C14 <=1 in Add box >> Solve.

Find the changes in C14. Therefore, we should set the alpha value to 0.94136709 to get the smallest value possible for MSE.
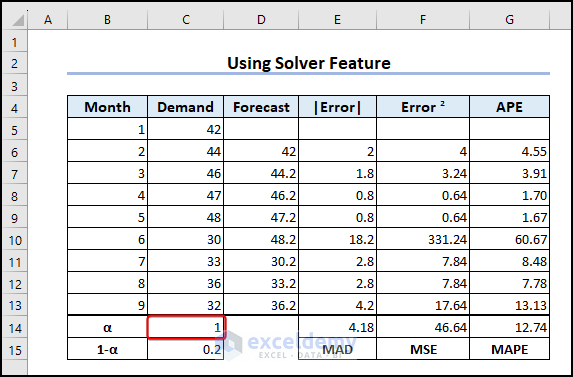
Click the Solver tool again, and in the Solver Parameters, put G14 in Set Objective >> check Min box >> C14 in By Changing Variable Cells >> tap Add and write C14 <= 1 >> Solve.
The value of alpha changes to 1. This shows, that to obtain the minimum value for MAPE, set the alpha value to 1.
Mean Absolute Percent Error gives all errors equal weightage, while Mean Square Error weights errors according to their squares.
How to Forecast with Exponential Smoothing in Excel
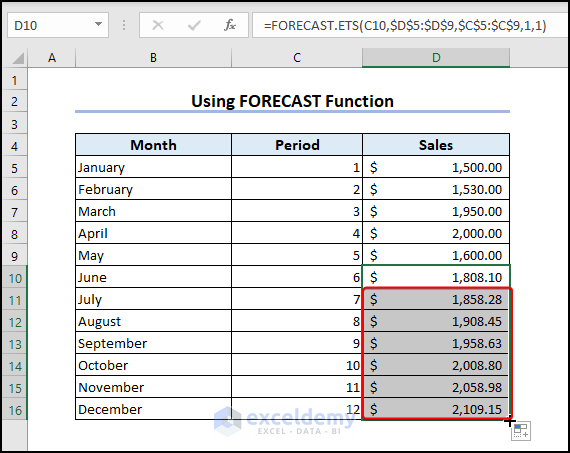
Method 1 – Applying FORECAST Function
To predict the sales value, type the following the FORECAST function in D10,
=FORECAST.ETS(C10,$D$5:$D$9,$C$5:$C$9,1,1)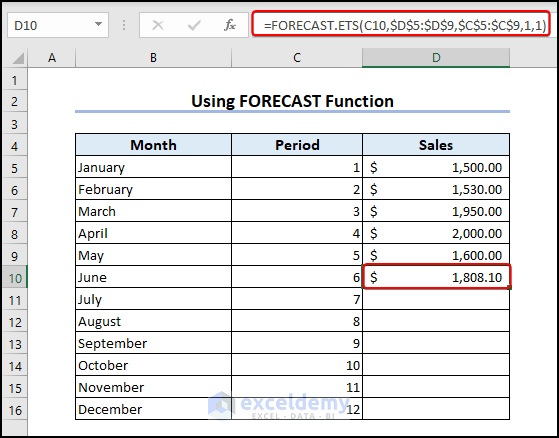
Drag the cell down to D16 to get the other forecasts.
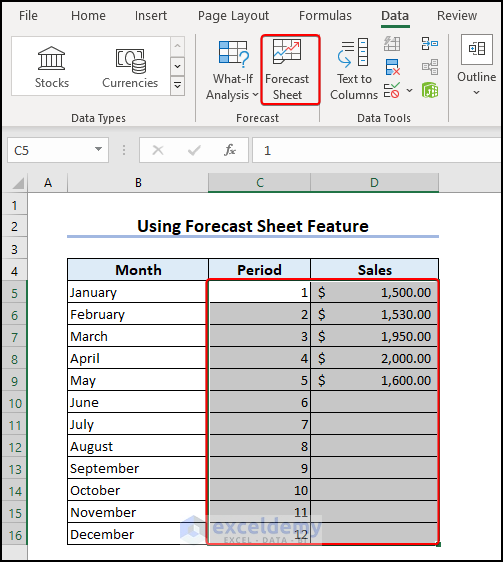
Method 2 – Using Forecast Sheet Feature
To use the Forecast Sheet feature, select the range of data table >> go to Data tab >> Forecast Sheet.
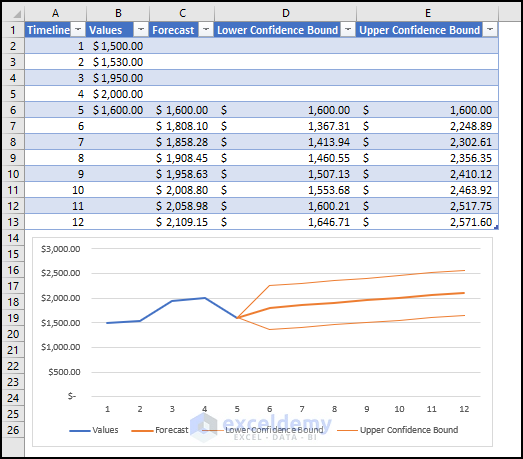
Put 12 in Forecast End >> Create.
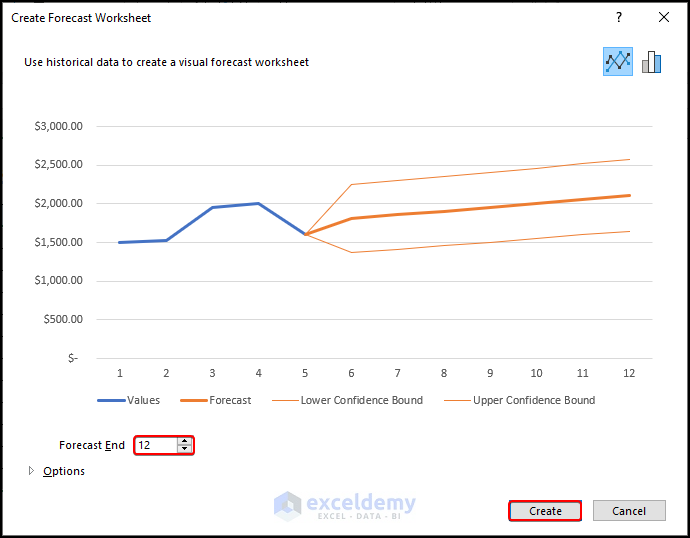
The predicted value appears with a forecast chart.
Things to Remember
- The damping factor is the subtraction of the Alpha value from 1.
- With the higher value of alpha, the curve fluctuates highly with data.
- When you take input data with headings, you have to tick the Label in the Exponential Smoothing.
Frequently Asked Questions
- In Simple Exponential Smoothing can we take alpha > 1? If not then why?
If alpha > 1 then 1-alpha < 0 and so the predicted value at time t has a negative impact on the predicted value at time t+1, which is counter-intuitive.
- Can I get a negative result in the forecast by using Holts linear method?
It depends on the data values, but yes. You can obtain a negative result.
Download Practice Workbook
You can download the practice workbook from here:
Exponential Smoothing in Excel: Knowledge Hub
- How to Calculate Trend Adjusted Exponential Smoothing in Excel
- Perform Holt-Winters Exponential Smoothing in Excel
- How to Smooth Data in Excel
- How to Remove Noise from Data in Excel
<< Go Back to Solver in Excel | Learn Excel
Get FREE Advanced Excel Exercises with Solutions!
