Method 1 – Using the Moving Average to Remove Noise from Data
Steps:
- Enter the following formula into the cells of the D Column:
=AVERAGE(C4:C8)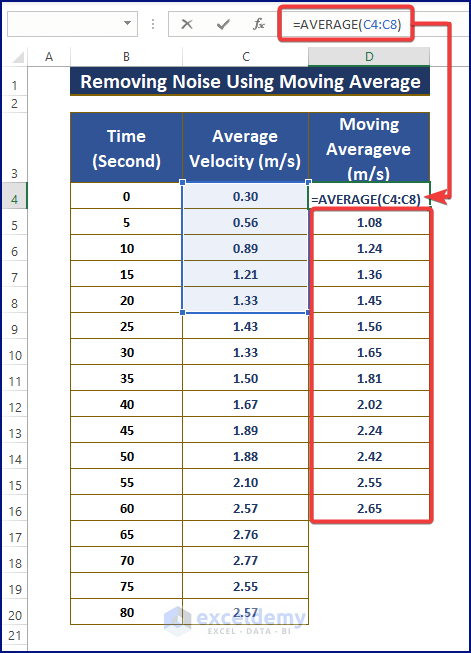
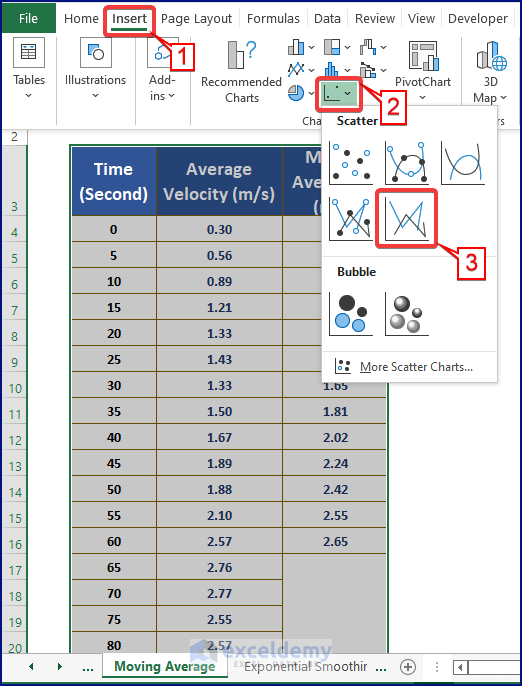
- Highlight all three columns.
- Go to the Insert tab.
- Choose a Scatter Chart type.
- Excel inserts a Scatter Chart, as shown in the below picture.
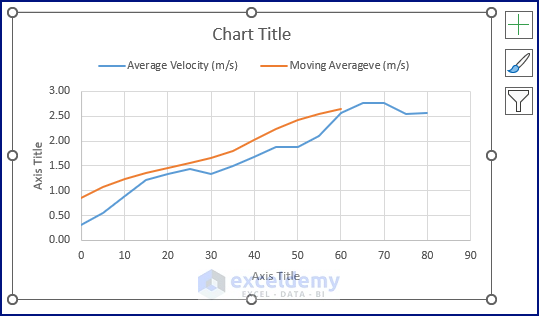
- Furnish the chart according to your taste, as depicted below.
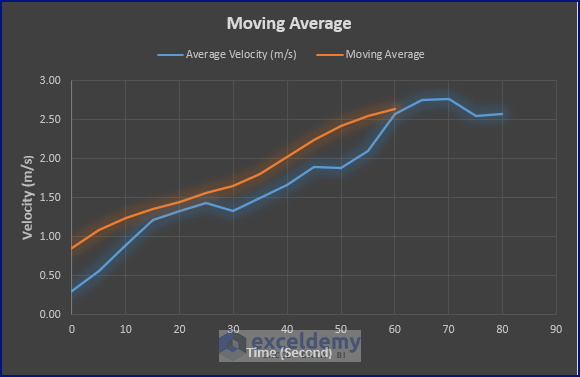
The above picture shows the smoothing of noisy data. As the moving average takes the following couple of entries (i.e., 3, 5, or 7) to create a smooth entry, the Moving Average curve doesn’t have the last couple of values. This shortcoming can be overcome using Trendline insertion or Data Analysis Tools.
Trendline Insertion
If we don’t want to use the AVERAGE function or want automatic smoothing of an inserted curve,
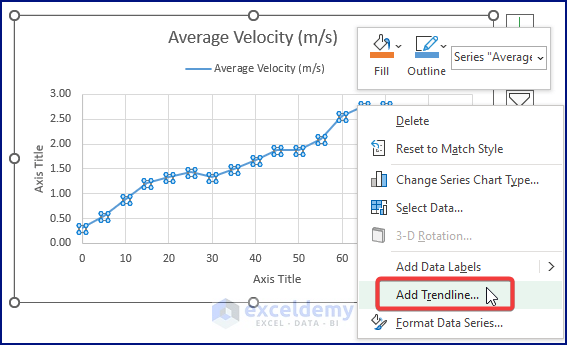
- Right-click on the raw data scatters curve. The Context Menu appears.
- Select Add Trendline.
- Excel pops up the Format Trendline side window.
- Mark Moving Average under Trendline Options.
- Enter 5 in the Period command box.
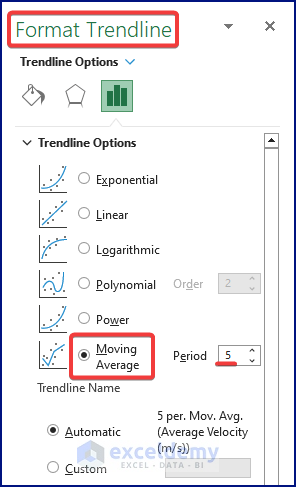
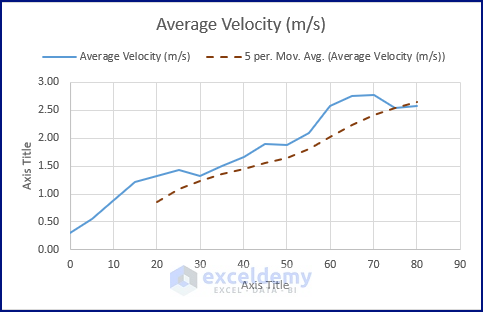
- The Moving Average Trendline gets inserted.
Moving Average – Data Analysis Tools
Users can use the Moving Average Tools in Data Analysis if they want all the smoothened data.
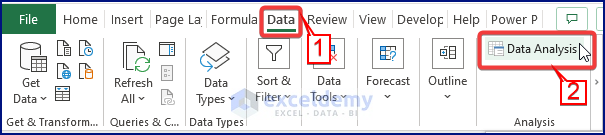
- Move to the Data tab.
- Click Data Analysis.
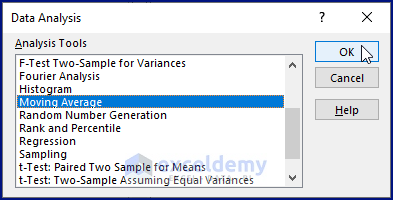
- The Data Analysis dialog box appears.
- Select Moving Average under Analysis Tools.
- Click OK.
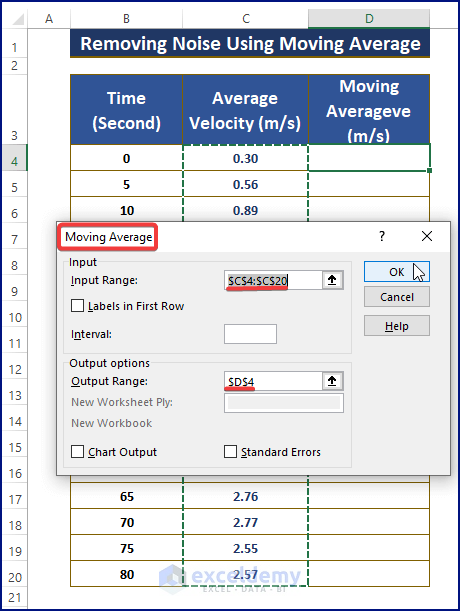
- Clicking OK fetches the Moving Average dialog box.
- Assign Input (i.e., C4:C20) and Output (i.e., D4) Ranges.
- Click OK.
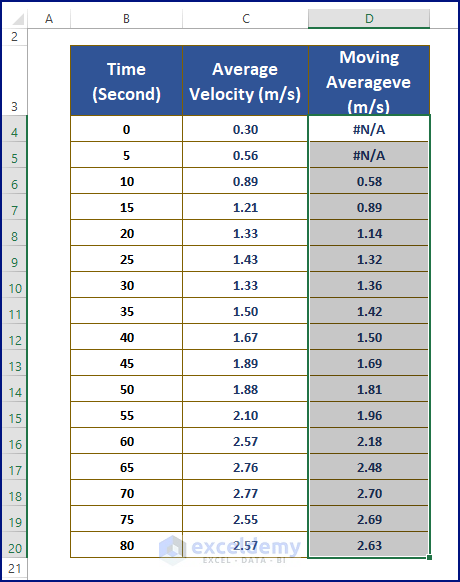
- Excel inserts all the moving average values, removing noise.
Method 2 – Fetching Smoothed Data Using Exponential Smoothing
Steps:
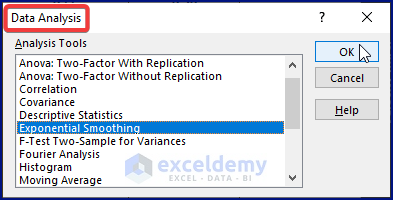
- Go to Data > Data Analysis. Excel displays the Data Analysis.
- Choose Exponential Smoothing under Analysis Tools.
- Click OK.
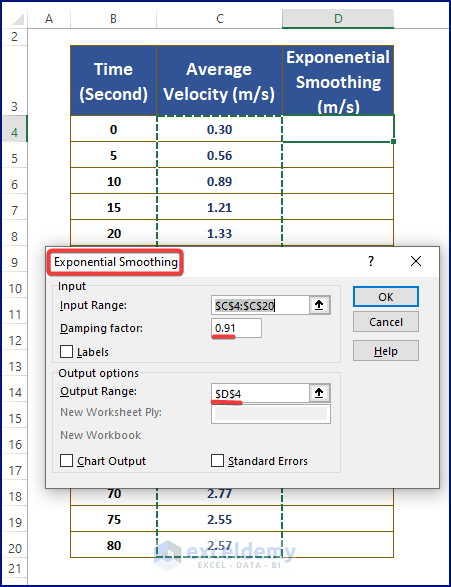
- Upon Excel fetching the Exponential Smoothing dialog box, assign the Input (i.e., C4:C20), Output (i.e., D4) Ranges and Damping Factor (i.e., 0.91).
- Click OK.
- Excel stacks the smoothed data in the D column. Highlight all three columns.
- Move to the Insert tab.
- Select a Scatter Chart.
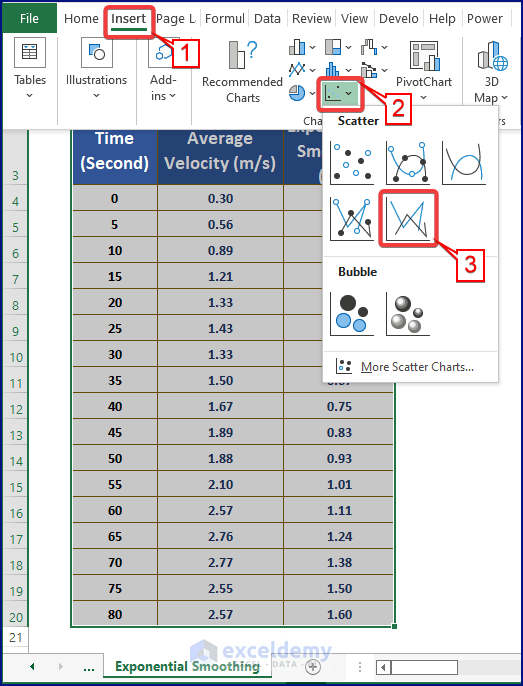
- Excel inserts a scatter chart containing noisy and smoothed data.
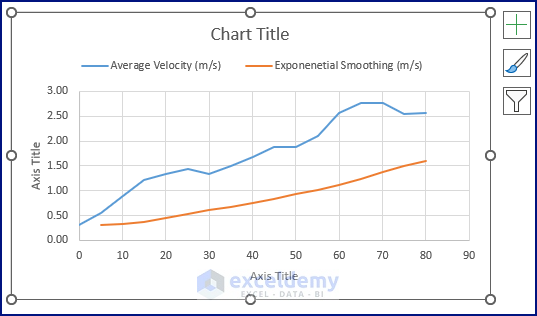
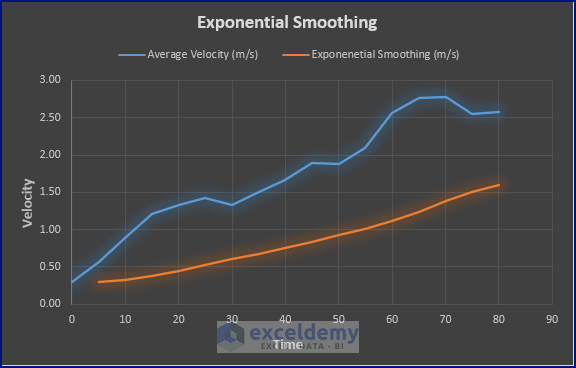
- Modify the Chart, and you’ll get a depiction like the picture below.
Things to Keep in Mind
- The moving average method has alternatives, as smoothed data can be achieved using Formulas or Data Analysis Tools.
- Signal processing or smoothing signals is similar to removing noise from data if signals contain numeric values.
- The trendline of exponential smoothing returns the same curve as that of data analysis- Exponential smoothing in the chart.
Download the Excel Workbook
Related Articles
- How to Calculate Trend Adjusted Exponential Smoothing in Excel
- How to Smooth Data in Excel
- Perform Holt-Winters Exponential Smoothing in Excel
<< Go Back to Exponential Smoothing in Excel | Solver in Excel | Learn Excel
Get FREE Advanced Excel Exercises with Solutions!

hi,
what is the consideration to put 0.91 as Damping Factor?
Hi BAGUS,
In the context of Exponential Smoothing in Excel’s Data Analysis Toolpak, the Damping Factor refers to a parameter used to control the impact of older observations on the forecasted values.
The damping factor has a value between 0 and 1. It determines the weight assigned to the most recent observation when calculating the forecast. A higher value (closer to 1) gives more weight to the most recent data point, making the forecast more responsive to recent changes in the data. On the other hand, a lower value (closer to 0) gives less weight to the most recent data point, making the forecast more stable and less responsive to short-term fluctuations.
The value of Damping Factor being 0.91 suggests relatively high importance to the most recent data while still considering some historical data. The choice of 0.91 is somewhat arbitrary and depends on the specific characteristics of the data and the desired balance between responsiveness and stability in the forecast. Different values of the damping factor may be chosen based on the analyst’s judgment and the nature of the data being analyzed.
To determine the most appropriate value for the Damping Factor, it’s often a good practice to experiment with different values and evaluate the forecast accuracy using techniques like Mean Absolute Error (MAE) or Mean Squared Error (MSE). The choice of Damping Factor should ideally be data-driven and selected based on how well it performs in forecasting historical data or predicting future values.
Regards
Rafiul Hasan
Team ExcelDemy