Where to Find Exponential Smoothing in Excel?
To access the exponential smoothing tool, we need to enable the Data Analysis tab on the Excel ribbon.
STEPS:
- Go to the File tab from the ribbon.
- Click on the Options menu.

- The Excel Options dialog box will appear.
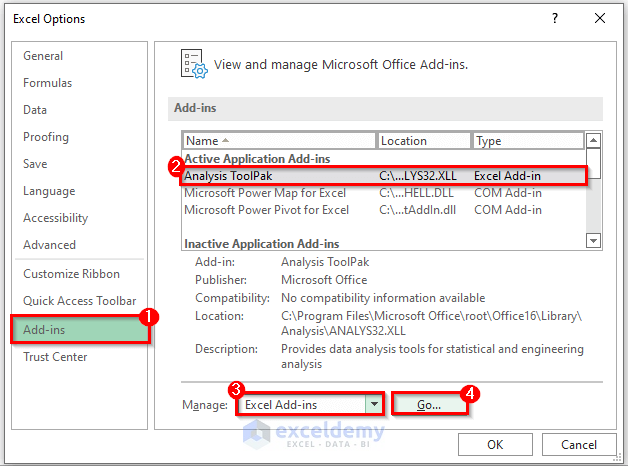
- Go to Add-ins and select Analysis ToolPak in the Add-ins group.
- Choose the Excel Add-ins option from the Manage drop-down menu.
- Click on the Go button.
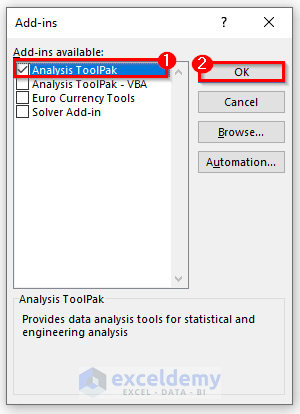
- The Add-ins dialog box will show up.
- Check the box Analysis ToolPak.
- Click on OK to complete the procedure.
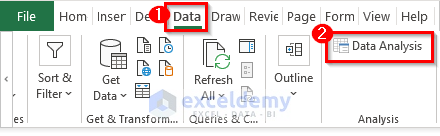
- When you go to the Excel ribbon and go to the Data tab, you will see the Data Analysis feature.
Calculate Trend-Adjusted Exponential Smoothing in Excel: Step-by-Step Procedures
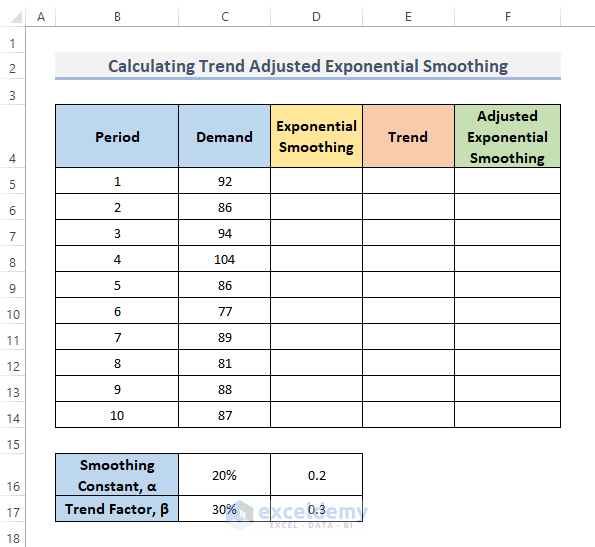
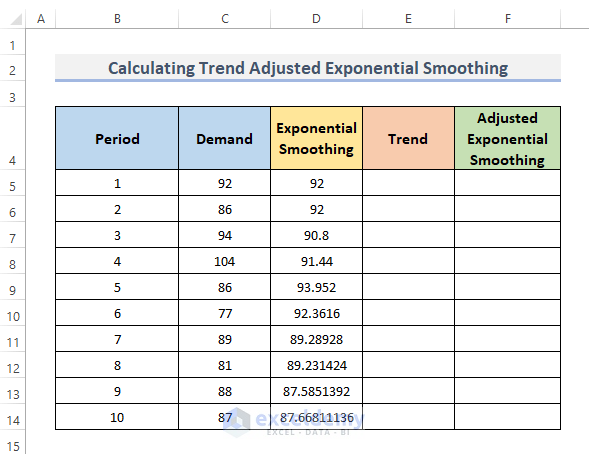
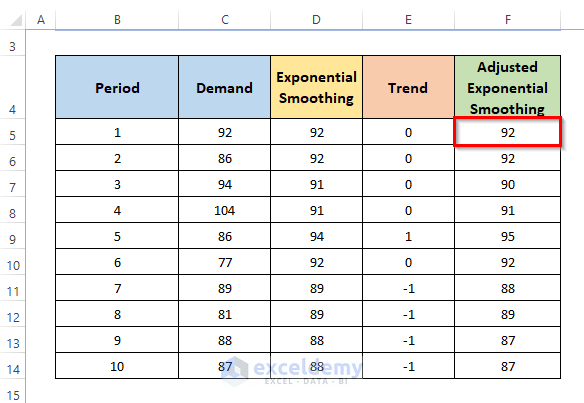
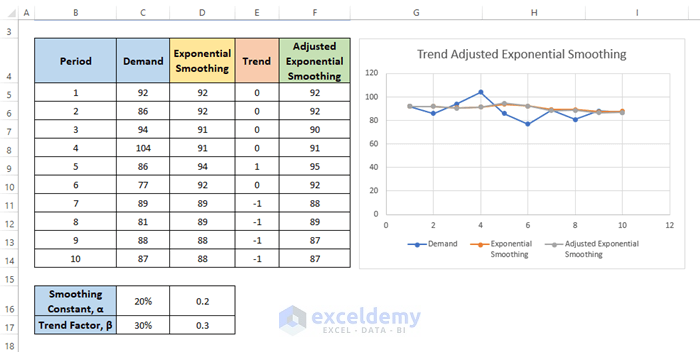
Step 1 – Insert the Dataset in Excel
- Put the periods in column B. We insert 10 periods of time to compute the exponential smoothing.
- Insert the demand for each period.
- Input the Smoothing Constant which is Alpha (α). In our case, the Alpha value is 20% or .2.
- Put the Trend Factor which is Beta (β). In this instance, the Beta value is 30%, or .3.
Step 2 – Calculate the Exponential Smoothing Forecast
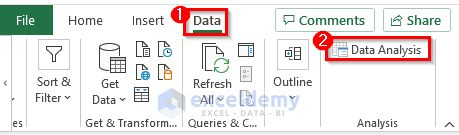
- Go to the Data tab from the ribbon.
- Click on the Data Analysis feature under the Analysis category.
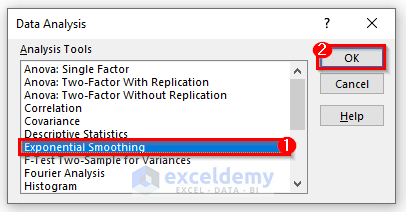
- This will display the Data Analysis dialog box.
- Select Exponential Smoothing.
- Click OK.
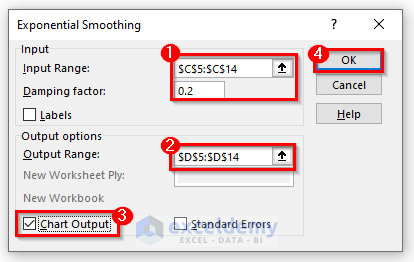
- The Exponential Smoothing dialog will open up.
- Place the Input Range and Damping factor in the Input part. In our case, we take the range of Demand ($C$5:$C$14) and put .2 as our damping factor.
- Place the Output Range in Output options where we want to see the result of our exponential smoothing.
- If you wish to see the output in a chart also, check the box Chart Output.
- Click on the OK button to finish the strategy.
- The Exponential Smoothing result is shown in the selected output range and the chart is visible.
- However, there is a problem with using this as the first-period exponential smoothing shows the #N/A error. While calculating the trend, we will get a #N/A error in all the trend values.
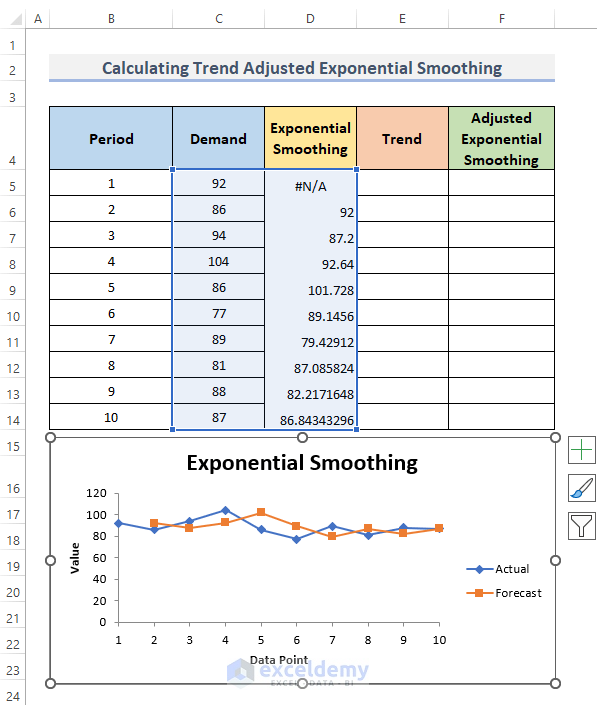
Accordingly, it’s better to use the formula of exponential smoothing. But there is also a slight issue in that we didn’t get the accurate result of exponential smoothing, but the result will be quite similar to the accurate one. Let’s look at the instruction to calculate exponential smoothing with a formula.
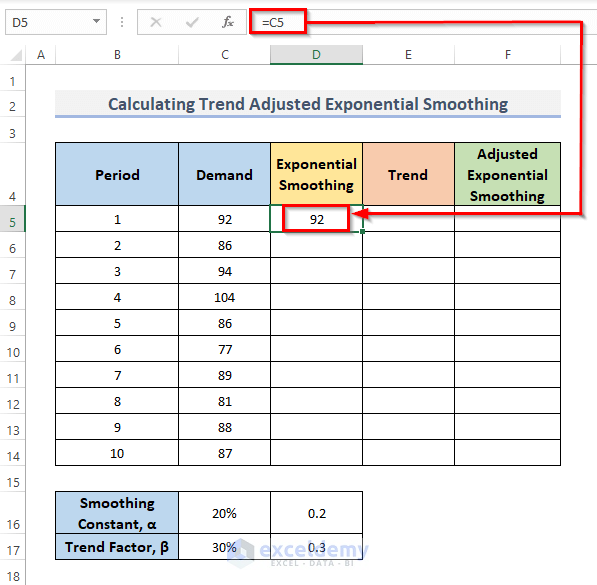
- Select the cell D5 and put the simple formula into that cell.
=C5- Press Enter.
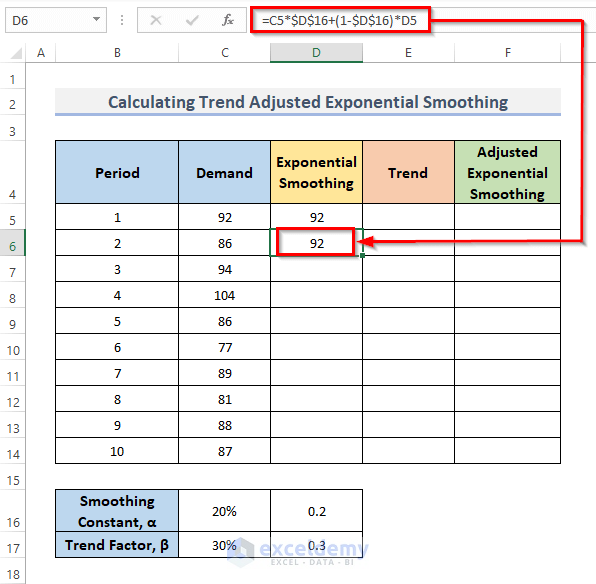
- Select the second cell D6 and put the formula into that selected cell.
=C5*$D$16+(1-$D$16)*D5- Hit the Enter key to complete the process.
- Drag the Fill Handle down to duplicate the formula over the range or double-click on the plus (+) symbol.
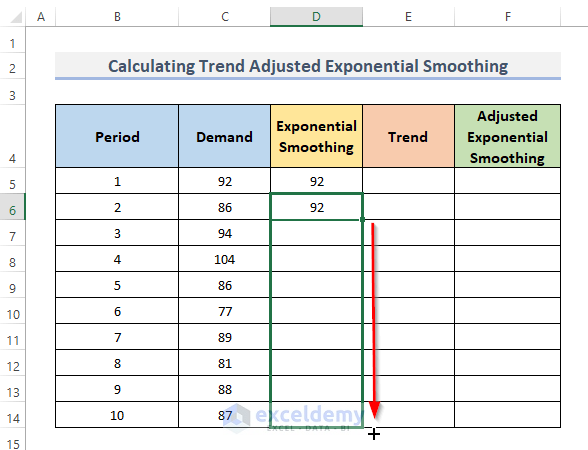
- You can see the result of Exponential Smoothing.
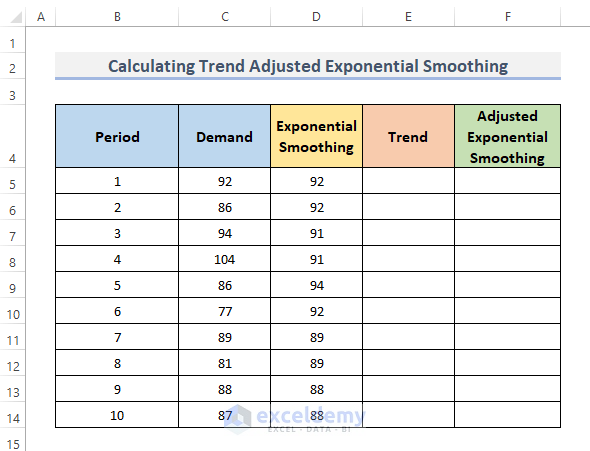
- We want to decrease the decimals. For this, go to the Home tab on the ribbon.
- Click on Decrease Decimal on the Number group.
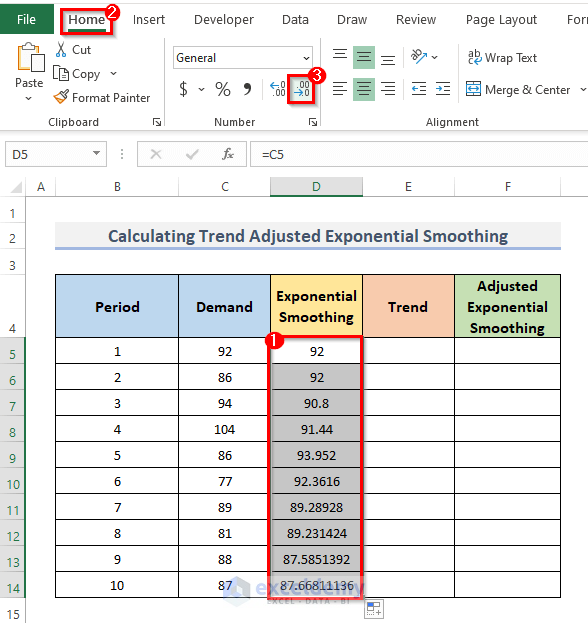
- We can see the exponential smoothing result.
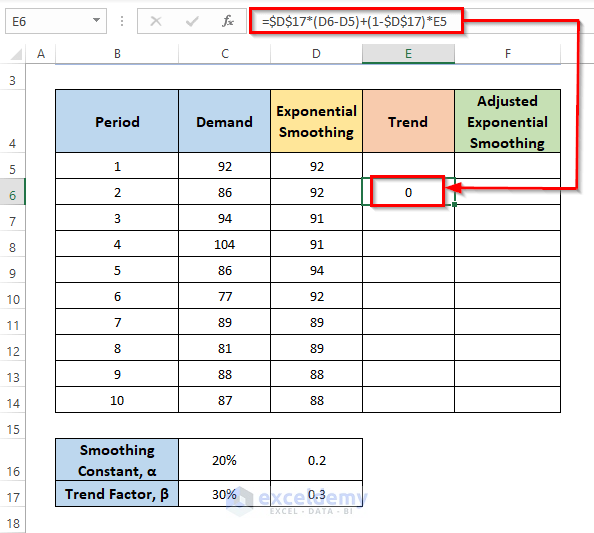
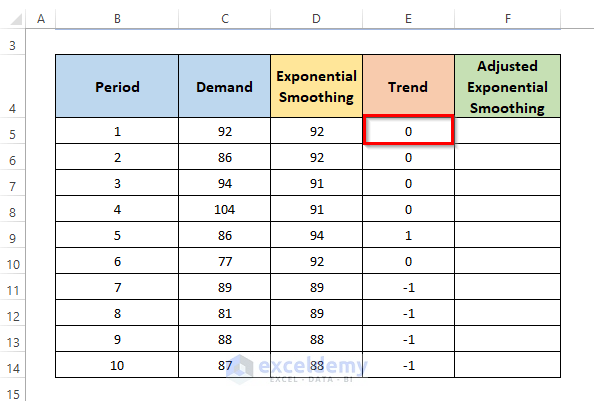
Step 3 – Compute the Trend
- Select cell E6 and insert this formula to calculate the trend in that cell:
=$D$17*(D6-D5)+(1-$D$17)*E5- Hit the Enter key.
- The result will now display in the selected cell, along with the formula in the formula bar.
- Drag the Fill Handle down or double-click on the plus (+) sign to AutoFill the range.
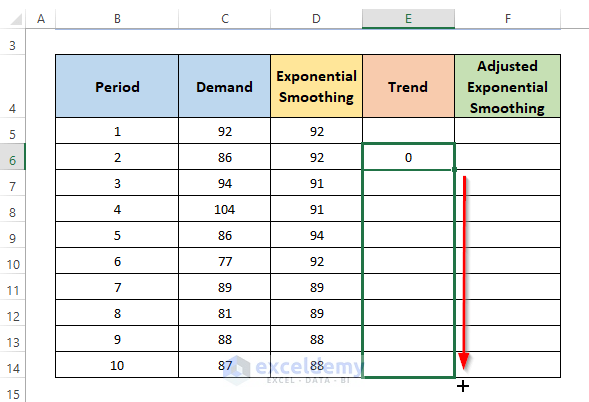
- We put 0 in the first-period trend. Other periods’ trend is shown by using the formula.
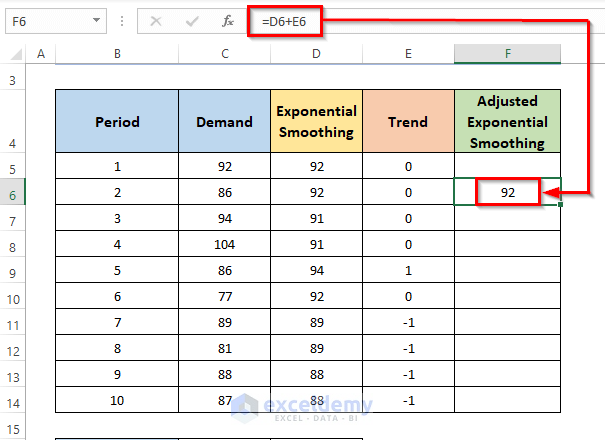
Step 4 – Find the Adjusted Exponential Smoothing
- Select the cell where you want to see the result. We kept the first-period adjusted exponential smoothing cell blank. So, we select the second-period cell.
- Put this formula into cell F6.
=D6+E6- Press the Enter key.
- You will be able to see the result in the selected cell and the formula will appear in the formula bar.
- Further, to copy the formula over the range, drag the Fill Handle down. Alternatively, double-click on the plus (+) sign to AutoFill the range.
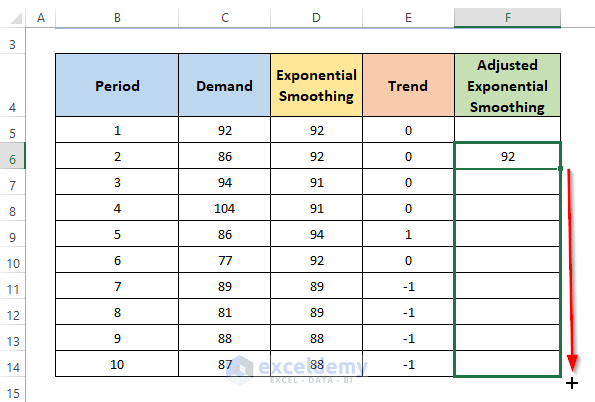
- Put the number as the same as the demand and exponential smoothing in our first period of adjusted exponential smoothing.
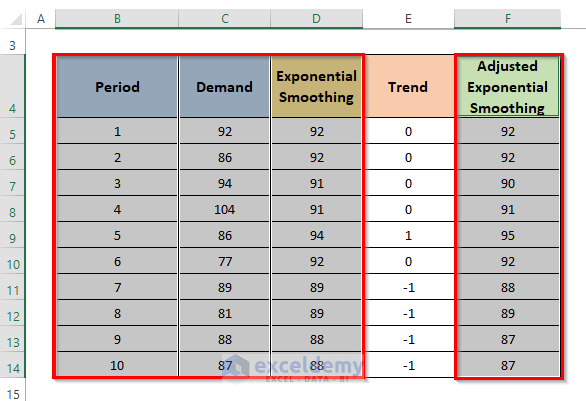
Step 5 – Insert a Chart
- Select the data for the chart. We selected the Period, Demand, Exponential Smoothing, and Adjusted Exponential Smoothing.
- Go to the Insert tab from the ribbon.
- Click on Insert Scatter (X, Y) or Bubble Chart drop-down menu under the Charts group.
- Choose Scatter with Straight Lines and Markers, which is the second-row first option of the Scatter.
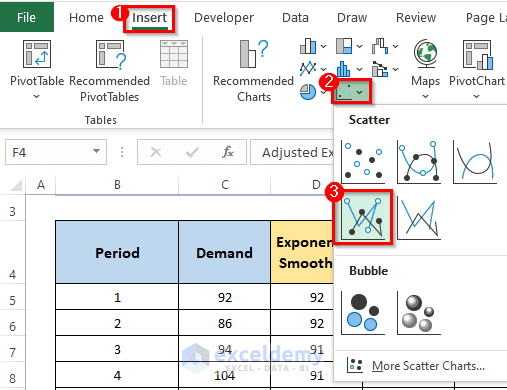
- This will create the chart to visualize the calculation of trend-adjusted exponential smoothing more often.
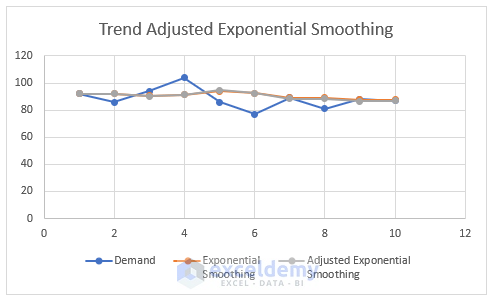
Final Output of Trend-Adjusted Exponential Smoothing
Things to Keep in Mind
- Peaks and dips in the information are rounded out as the dumping factor increases in value.
- Excel Exponential Smoothing is a really adaptable and simple-to-calculate approach.
- The damping factor is greater; the Alpha value is less. As a consequence, the peaks and dips are rounded off most.
- The damping factor is less and the Alpha value is larger. The smoothing results are hence more similar to the real sample points.
Download the Practice Workbook
Related Articles
- How to Remove Noise from Data in Excel
- How to Smooth Data in Excel
- Perform Holt-Winters Exponential Smoothing in Excel
<< Go Back to Exponential Smoothing in Excel | Solver in Excel | Learn Excel
Get FREE Advanced Excel Exercises with Solutions!
