This is an overview:
Download Practice Workbook
Download the practice workbook.
The Data Analysis Toolpak in Excel
The Analysis Toolpak is an Excel add-in that provides analysis features:
- Complex statistical analysis, such as forecasting and data mining.
- Regression analysis tools.
- Trends.
Functions Available in the Excel Data Analysis ToolPak
| Function | Function Description |
|---|---|
| Anova Analysis Tool | Perform variance analysis. |
| ANOVA: Single Factor | Performs basic variance analysis on two or more data samples. If you have two samples, use the T.TEST. For more samples, use the Single Factor Anova. |
| ANOVA: Two Factors | Helps sort data into two categories. |
| Correlation Analysis Tool | Is useful for two measurement variables for each of the N subjects. It gives an output table, a correlation matrix, showing CORREL (or PEARSON) values for each variable pair. The correlation coefficient measures how the two variables vary. It’s scaled, unlike covariance. |
| Covariance Analysis Tool | Calculates COVARIANCE.P for every variable pair. If there are only two variables (N=2), you can use COVARIANCE.P. The diagonal entry in the output table for row i, column i is the covariance of the i-th variable with itself. |
| Descriptive Statistics Analysis Tool | Creates a report with single-variable stats for the input data. It shows the central tendency and data spread. |
| Exponential Smoothing Analysis Tool | Predicts using the prior forecast adjusted for its error. It employs the smoothing constant a to decide how errors affect the forecast. |
| F-Test Two-Sample for Variances Analysis Tool | Compares two population variances. It calculates an F-statistic value f. |
| Fourier Analysis Tool | Uses Fast Fourier Transform (FFT) to solve linear system issues and analyze periodic data. It transforms and inversely transforms data, supporting reversibility. |
| Histogram Analysis Tool | Finds frequencies for data and bins. It counts occurrences of values in a dataset. |
| Moving Average Analysis Tool | Predicts future values using the average of past periods. It reveals trends that a simple overall average wouldn’t show. |
| Random Number Generation Analysis Tool | Populates a range with random numbers from different distributions. You can describe populations using distributions, like using normal distribution for heights or Bernoulli distribution for coin flips. |
| Rank and Percentile Analysis Tool | Produces a table that contains the ordinal and percentage rank of each value in a dataset. |
| Regression Analysis Tool | Performs linear regression with the least squares method to fit a line through observations. It shows how a dependent variable changes with independent variables. |
| Sampling Analysis Tool | Creates a smaller group from a population, treating the input range as the whole. For big populations, use a sample. You can also pick values from a specific part of a cycle. |
| Two-Sample t-Test Analysis Tool | Checks if population Means are equal in both samples. They have different assumptions: equal variances, unequal variances, and before-after treatment observations on the same subjects. |
| Two-Sample z-Test Analysis Tool | Performs a z-Test for means when variances are known. It checks if two population means are different based on the hypothesis. If variances aren’t known, use the Z.TEST function. |
How to Install the Analysis ToolPak Add-in in Excel
- Go to File tab >> Options.
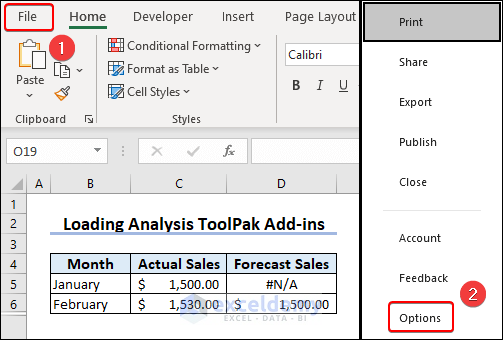
- In Excel Options, click Add-ins >> Go.
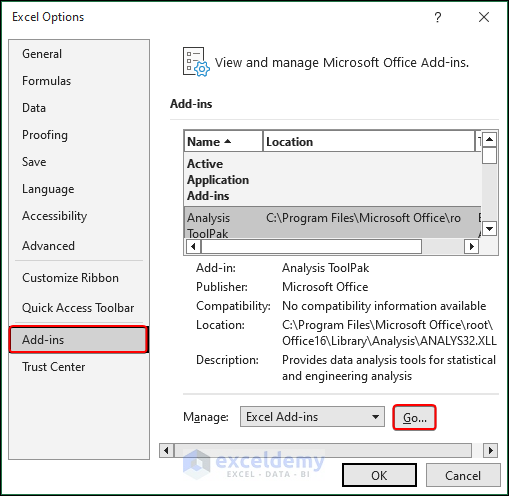
- Check Analysis ToolPak>> OK.
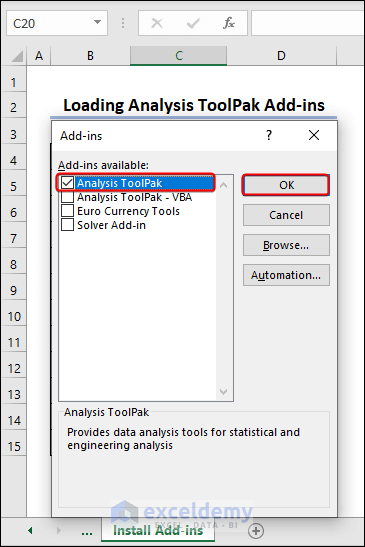
- The Data Analysis tool is displayed in Analysis (Data tab).
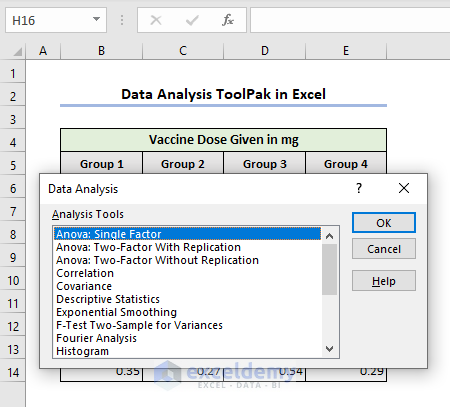
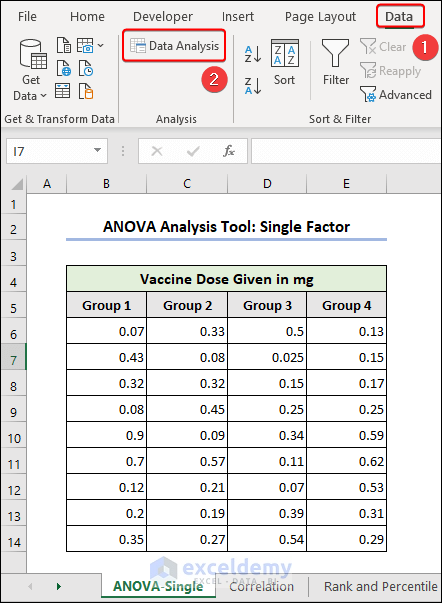
Example 1 – Performing a Single Factor Anova Analysis
The dataset showcases 4 groups of children divided by age. The groups are populated with weekly vaccine doses. To test the null hypothesis:
- Go to Data tab >> click Data Analysis.
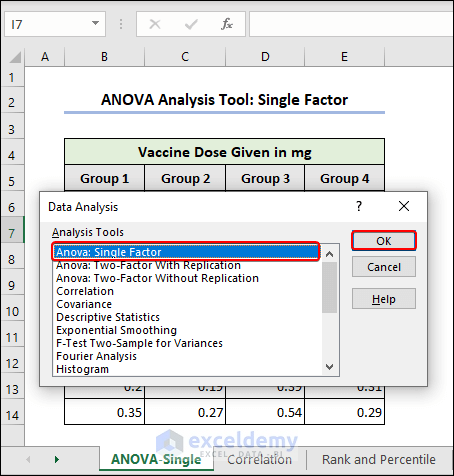
- Click Anova: Single Factor in Data Analysis >> OK.
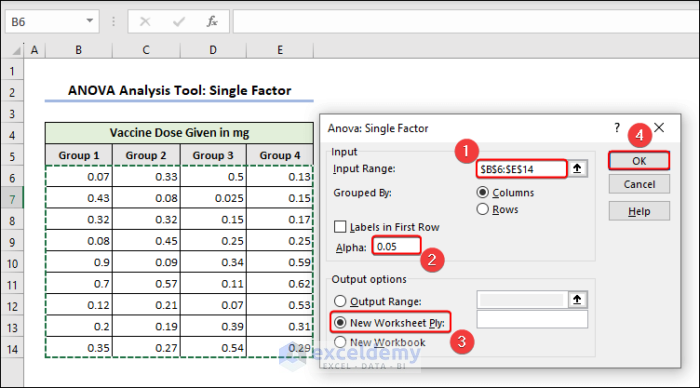
- In the Anova: Single Factor dialog box, enter B4:E14 in Input Range.
- Enter 5 in Alpha.
- Choose New Worksheet Ply in Output options.
- Click OK.
The Anova: Single Factor data analysis output is displayed in a new sheet.
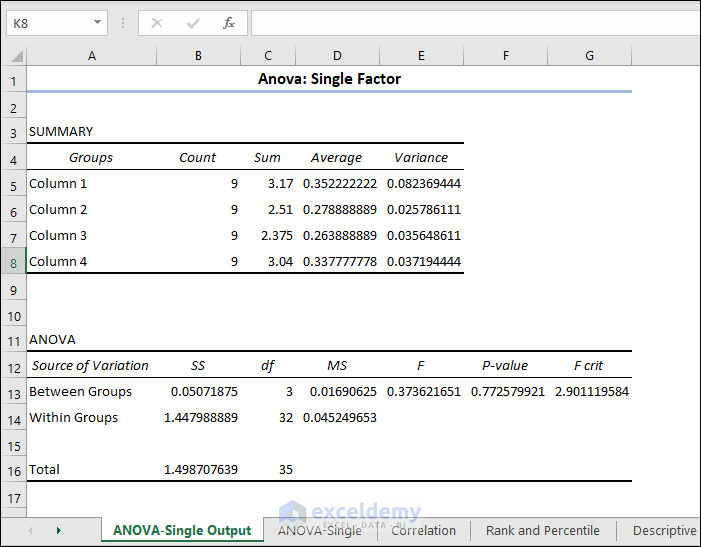
The larger the F-statistic value, the more likely the groups have different means, rejecting the null hypothesis. Here, the F-value is greater than the critical value F crit: it rejects the null hypothesis. There is a significant difference between groups.
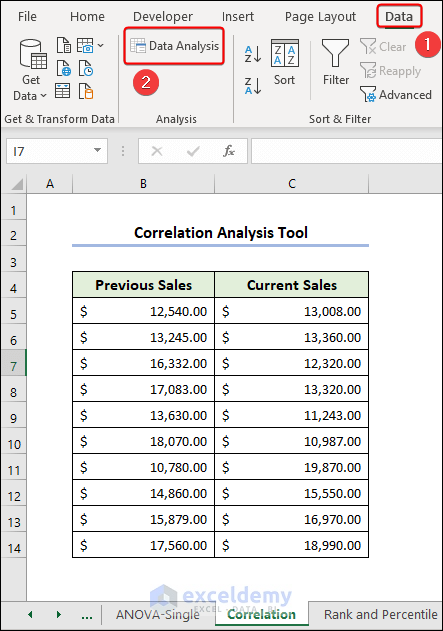
Example 2 – Using the Correlation Analysis Tool
The sample dataset showcases sales values in different years.
- Go to Data tab >> click Data Analysis.
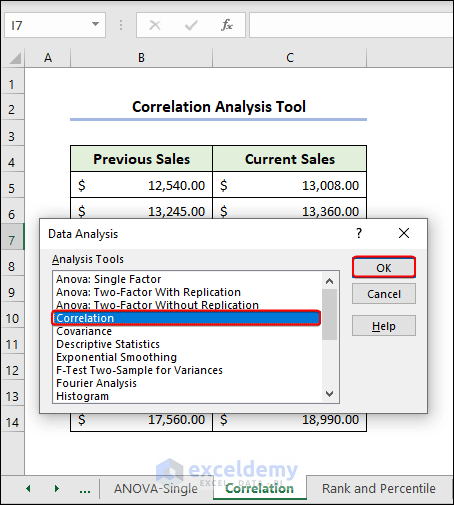
- Click Correlation in Data Analysis >> OK.
- In Correlation, enter B4:C14 in Input Range >> check Labels in First Row >> OK.
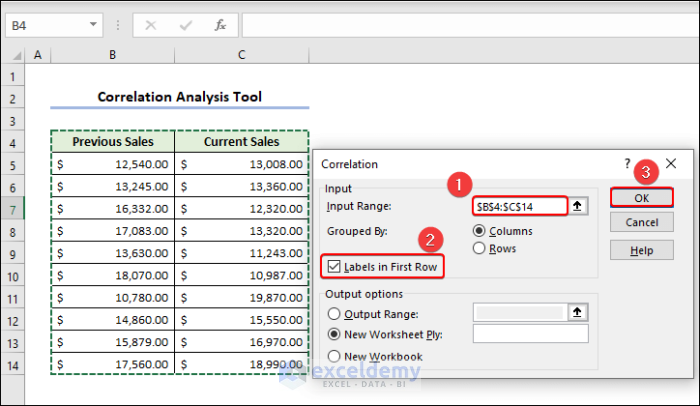
The correlation data analysis output is displayed.
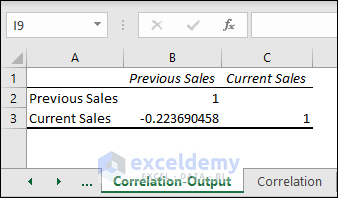
The correlation between previous sales and current sales is approximately -0.22369, indicating they have a negative correlation and a 22% extent.
Example 3 – Using the Rank and Percentile Analysis Tool
The following dataset represents students’ marks. To find the ranks and percentiles of each student:
- Go to the Data tab >> Data Analysis >> Rank and Percentile in Data Analysis >> OK.
![]()
- Enter C4:C14 in Input Range >> check Labels in First Row >> New Worksheet Ply >> OK.
![]()
The Rank and Percentile data is displayed in a new sheet.
![]()
Example 4 – Using the Descriptive Statistics Analysis Tool
The Descriptive Statistics includes the following parameters:
Mean, Median, Mode, Range, Variance, Standard Deviation, Skewness, and Kurtosis. The Kurtosis indicates the distribution’s level of peakedness or flatness.
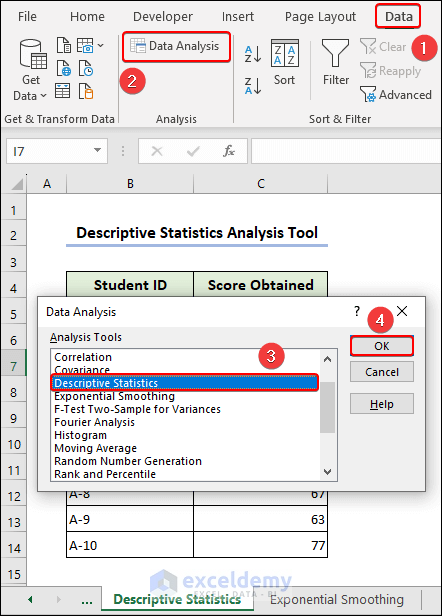
- Go to Data >> Data Analysis >> Descriptive Statistics in Data Analysis >> OK.
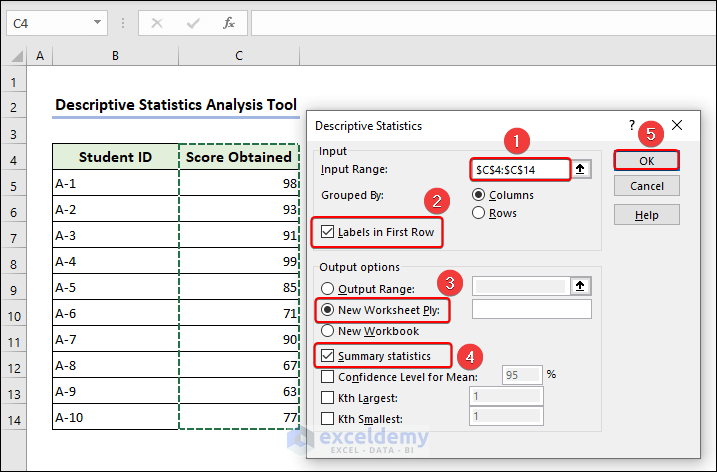
- Enter C4:C14 in Input Range >> check Labels in First Row >> New Worksheet Ply >> Summary statistics >> OK.
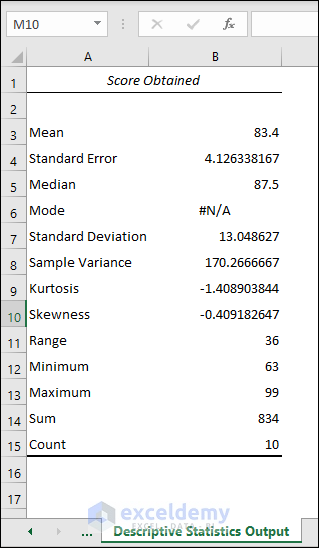
The output is displayed in a new sheet.
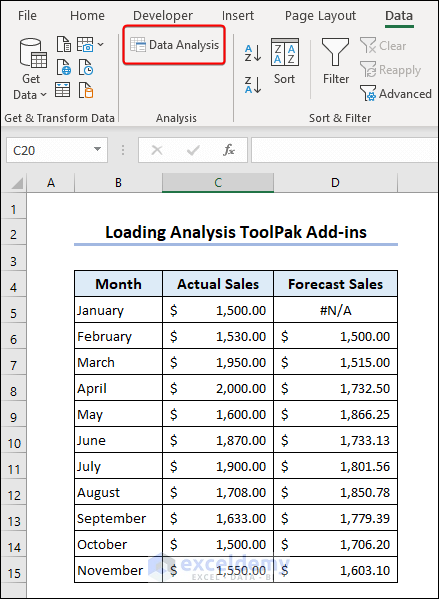
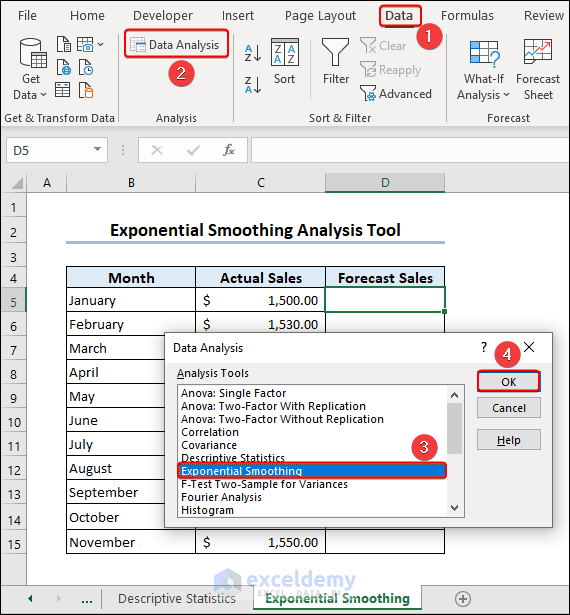
Example 5 – Using the Exponential Smoothing Analysis Tool
Consider a damping factor of 0.5:
- Go to Data >> Data Analysis >> Exponential Smoothing >> OK.
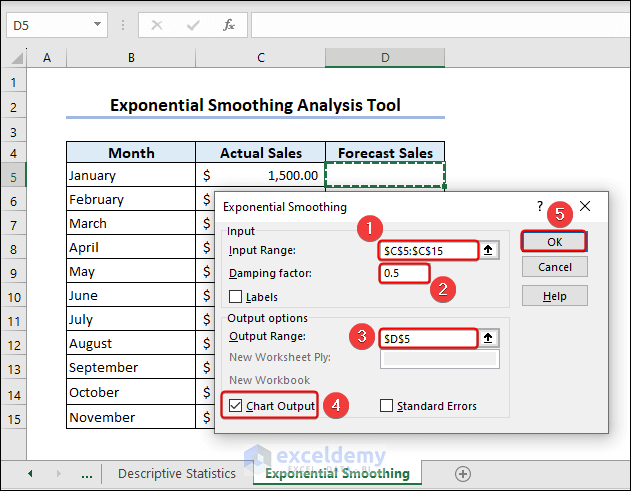
- In Exponential Smoothing, enter C5:C15 in Input Range >> 0.5 in Damping Factor >> D5 in Output Range >> check Chart Output >> OK.
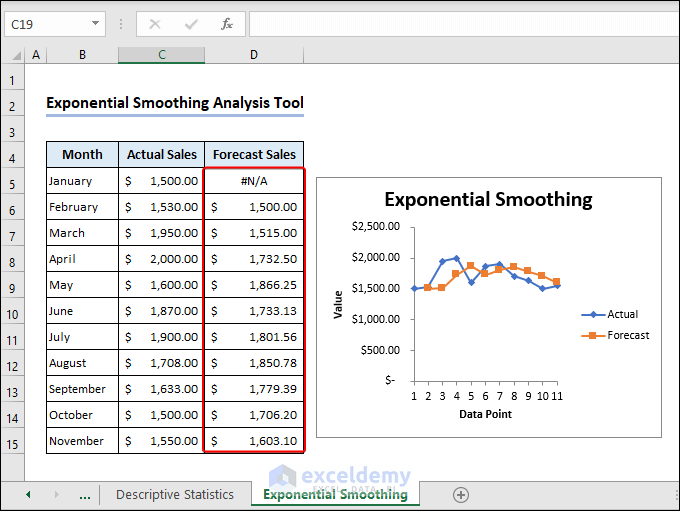
The forecast sales are displayed with an output chart.
The Excel Analysis is Displayed in Another Language
- Close all Microsoft Office applications.
- Click Start >> All Programs >> Install Applications.
- In the Software Center window, click Available Software.
- If Office 2013 is installed, click Excel Solver Language fix for Office 2013 SP1 >> Excel Solver Fix >> Office 2013.
- If Office 2016 is installed, click Excel Solver Language fix for Office 2016 >> Excel Solver Fix >> Office 2016.
- Click Install.
Things to Remember
- Data analysis functions work on one worksheet at a time.
Frequently Asked Questions
1. Does Kurtosis in Descriptive Statistics measure tails only?
Yes, kurtosis measures the shape of a probability distribution, indicating how it differs from a normal distribution, especially concerning the tails.
2. Are there limitations to ToolPak’s capabilities?
Yes, some advanced or specialized analyses require dedicated statistical software.
3. Do I need a strong statistical background to use ToolPak?
While a basic understanding of statistics is helpful, ToolPak provides user-friendly interfaces.
Data Analysis ToolPak in Excel: Knowledge Hub
<< Go Back to Solver in Excel | Learn Excel
Get FREE Advanced Excel Exercises with Solutions!
