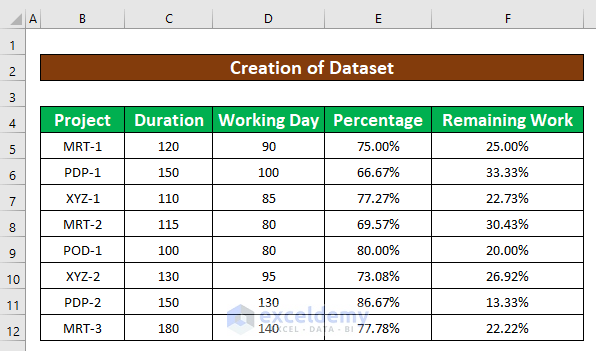
The sample dataset contains information on different projects.
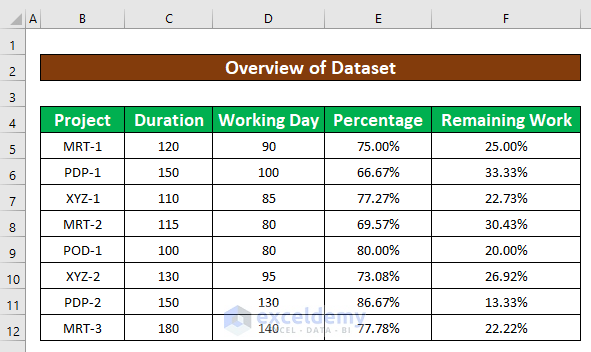
Step 1 – Create a Dataset
Calculate the percentage of work on the projects. The dataset becomes:
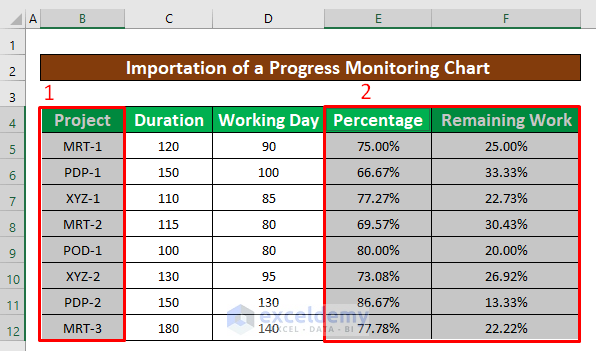
Step 2 – Create a Progress Monitoring Chart
- Select the data range. Here, B4:B12 and E4:F12.
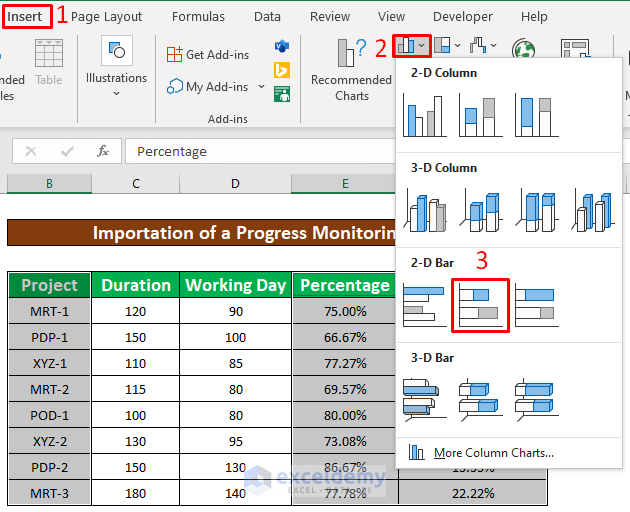
- In the Insert tab, go to:
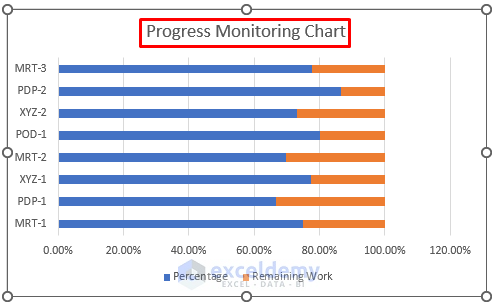
Insert → Charts → 2-D Bar
The progress monitoring chart is displayed.
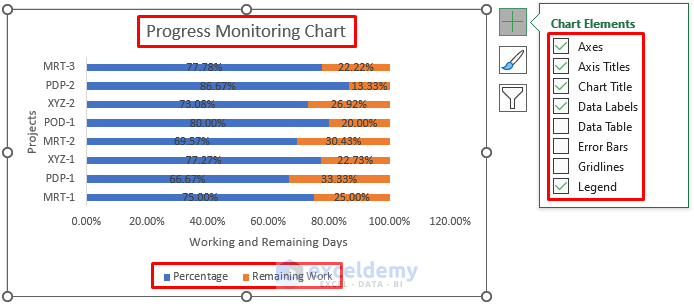
- Check Axes, Axis Title, Chart Title, Data Labels, and Legend in Chart Elements.
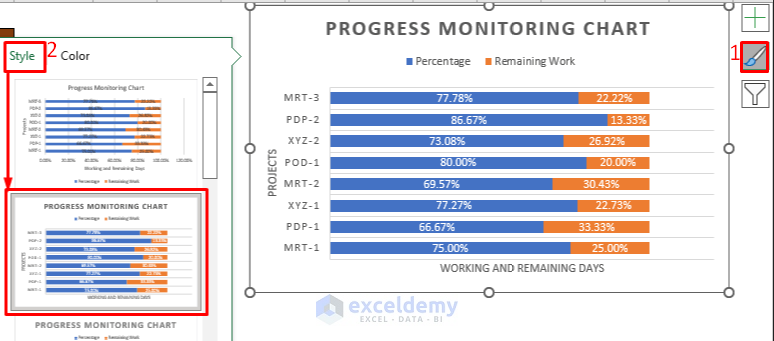
- Format the chart.
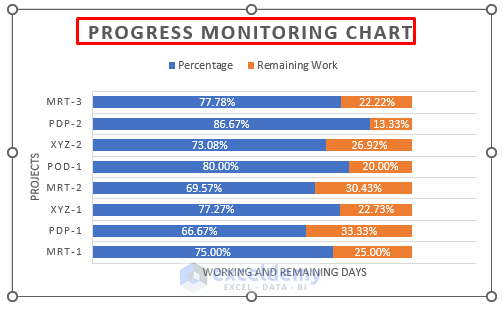
This is the output.
Read More: Progress Circle Chart in Excel as Never Seen Before
Download the practice workbook.
Related Articles
<< Go Back to Progress Chart in Excel | Excel Charts | Learn Excel
Get FREE Advanced Excel Exercises with Solutions!
