The index of a dataset's variability, known as variance, shows how far apart the various values are from one another. In this article, we are going ...
The Poisson probability distribution is one of the most essential key factors in statistics to measure and visualize the probability of a particular ...
You have come to the right place if you are looking for the answer or some unique tips to calculate Probability Distribution in Excel. There are some ...
The following picture shows an approximate model of a salary structure, which is based on employees’ experience. We will use the Regression Analysis ...
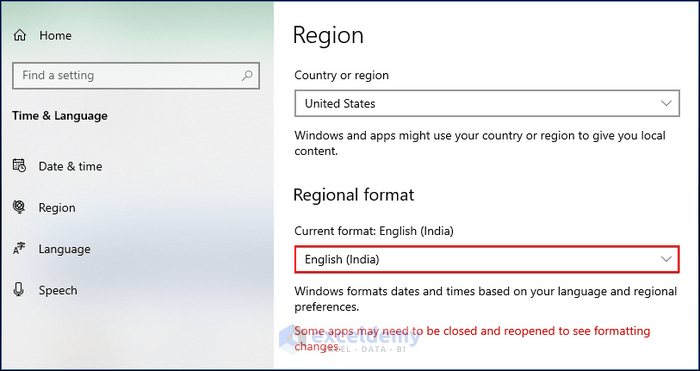
Similar to how India uses the 2, 2, 3 system of number value accounting for lakhs, the U.S. uses 3, 3, 3 for millions. We will show you how to change ...
Undoubtedly, calculating the schedule variance is a quintessential part of any project since it can be the difference between the success and failure ...