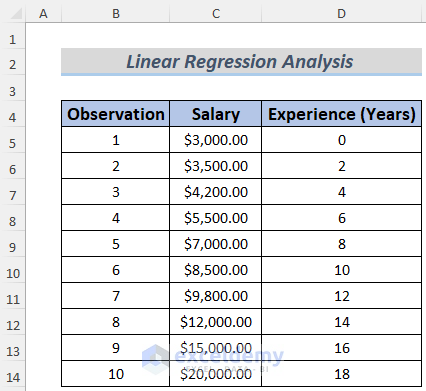
The following picture shows an approximate model of a salary structure, which is based on employees’ experience. We will use the Regression Analysis tool to model a salary structure that will be more effective for business.
Method 1 – Linear Salary Regression Analysis in Excel
We want to create a salary structure for the employees based on their experiences. We made an approximate model but want this to be modeled by Linear Regression Analysis.
Steps:
- Enable the Data Analysis ToolPak from Excel Add-ins if you don’t have it in the Data Tab.
- Go to the File menu.
- Select Options.
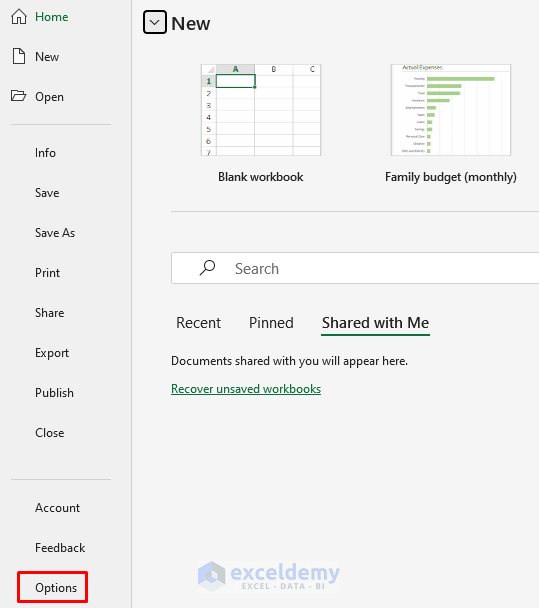
- Select Add-ins from the Excel Options
- Select Excel Add-ins from the Manage sections and click on Go.
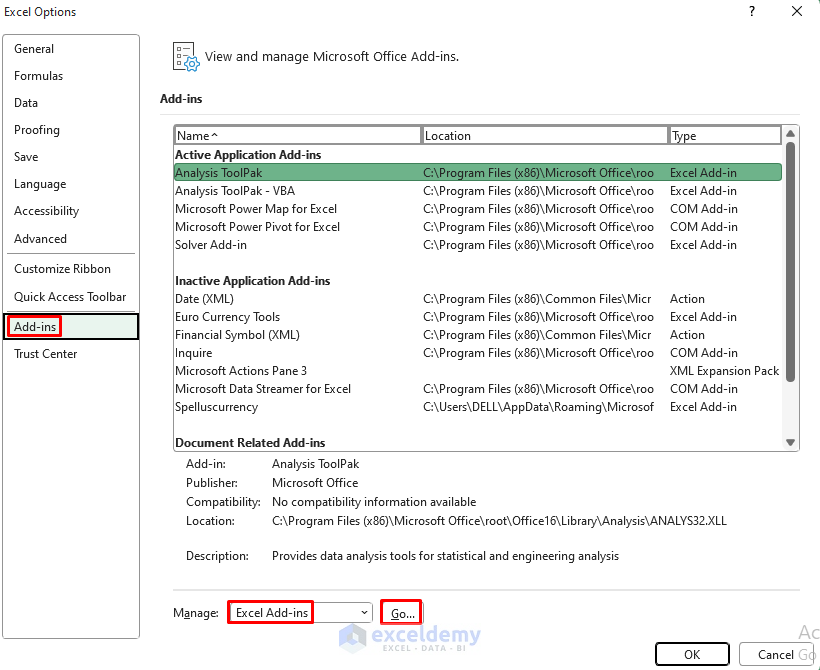
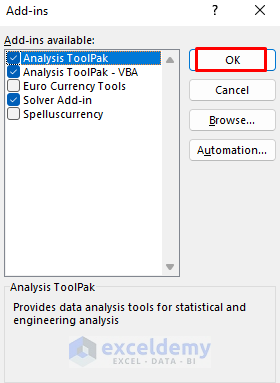
- Check Analysis ToolPak and click OK.
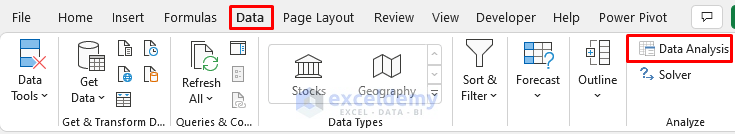
- You will see the Data Analysis tool in the Data Tab. Click on it.
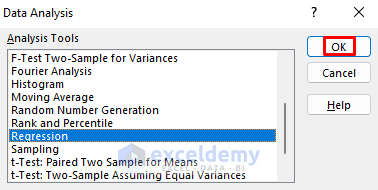
- The Data Analysis dialog box will appear. Select Regression and click OK.
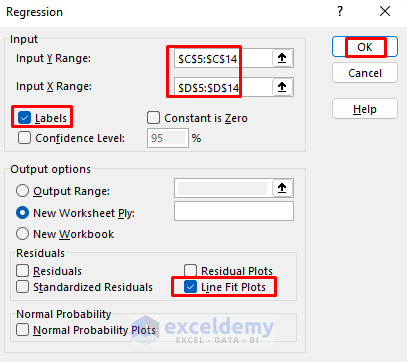
- In the Regression window, insert the Y and X variables. As the salaries are dependent on experience, salary will be the Y values and experience will be the X values. We put the salary range (C5:C14) and experience range (D5:D14) in the Input Y Range and Input X Range sections, respectively.
- Check Line Fit Plots and Labels.
- We want the analysis data in a new sheet, so we selected New Worksheet Ply.
- Click OK.
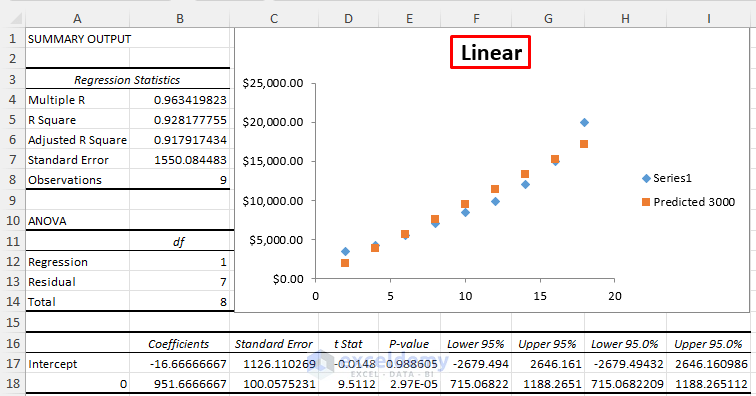
- You will see the regression analysis in a new sheet. There are some regression parameter values in the analysis sheet. We need the analysis data from the graph. It plots both the Series Data (approximate salaries) and Predicted Data (salaries for modeling). We won’t be discussing the other values (Coefficients, Standard Error, t Stat) here.
- Give your graph a name if you want. We named this chart Linear.
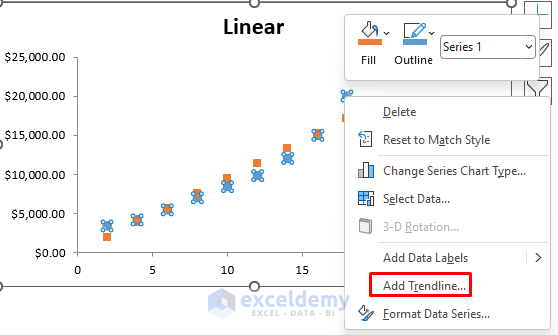
- Copy the chart and paste it into the salary model sheet.
- Right-click on any of the points of this chart and select Add Trendline.
- The Format Trendline window will appear. Select Linear and check Display Equation on Chart.
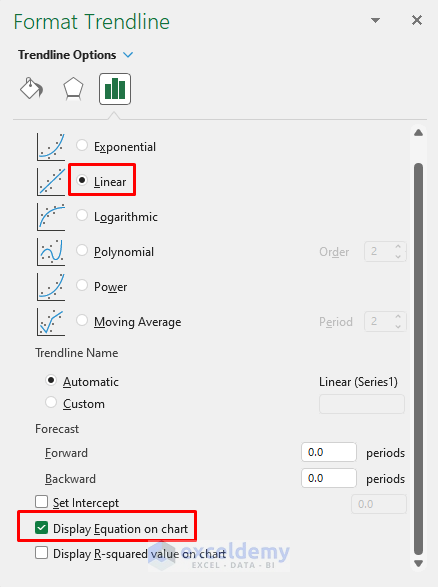
- You will see the straight-line plot along with the equation for this regression model.
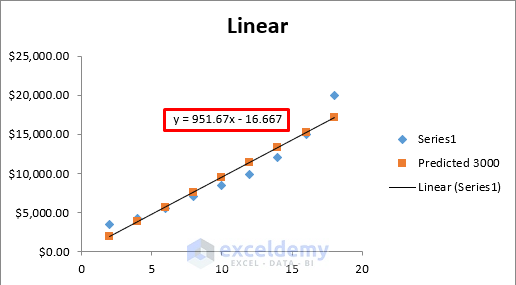
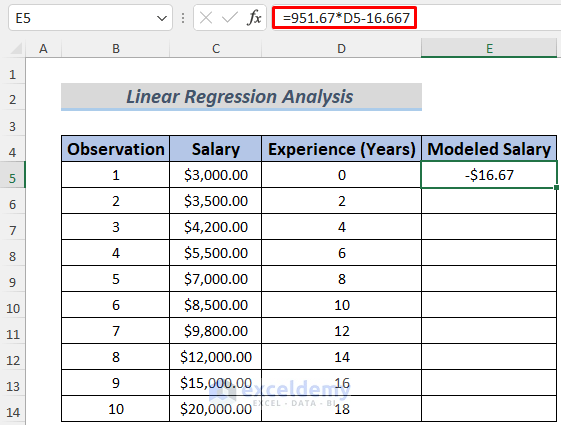
- Create a new column E to store the Modeled Salaries and use the following formula in cell E5, then press Enter.
=951.67*D5-16.667
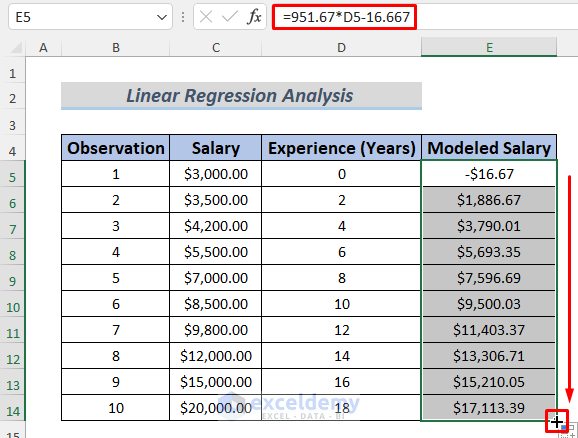
- Use the Fill Handle to AutoFill the lower cells.
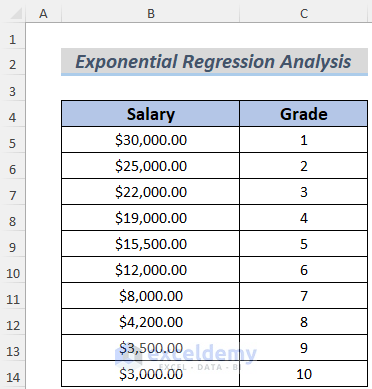
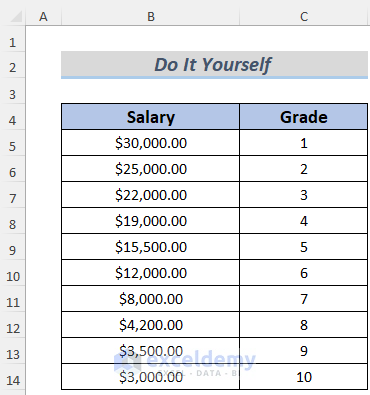
Method 2 – Exponential Salary Regression Analysis in Excel
We want to model the salary structure by the grades of the employees. Just like the previous method, we made an approximate salary structure and want this modeled via Exponential Regression Analysis.
Steps:
- Create a regression analysis table like in Method 1.
- Copy the chart and paste it into the salary model sheet.
- Right-click on any of the Series Data points of this chart and select Add Trendline.
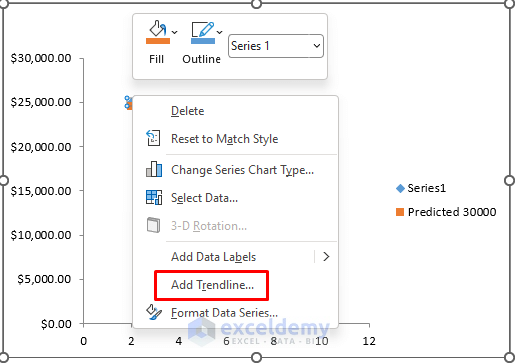
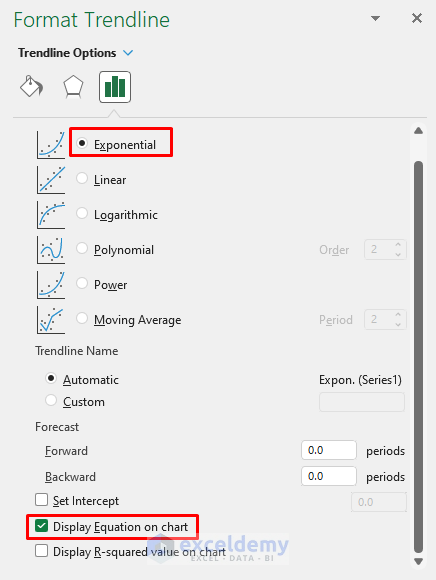
- The Format Trendline window will appear. Select Exponential and check Display Equation on Chart.
- You will see the exponential plot along with the equation for this regression model.
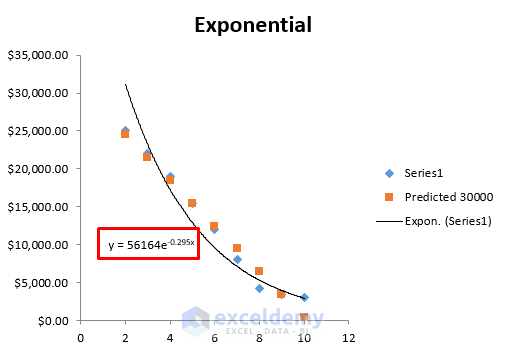
- Develop a formula using this equation to model the salaries.
- We created a new column to store the Modeled Salaries and used the following formula in cell D5.
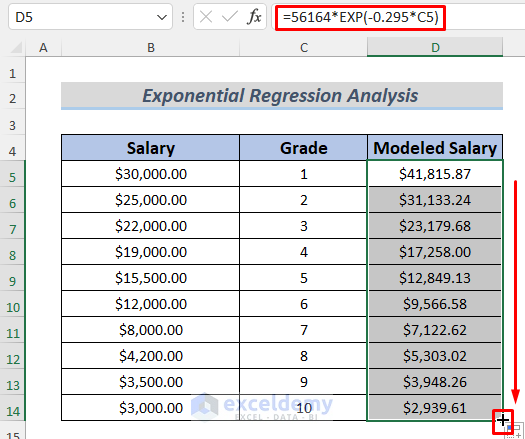
=56164*EXP(-0.295*C5)
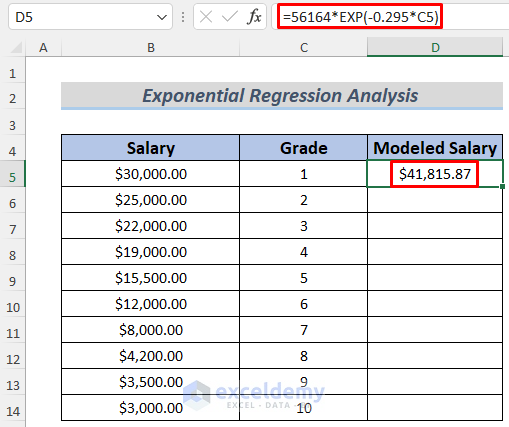
The formula uses the EXP function which returns the value of the Euler’s Number’s power of any number.
- Use the Fill Handle to AutoFill the lower cells.
Practice Section
We’re giving you the dataset of this article so that you can practice these methods on your own.
Download the Practice Workbook
<< Go Back to Salary | Formula List | Learn Excel
Get FREE Advanced Excel Exercises with Solutions!
