Excel Charts

How to Add Horizontal Line to Bar Chart in Excel (3 Easy Ways)

Sometimes, we feel the necessity of adding a horizontal line to visualize the difference more clearly in a bar chart. The horizontal line could be a ...

How to Add Regression Line to Scatter Plot in Excel

If you are looking for how to add a regression line to scatter plot in Excel, then you are in the right place. In statistics, a regression line is a ...

How to Calculate Trend Percentage in Excel (With Easy Steps)

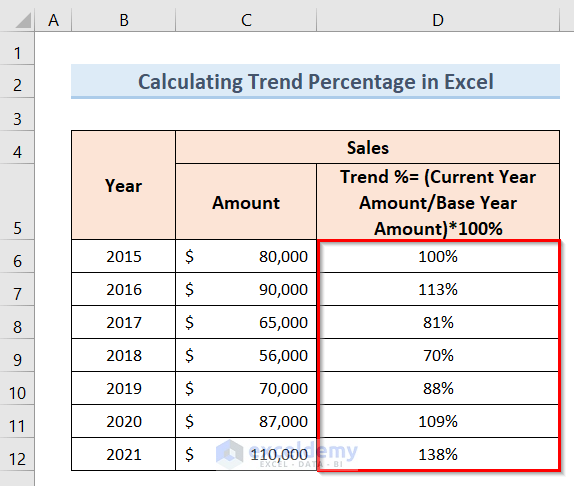
Trend Percentage represents the comparison of financial information like net sales, operating expenses, gross profit, inventory, cost of goods sold, ...

How to Make a 100% Stacked Column Chart in Excel

What Is a 100% Stacked Column Chart? If you want to compare parts of a whole, then a 100% Stacked Column chart is the way to go. This type of chart ...

How to Change Font Size of Data Labels in Excel

This tutorial will demonstrate how to change the font size of data labels in Excel charts using 2 different examples. Example 1 - Changing the ...

How to Display Variance in an Excel Bar Chart (Easy Steps)

Dataset Overview In the following dataset, I have an annual profit record. In the record, I have some annual profit amounts against their ...

How to Make a Bar Graph Comparing Two Sets of Data in Excel (4 Ways)

  Watch Video – Make a Bar Graph Comparing Two Sets of Data In the dataset, we have the profit amount of some products in the ...

[Fixed] Excel Pie Chart Leader Lines Not Showing

Excel Pie Chart Leader Lines Not Showing: Solution in 3 Steps We have the number of students in different classes in a school. Step 1 - ...

How to Add a Trendline to a Stacked Bar Chart in Excel (2 Methods)

Dataset Overview We'll use the following dataset that contains the sales data of three shops for the first six months of the year: Method ...

How to Expand Chart Data Range in Excel: 5 Methods

Method 1 - Expand Chart Data from Chart Design Options Steps: Click the Chart. The Chart Design shows now. Click Select Data from the ...

How to Make a Comparison Chart in Excel (4 Effective Ways)

Here's an overview of a comparison chart with a Pivot Table. Read More: How to Compare Two Sets of Data in Excel Chart Method 1 - ...

How to Create Bubble Chart in Excel (2 Suitable Ways)

The Bubble Chart is a type of scatter plot chart that replaces data points with bubbles. It has horizontal and vertical axis like the scatter plot ...

How to Create 4 Quadrant Bubble Chart in Excel (With Easy Steps)

Step 1 - Prepare the Dataset We set some job titles and their corresponding salaries. We'll use the salary as the X-axis. We find out the ...

How to Extend Trendline in Excel (with Easy Steps)

In a chart, a Trendline additionally referred to as a line of the first-class suit, is an immediate or curved line that depicts the overall sample or ...

How to Calculate Trend Analysis in Excel – 3 Easy Methods

    The following dataset contains three columns: Month, Cost, and Sales. Method 1. Using the TREND Function to Calculate ...

Close the CTA

Advanced Excel Exercises with Solutions PDF


ExcelDemy
Logo