


Creating the same Excel report every week or month can involve many repetitive steps: cleaning data, calculating totals, formatting tables, creating charts, and exporting the report as a PDF. Instead of repeating these actions manually, you can describe the task to ChatGPT in plain language and ask it to generate a VBA macro.
In this tutorial, we will show how to automate Excel reports with ChatGPT-generated macros. You can create a reusable Excel reporting macro with the help of ChatGPT.
Suppose an Excel workbook contains a worksheet named SalesData. Using ChatGPT-generated macros, we will automate the creation of a Monthly Report from the SalesData worksheet by summarizing regional revenue, cost, profit, and profit margin, adding a chart and report date, and exporting the report as a PDF.
Step 1: Prepare the Excel Workbook
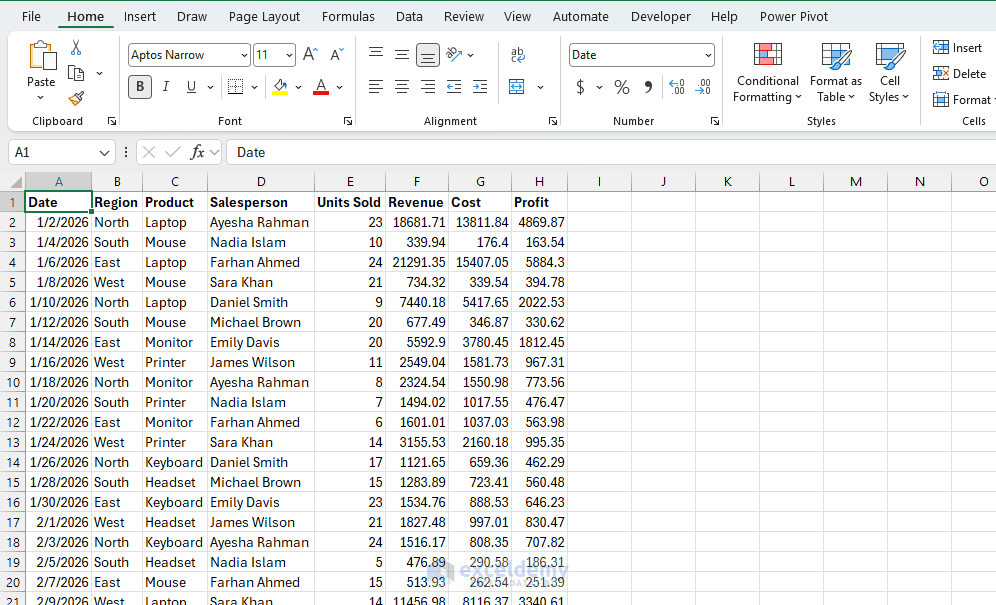
To begin, enter or import your data into a worksheet named SalesData. Make sure that:
- Row 1 contains the headers
- There are no completely blank rows inside the dataset
- Revenue, cost, and profit contain numeric values
- Dates are stored as real Excel dates
Save the workbook as an Excel Macro-Enabled Workbook:
- Select File >> click Save As
- Choose a location >> give a proper name
- Select Excel Macro-Enabled Workbook (*.xlsm) from the file type list
- Click Save
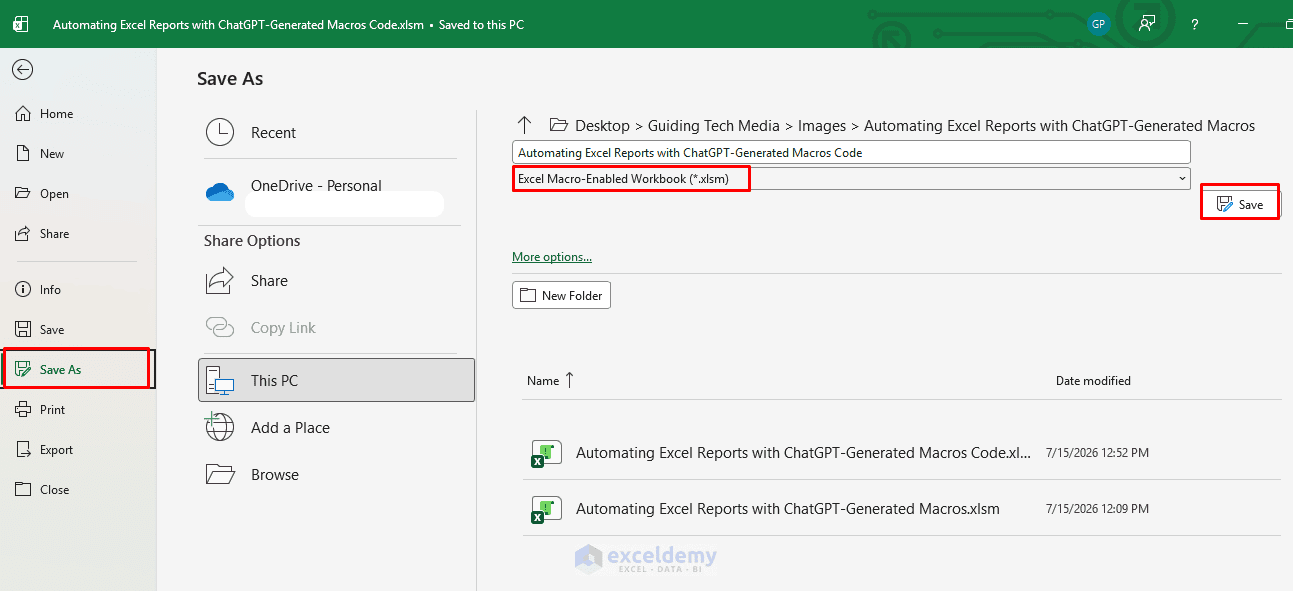
The .xlsm format is required because a standard .xlsx workbook cannot retain VBA macros.
Step 2: Create a Detailed Prompt for ChatGPT
The quality of the generated macro depends heavily on the prompt. A good prompt should clearly describe the dataset and what you want to do with the data, including:
- Source worksheet and column names
- Formatting requirements and required calculations
- Destination worksheet, and whether charts or exported files are needed
Use a prompt such as the following:
Write an Excel VBA macro that creates a recurring sales report. The source data is in a
worksheet named SalesData. Row 1 contains the headers Date, Region, Product, Salesperson,
Units Sold, Revenue, Cost, and Profit in columns A:H. The number of data rows changes
whenever the report is updated.

Delete the existing worksheet named Monthly Report if it exists, and then create a new
worksheet with that name. Summarize total Revenue, Cost, and Profit by Region.
Add a Profit Margin column calculated as Profit divided by Revenue.

Add a report title in cell A1 and the report generation date in cell A2. Format the
summary as an Excel table, apply currency formatting to Revenue, Cost, and Profit, and
percentage formatting to Profit Margin. Autofit the columns and create a clustered
column chart comparing Revenue by Region.

Finally, export the Monthly Report worksheet as a PDF in the same folder as the Excel
workbook. Include error handling and comments in the VBA code.
This prompt gives ChatGPT enough information to generate a complete and reusable macro.
Step 3: Review the Generated VBA Code
ChatGPT will generate code for this prompt, which typically looks like the following. Note the structure — it is broken into clearly commented sections, which is itself something worth requesting explicitly (“comment each section”) since it makes future edits much easier.
ChatGPT-Generated Macro:
Option Explicit

Sub CreateMonthlySalesReport()

    Dim wsData As Worksheet
    Dim wsReport As Worksheet
    Dim lastRow As Long
    Dim reportLastRow As Long
    Dim regionDict As Object
    Dim regionName As Variant
    Dim currentRegion As String
    Dim revenue As Double
    Dim cost As Double
    Dim profit As Double
    Dim i As Long
    Dim outputRow As Long
    Dim reportTable As ListObject
    Dim chartObject As chartObject
    Dim pdfPath As String

    On Error GoTo ErrorHandler

    Application.ScreenUpdating = False
    Application.DisplayAlerts = False

    Set wsData = ThisWorkbook.Worksheets("SalesData")

    'Delete the previous report if it exists
    On Error Resume Next
    ThisWorkbook.Worksheets("Monthly Report").Delete
    On Error GoTo ErrorHandler

    'Create a new report worksheet
    Set wsReport = ThisWorkbook.Worksheets.Add( _
        After:=ThisWorkbook.Worksheets(ThisWorkbook.Worksheets.Count))

    wsReport.Name = "Monthly Report"

    'Find the last used row in the source data
    lastRow = wsData.Cells(wsData.Rows.Count, "A").End(xlUp).Row

    If lastRow < 2 Then
        MsgBox "No sales data was found.", vbExclamation
        GoTo SafeExit
    End If

    Set regionDict = CreateObject("Scripting.Dictionary")

    'Summarize Revenue, Cost, and Profit by Region
    For i = 2 To lastRow

        currentRegion = Trim(wsData.Cells(i, "B").Value)

        If currentRegion <> "" Then

            revenue = Val(wsData.Cells(i, "F").Value)
            cost = Val(wsData.Cells(i, "G").Value)
            profit = Val(wsData.Cells(i, "H").Value)

            If Not regionDict.Exists(currentRegion) Then
                regionDict.Add currentRegion, Array(0#, 0#, 0#)
            End If

            regionDict(currentRegion) = Array( _
                regionDict(currentRegion)(0) + revenue, _
                regionDict(currentRegion)(1) + cost, _
                regionDict(currentRegion)(2) + profit)

        End If

    Next i

    'Add the report title and generation date
    With wsReport
        .Range("A1").Value = "Monthly Sales Report"
        .Range("A2").Value = "Generated on: " & Format(Now, "dd-mmm-yyyy hh:mm AM/PM")

        .Range("A1:E1").Merge
        .Range("A2:E2").Merge

        .Range("A1").Font.Size = 14
        .Range("A1").Font.Bold = True
        .Range("A1").HorizontalAlignment = xlCenter

        .Range("A2").Font.Italic = True
        .Range("A2").HorizontalAlignment = xlCenter
    End With

    'Add report headers
    wsReport.Range("A4").Value = "Region"
    wsReport.Range("B4").Value = "Total Revenue"
    wsReport.Range("C4").Value = "Total Cost"
    wsReport.Range("D4").Value = "Total Profit"
    wsReport.Range("E4").Value = "Profit Margin"

    outputRow = 5

    'Write the summarized values
    For Each regionName In regionDict.Keys

        wsReport.Cells(outputRow, "A").Value = regionName
        wsReport.Cells(outputRow, "B").Value = regionDict(regionName)(0)
        wsReport.Cells(outputRow, "C").Value = regionDict(regionName)(1)
        wsReport.Cells(outputRow, "D").Value = regionDict(regionName)(2)

        If regionDict(regionName)(0) <> 0 Then
            wsReport.Cells(outputRow, "E").Value = _
                regionDict(regionName)(2) / regionDict(regionName)(0)
        Else
         wsReport.Cells(outputRow, "E").Value = 0
        End If

        outputRow = outputRow + 1

    Next regionName

    reportLastRow = outputRow - 1

    'Convert the summary range into an Excel table
    Set reportTable = wsReport.ListObjects.Add( _
        SourceType:=xlSrcRange, _
        Source:=wsReport.Range("A4:E" & reportLastRow), _
        XlListObjectHasHeaders:=xlYes)

    reportTable.Name = "MonthlySalesSummary"
    reportTable.TableStyle = "TableStyleMedium2"

    'Apply number formatting
    wsReport.Range("B5:D" & reportLastRow).NumberFormat = "$#,##0.00"
    wsReport.Range("E5:E" & reportLastRow).NumberFormat = "0.00%"

    wsReport.Columns("A:E").AutoFit

    'Create a clustered column chart
    Set chartObject = wsReport.ChartObjects.Add( _
        Left:=wsReport.Range("G4").Left, _
        Top:=wsReport.Range("G4").Top, _
        Width:=500, _
        Height:=300)

    With chartObject.Chart
        .ChartType = xlColumnClustered

        .SetSourceData Source:=Union( _
            wsReport.Range("A4:A" & reportLastRow), _
            wsReport.Range("B4:B" & reportLastRow))

        .HasTitle = True
        .ChartTitle.Text = "Revenue by Region"

        .HasLegend = False

        .Axes(xlCategory).HasTitle = True
        .Axes(xlCategory).AxisTitle.Text = "Region"

        .Axes(xlValue).HasTitle = True
        .Axes(xlValue).AxisTitle.Text = "Revenue"
        .Axes(xlValue).TickLabels.NumberFormat = "$#,##0"
    End With

    'Configure the worksheet for PDF export
    With wsReport.PageSetup
        .Orientation = xlLandscape
        .Zoom = False
        .FitToPagesWide = 1
        .FitToPagesTall = False
        .PrintArea = wsReport.UsedRange.Address
    End With

    'Create the PDF path
    If ThisWorkbook.Path = "" Then
        MsgBox "Save the workbook before exporting the report as a PDF.", _
               vbExclamation
        GoTo SafeExit
    End If

    pdfPath = ThisWorkbook.Path & Application.PathSeparator & _
              "Monthly_Sales_Report_" & Format(Date, "yyyy-mm-dd") & ".pdf"

    'Export the report as a PDF
    wsReport.ExportAsFixedFormat _
        Type:=xlTypePDF, _
        Filename:=pdfPath, _
        Quality:=xlQualityStandard, _
        IncludeDocProperties:=True, _
        IgnorePrintAreas:=False, _
        OpenAfterPublish:=False

    MsgBox "The report was created successfully." & vbCrLf & _
        "PDF saved to:" & vbCrLf & pdfPath, vbInformation

SafeExit:
    Application.DisplayAlerts = True
    Application.ScreenUpdating = True

    Set regionDict = Nothing
    Set reportTable = Nothing
    Set chartObject = Nothing
    Set wsData = Nothing
    Set wsReport = Nothing

    Exit Sub

ErrorHandler:
    MsgBox "The report could not be created." & vbCrLf & _
        "Error " & Err.Number & ": " & Err.Description, vbCritical

    Resume SafeExit

End Sub
Although ChatGPT generated the code, always review the important details before running it. In particular, verify the worksheet names, column letters, output locations, calculations, and file paths.
Step 4: Insert and Run the Macro in Excel
To add the generated code:
- Open the Excel workbook
- Go to the Developer tab >> select Visual Basic or press Alt + F11 to open the Visual Basic Editor
- Click Insert >> select Module
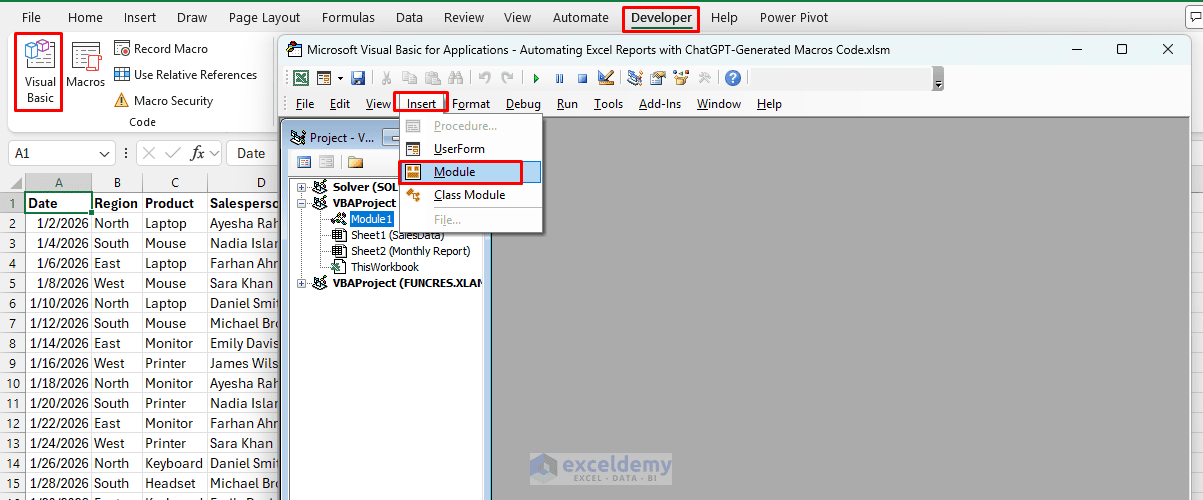
- Paste the generated VBA code into the module:
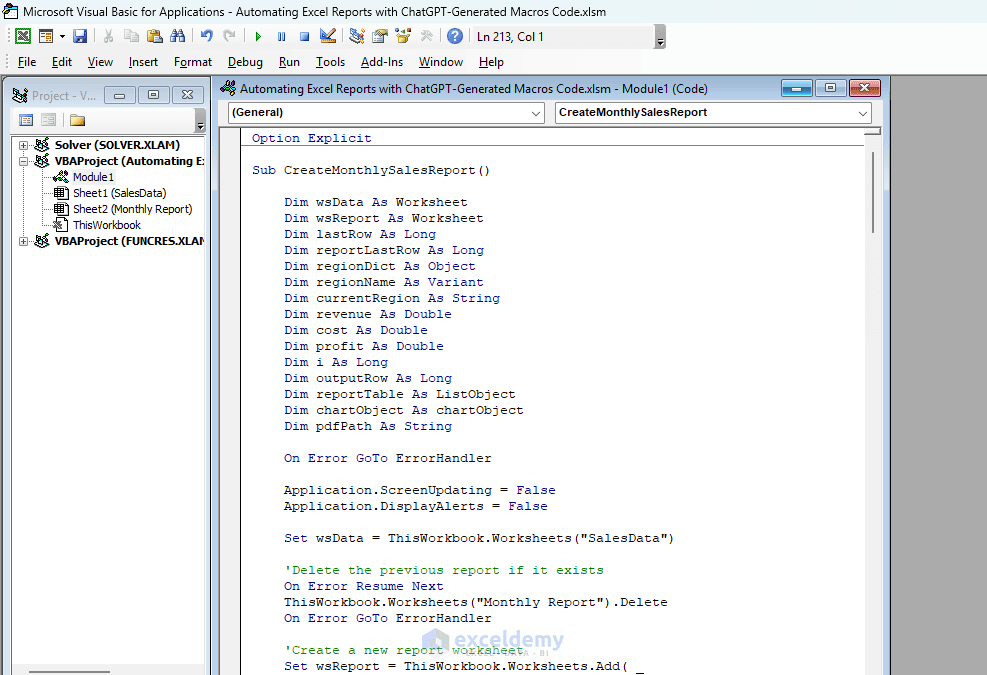
The macro is now stored inside the workbook.
To run the macro:
- Return to Excel
- Go to the Developer tab >> select Macros
- Select CreateMonthlySalesReport
- Click Run
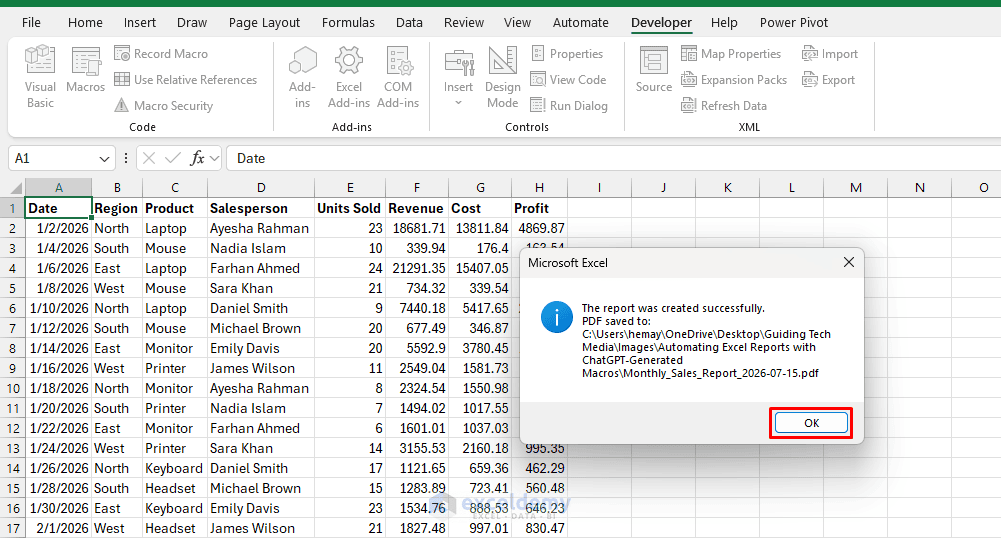
- A message box will appear showing the location of the saved PDF file
- Click OK
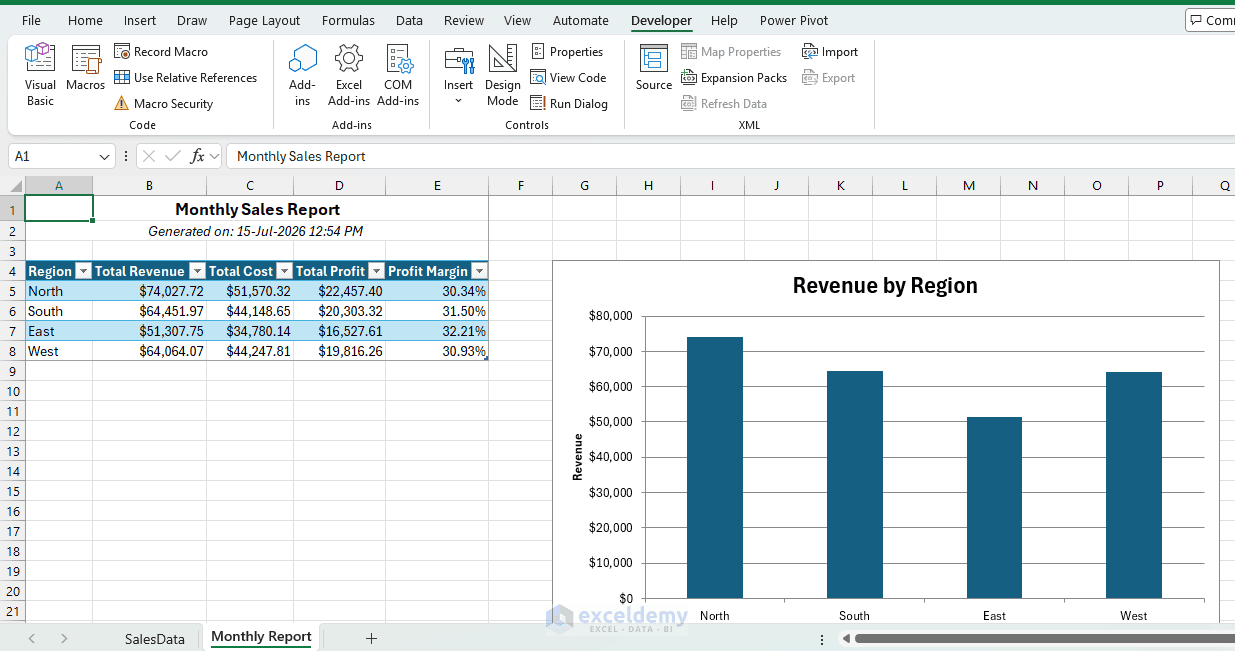
- The macro will create the Monthly Report worksheet, summarize the data, apply formatting, create the chart, and save the report as a PDF
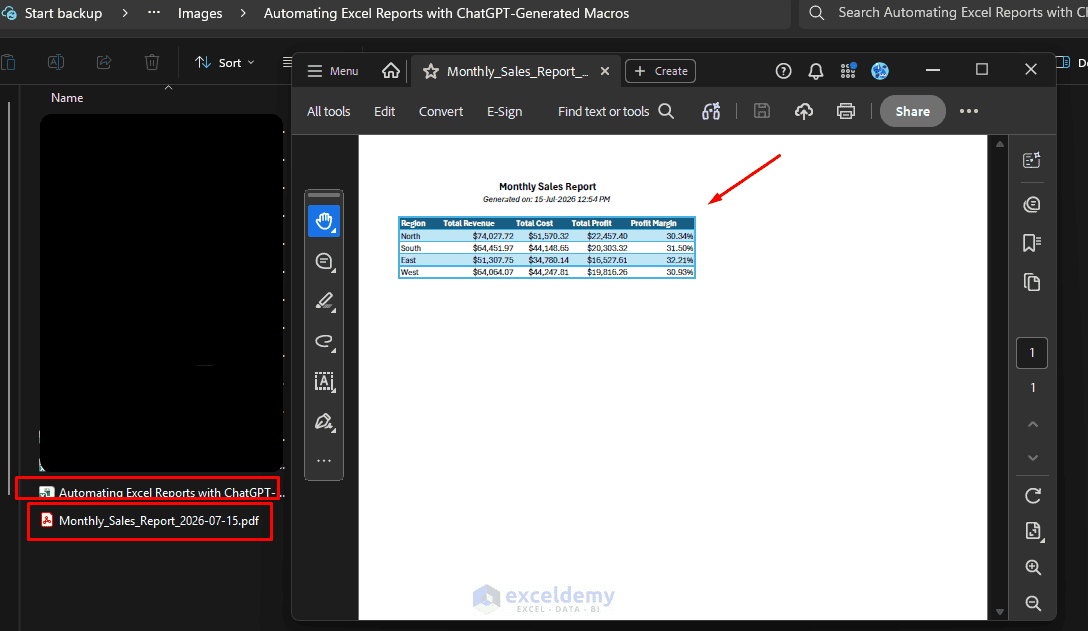
- The PDF will be stored in the same folder as the Excel workbook
Step 5: Add a Button to Run the Report
Assigning the macro to a shape or button makes it a single-click operation, which is easier for other users.
- Open the Developer tab >> select Insert >> under Form Controls >> select Button
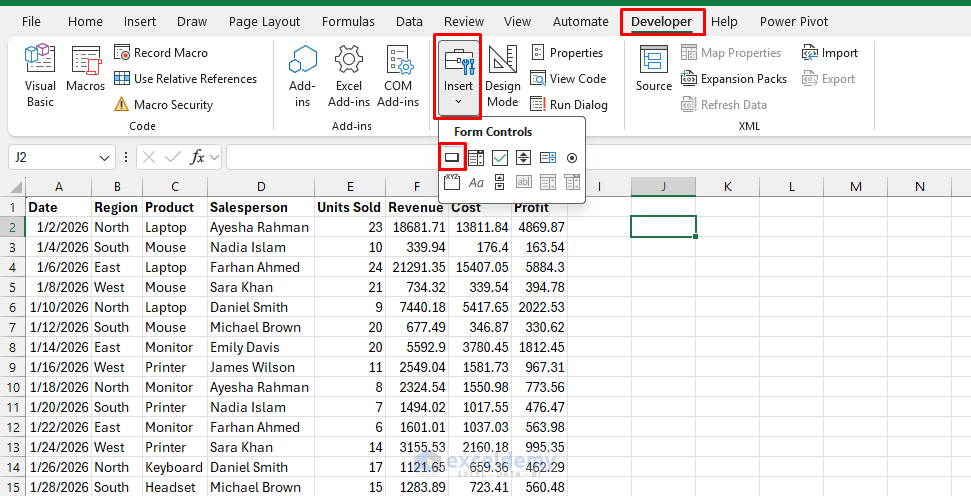
- Draw the button on the worksheet
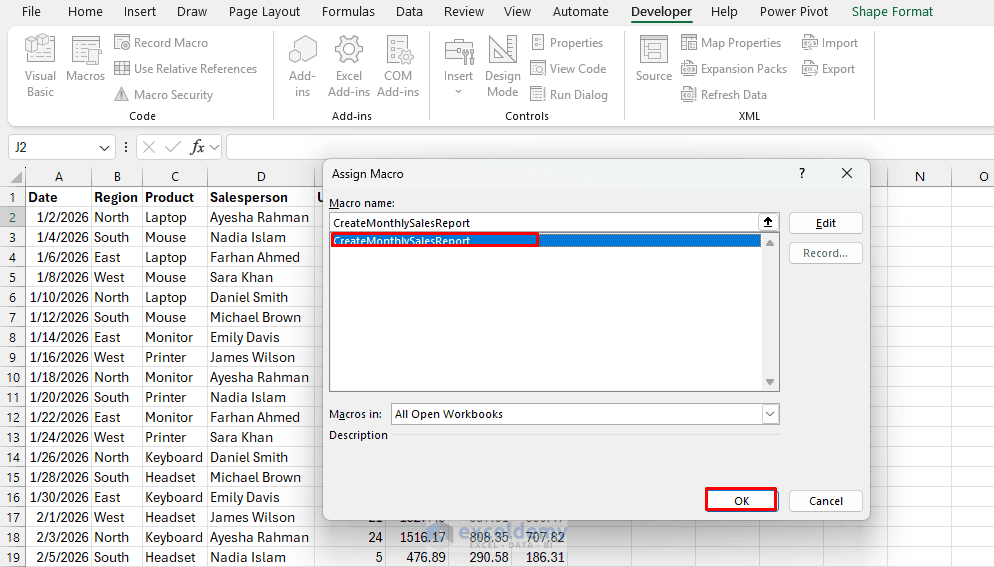
- Select CreateMonthlySalesReport from the macro list >> click OK
- Right-click the button and select Edit Text >> rename it to “Generate Monthly Report”
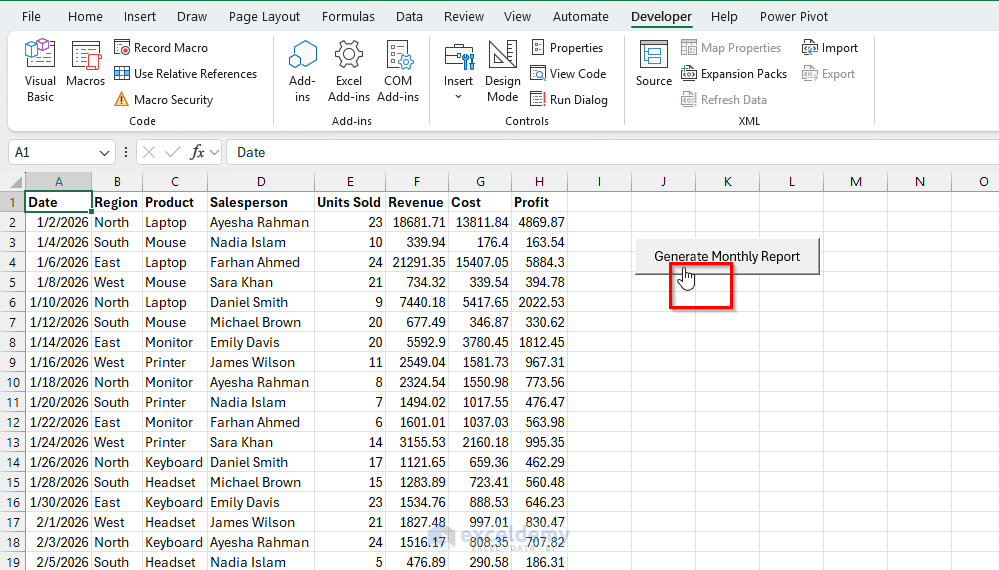
Users can now refresh the report by clicking the button. When the Developer tab is unavailable, enable it through: File > Options > Customize Ribbon > Developer
Improving the Prompt for Different Reporting Tasks
The same approach can be used for many types of recurring reports. Change the prompt according to the task you need to automate.
- Prompt for a Date-Filtered Report:
Modify the macro so that it asks the user for a start date and an end date. Include
only rows where the Date column falls within that period. Validate the
entered dates and display a clear message when no matching records are found.
- Prompt for a Monthly Department Report:
Write a VBA macro that summarizes total expenses by department and month. The source
data is in the Expenses worksheet. Create the summary in a worksheet named
Department Report and add a line chart showing monthly expenses for each department.
- Prompt for Refreshing a PivotTable Report:
Write a VBA macro that refreshes all workbook data connections and PivotTables,
updates the report date in cell B2, formats the PivotTable, and exports the Dashboard
worksheet as a PDF.
- Prompt for Emailing a Report:
Modify the VBA macro so that it exports the report as a PDF and creates an Outlook email
with the PDF attached. Display the email for review instead of sending it automatically.
- Prompt for Saving Reports in a Specific Folder:
Modify the macro so that it creates a Reports folder inside the workbook folder when
the folder does not already exist. Save the PDF inside that folder using the reporting
month in the filename.
Testing the Generated Macro
Before using the macro with an important workbook:
- Create a backup copy of the file
- Test the macro with a small dataset
- Confirm that all totals are correct
- Check whether existing worksheets or files have been deleted
- Test blank cells and missing values
- Test the macro after adding new data rows
- Confirm that the PDF contains the complete report
- Review any code that sends emails or deletes information
Macros can modify or delete workbook content, and these actions may not be reversible through Excel’s Undo command.
Common Problems and Pitfalls
- The Macro Cannot Find the Worksheet: The worksheet name in the code must exactly match the Excel tab name.
- New Data Rows Are Missing: Avoid fixed ranges such as
Range("A2:H100"). Use a dynamic last-row calculation instead:
lastRow = wsData.Cells(wsData.Rows.Count, "A").End(xlUp).Row
- The PDF Is Not Created: The workbook must be saved before the macro can use
ThisWorkbook.Path. Also confirm that you have write permission for the destination folder. - Macros Are Blocked: Close and reopen the workbook, then select Enable Content when Excel displays a security warning. Only enable macros from files and code you trust.
- Currency Symbols Are Incorrect: Change the number format in the VBA code to use a currency format based on the computer’s regional settings.
Best Practices for ChatGPT-Generated Macros
Always tell ChatGPT to:
- Use dynamic ranges instead of fixed row numbers
- Include
Option Explicit - Add comments explaining major sections
- Include error handling
- Validate worksheet names and source data
- Avoid selecting or activating worksheets unnecessarily
- Restore settings such as
ScreenUpdatingafter the macro finishes - Display a clear success or error message
- Avoid automatically sending emails unless specifically required
You can also paste an error message or the problematic VBA section into ChatGPT and ask it to diagnose the issue. Include the exact line highlighted by the Visual Basic Editor and explain what you expected the macro to do.
Conclusion
ChatGPT can turn a plain-language description of a recurring Excel reporting process into a working VBA macro. The most important step is providing a precise prompt that identifies the source data, required calculations, output format, and automation steps. After reviewing and testing the generated code, you can run the entire reporting process with a keyboard shortcut or worksheet button. This reduces repetitive work, keeps report formatting consistent, and makes it easier to generate updated reports whenever new data is added.
Get FREE Advanced Excel Exercises with Solutions!

