Trend Percentage represents the comparison of financial information like net sales, operating expenses, gross profit, inventory, cost of goods sold, etc. over time with respect to a base year or base period value. It is really helpful in order to keep track of your financial information. It is a form of trend analysis. Are you having trouble calculating trend percentages in Excel? In this article, we will see how to calculate trend percentages in Excel with easy steps.
Step-by-Step Procedures to Calculate Trend Percentage in Excel
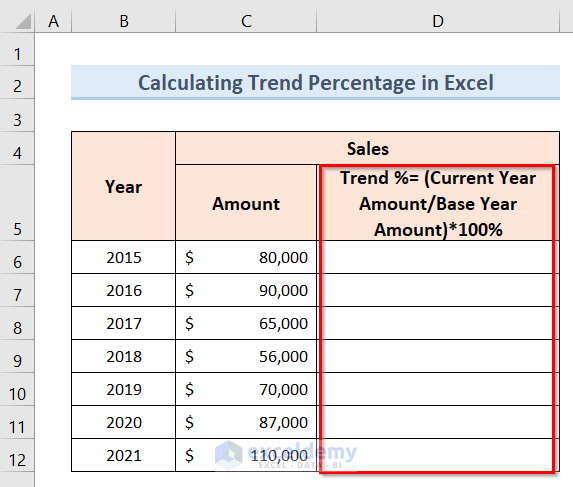
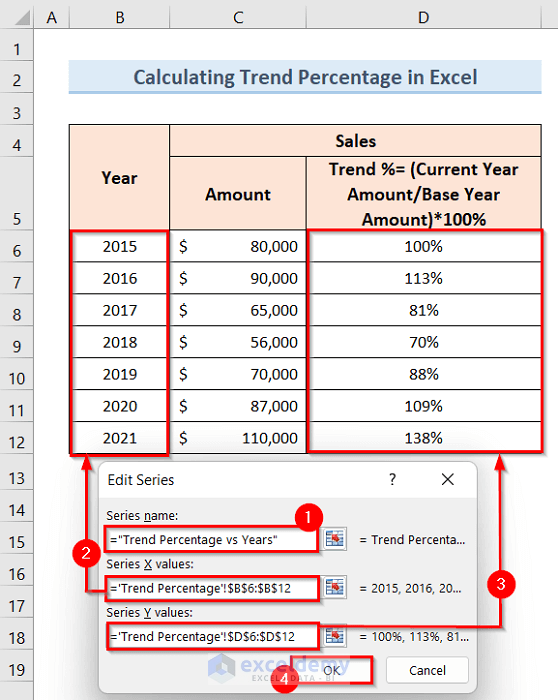
We will need a dataset like the following figure to calculate the trend percentage in Excel. The dataset contains the Sales amount of 7 years of a shop. You can also add multiple columns of gross profit, inventory, cost of goods sold, etc., and calculate the trend percentage of those data in the same way.

Step 1: Create New Column and Format Data Type
- First, create a new column next to the column Amount and type Trend %= (Current Year Amount/Base Year Amount)*100% as the column title.
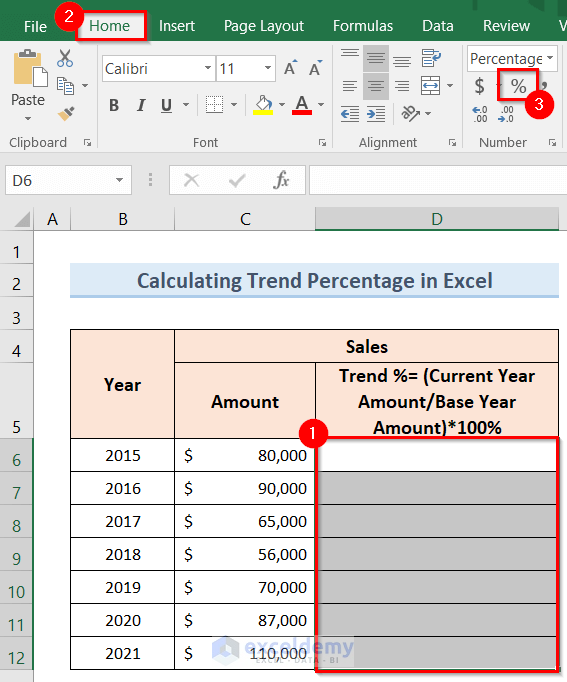
- Next, select the cells (D6:D12) >> click on the Home tab >> click on the % option for the number data type.
Step 2: Calculate Trend Percentage in Excel Using Formula
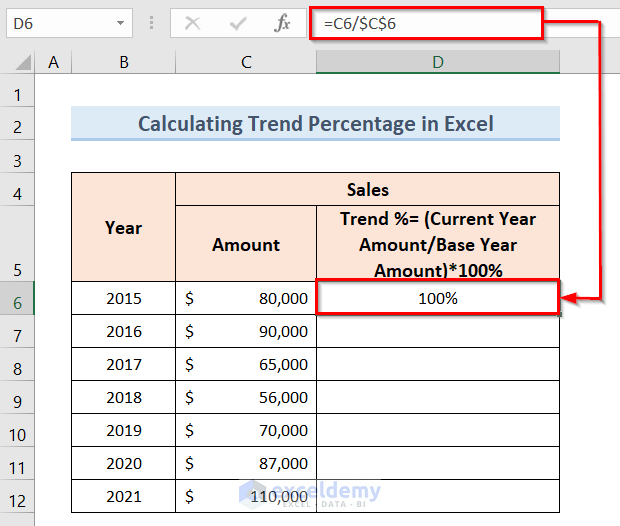
In order to calculate the trend percentage in Excel, we will need a base year amount. Suppose we are taking the Sales Amount of 2015 as our base year amount which is $80000. Now we will calculate the trend percentage of other data with respect to this base year amount.
- After that, click on the D6 cell and type the following formula:
=C6/$C$6- Then, press Enter.
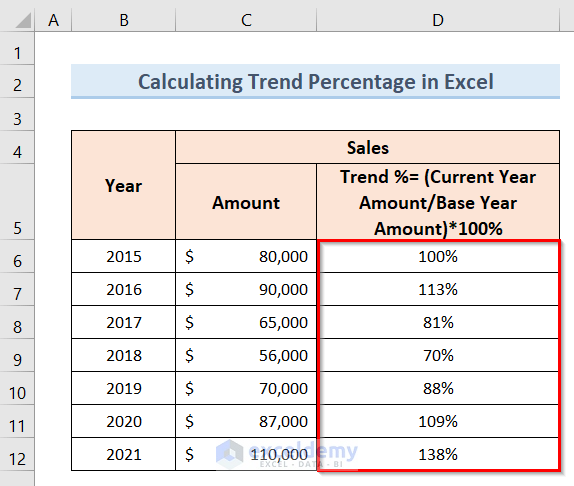
- Furthermore, select the D6 cell and drag the Fill Handle to the entire column Trend %.
- As a result, you will see an output like the image below.
Step 3: Create Scatter Plot of Trend Percentage vs Years in Excel
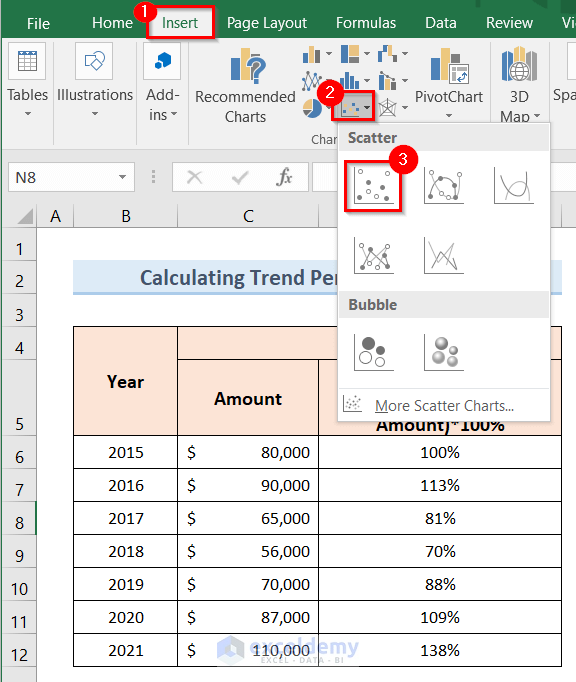
- First of all, click on the Insert tab.
- Next, click on the Insert Scatter (X, Y) or Bubble Chart drop-down option.
- After that, choose the Scatter Plot option like the image below.
- As a result, it will open an empty plot.
- Subsequently, right-click on the empty plot.
- Now, click on the Select Data Source option from the pop-up window.

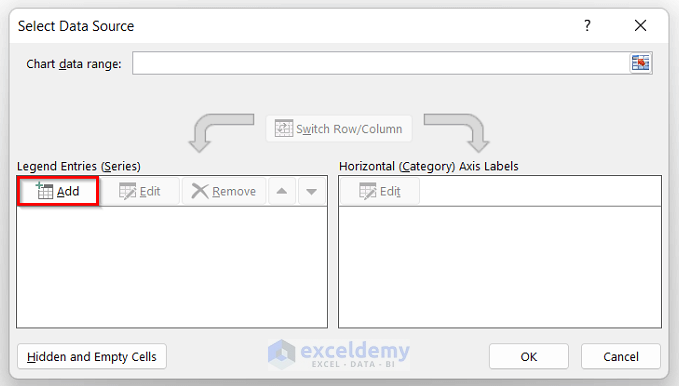
- After that, the Select Data Source window will pop up.
- Now, click on the Add option like the image below.
- Furthermore, select the Series name, Series X, and Series Y values from the dataset as shown below.
- Then, click OK.
- As a result, the Select Data Source window will pop up.
- Then, click OK.

- Now, you will see a scatter plot named Trend Percentage vs Years like the below one.

Read More: How to Calculate Trend Analysis in Excel
Step 4: Add Axis Titles and Trendline to Scatter Plot
- After that, in order to modify the chart, select the chart.
- Next, click on the ‘+’ sign.
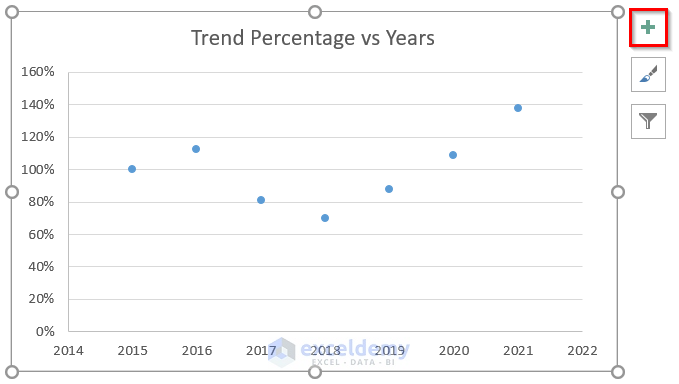
- As a result, it will open the Chart Element window.
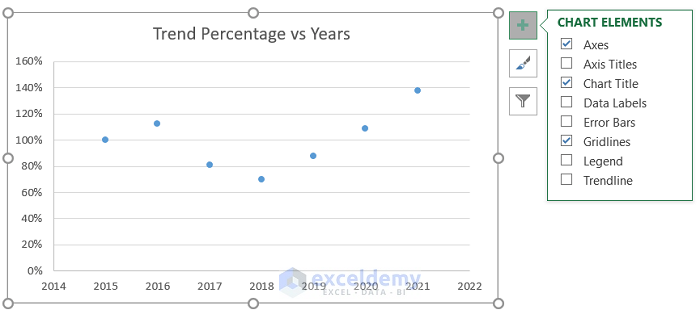
- Then, select the Axis Titles and Trendline options like the image below.
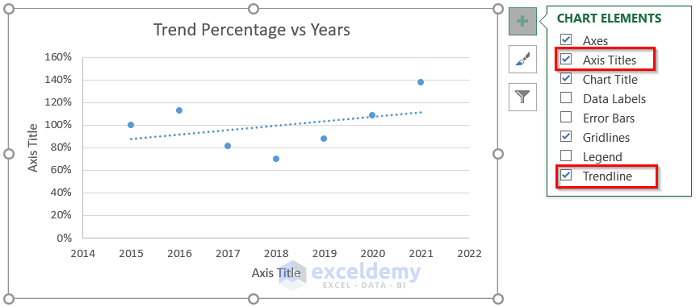
- Finally, change the axis titles as you want as shown below.

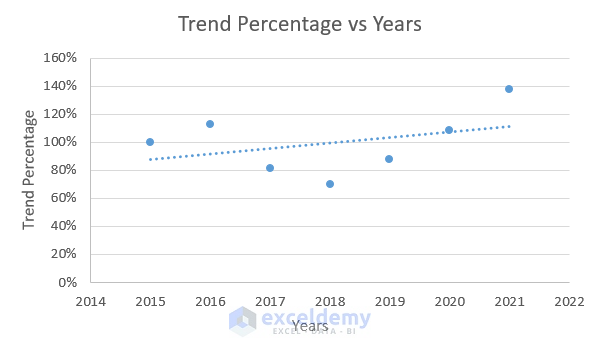
Final Output
- Hence, your Trend Percentage vs Years scatter plot is ready with a trendline like the below image.
Things to Remember
- In order to calculate the trend percentage in Excel, you will need a base year amount and you will calculate your trend percentage with respect to the base year amount.
- In order to follow the above-described steps, you have to know the sales amount for each year to calculate the trend percentage with respect to the base year amount.
- After creating the scatter plot, you can modify the plot in your own way.
Download Practice Workbook
You can download the Excel workbook from here.
Conclusion
Hence, follow the above-described steps. Thus, you can easily learn how to calculate trend percentage in Excel. Hope this will be helpful. Don’t forget to drop your comments, suggestions, or queries in the comment section below.
Related Articles
- How to Make a Polynomial Trendline in Excel
- How to Draw Best Fit Line in Excel
- How to Plot Quadratic Line of Best Fit in Excel
- How to Insert Trendline in an Excel Cell
- How to Create Trend Chart in Excel
- How to Create Monthly Trend Chart in Excel
<< Go Back To Trendline in Excel | Excel Charts | Learn Excel
Get FREE Advanced Excel Exercises with Solutions!
