Excel Charts

How to Create Dynamic Charts in Excel – 3 Methods

The dataset shows Month, and Total Sales in USD.   Method 1 - Creating Dynamic Charts Using an Excel Table  Steps: Select any ...

How to Shade an Area of a Graph in Excel (With Easy Steps)

In this example, we’ll consider a watersports business. They offer the Activity cruise, Nature cruise, and Sunset cruise. Here, we will analyze the ...

How to Make Pie Chart with Breakout in Excel (Step by Step)

Excel datasets contain sectionized data that can be referred to as breakout. The typical way to make a pie chart with breakout in Excel involves ...

How to Create a Stacked Bar Chart with Dates in Excel (3 Examples)

Method 1 – Creating a Stacked Bar Chart with Dates in Excel Steps: Input the dates in the cell range B5:B10 and sales of different products of ...

Column Chart vs Bar Chart in Excel (6 Useful Examples)

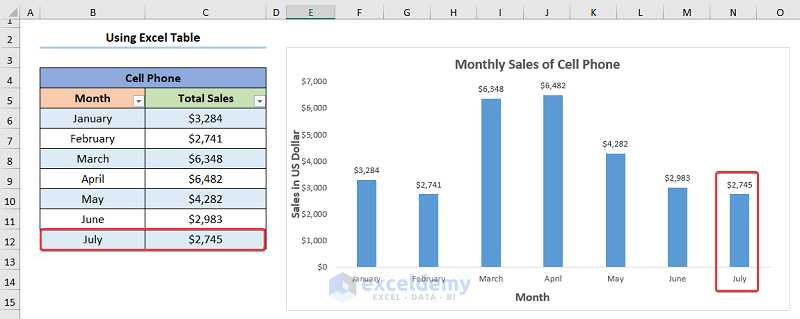
This article demonstrates the features of a Column Chart vs Bar Chart in Excel. Without any doubt, Excel charts are an excellent tool. It's suitable ...

How to Create a Bar Graph in Excel without Numbers – 3 Methods

The dataset showcases products that were returned for different reasons and the Refund Status (set to Yes or No). To create a Bar Graph using this ...

How to Create Pie Chart for Sum by Category in Excel (2 Quick Methods)

We have a dataset with a list of products that fall into three categories and their Sales Quantity. The categories are Laptop, Headphone, and ...

How to Create a Pie Chart in Excel with One Data Column – 2 Methods

This is the sample dataset. Method 1 - Inserting a PivotTable to Create a Pie Chart in Excel Step 1: Select the entire column. Here, ...

How to Plot a Stacked Bar Chart from an Excel Pivot Table – 2 Examples

Example 1 - Plot a Stacked Bar Chart from an Excel Pivot Table This is the sample dataset. To Create a Pivot Table: Select the whole ...

How to Format Data Labels in Excel (Easy Steps)

Dataset Overview To display formatted data labels in Excel, follow these steps using the below dataset that includes country names and their ...

How to Create a Pie Chart by Count of Values in Excel (2 Methods)

Dataset Overview To illustrate the methods, we’ve chosen a dataset with three columns: Company, Product, and Sold (Qty). Method 1 - ...

Progress Circle Chart in Excel as Never Seen Before

A progress circle chart is a great tool to visualize the completion status of a task. Generally, we can create a progress circle chart by simply ...

Excel Area Chart Data Label & Position

This article deals with the excel area chart data label position. An area chart is used to plot data arranged in rows or columns on a worksheet. You ...

How to Make a Progress Monitoring Chart in Excel – 2 Steps

The sample dataset contains information on different projects. Step 1 - Create a Dataset Calculate the percentage of work on the ...

Create an Excel Bar Chart with a Line Overlay – 3 Steps

The following table contains the Month, Sales, and Profit. Create an Excel bar chart with a line overlay: Step 1- Inserting the Bar Chart ...

Close the CTA

Advanced Excel Exercises with Solutions PDF


ExcelDemy
Logo