In this Excel article, we will learn how to calculate non-linear interpolation Excel. While working on a dataset, we need to deal with those data points that are not connected with each other and don’t follow any pattern as well. In that case, we can calculate nonlinear interpolation and plot the data in a graph to see the characteristics of the data and solve the problem regarding the scattered points or numbers. So, let’s start.
What Is Non-Linear Interpolation in Excel?
Non-linear interpolation is a technique that eliminates the values between data points without following any rule or pattern. Excel by default refers to many functions for linear interpolation, but non-linear interpolation is different. The method of calculating nonlinear interpolation depends on the behavior of the dataset.
How to Calculate Non-Linear Interpolation in Excel
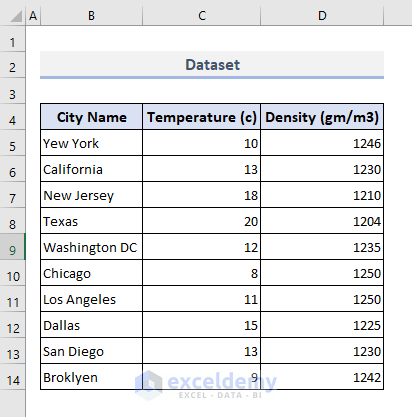
The below dataset contains City Name, Temperature ( c), and Density (gm/m3). All this information represents the following city’s temperature and air density in the dataset. As the temperature is independent here and density is dependent on temperature, “Temperature” is X here, and “Density” is Y.
Here, we will calculate non-linear interpolation in Excel by applying the methods below. So, follow these methods to gain more knowledge about non-linear interpolation.
1. Using the GROWTH Function
Here, we will calculate nonlinear interpolation using the GROWTH function.
📌Steps:
- Initially, select cell D17 to enter the GROWTH function and complete this process.
- Select input range (dependent variable) D5:D14 and independent range C5:C14 to calculate the non-linear interpolation.
- Then, select the lookup value C17 and finally write down 1, as the output will return the exact value as
=GROWTH(D5:D14,C5:C14,C17,1)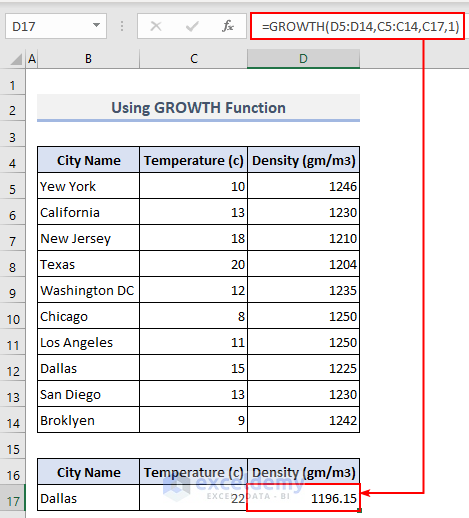
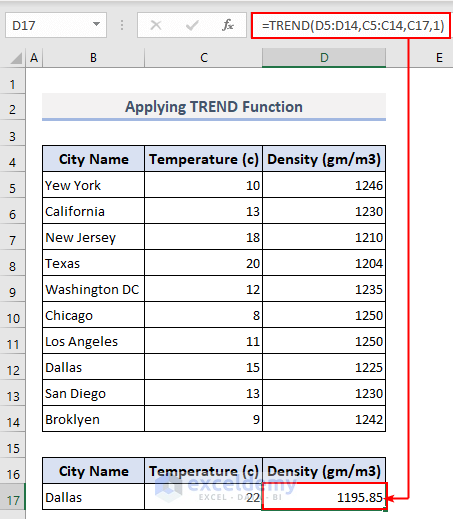
2. Applying the TREND Function
In this method, we will show you how to apply the TREND function for non-linear interpolation. The image below shows the output of this process. Follow the steps to execute this process.
📌 Steps:
- Start executing the process by selecting cell D17 and entering the TREND.
- Now, C17 represents the value to interpolate, where the dependent range (known_ys) is D5:D14 and the independent range (known_xs) is C5:C14.
- Lastly, write down 1 as the value of const is 0 (Zero).
=TREND(D5:D14,C5:C14,C17,1)
How to Get Non-Linear Interpolation with Trendline in Excel
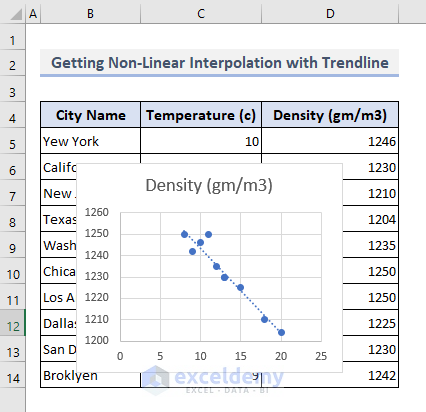
Once you add a trendline to your chart, the characteristics of the data are quite visible. We will add a trendline for a set of data to get the non-linear interpolation. So, follow the below steps to get the output.
📌 Steps:
- Initially, select range C4:D14 >> Insert >> Chart Type >>Scatter Chart.
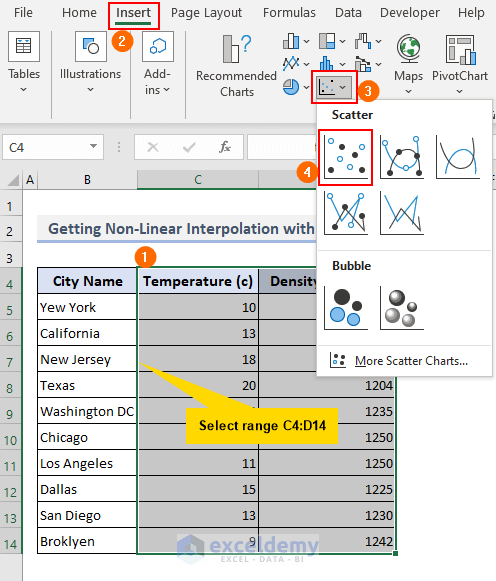
- Once you click Scatter, a Scatter chart will be created.
- Then, select the chart, click on the Plus (+) sign, and select the trendline from the Chart Elements.
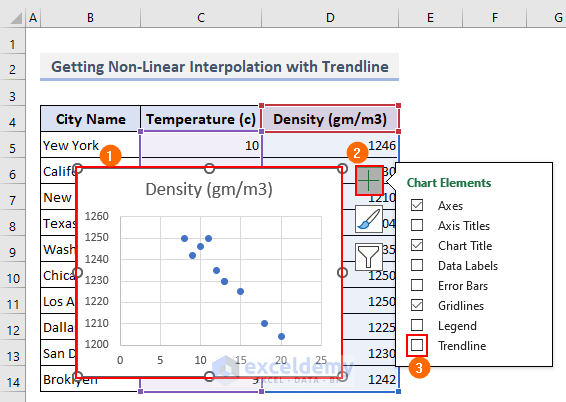
- Finally, the output will be similar to the one below.
Read More: How to Interpolate in Excel Graph
How to Calculate Linear Interpolation in Excel
We already calculate non-linear interpolation in Excel. Now, we will calculate linear interpolation using the TREND function with the below dataset. The dataset represents the number of people visiting the articles every 10 days on the EXCELDEMY site. This represents the growth of the site.
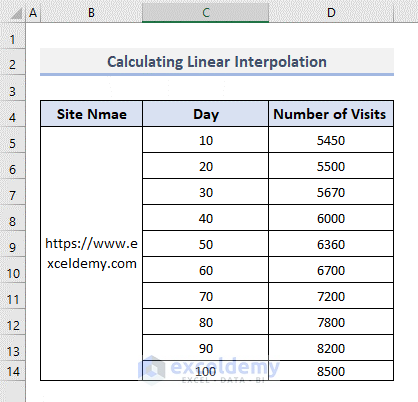
Now follow the steps below to execute this process.
📌Steps:
- Initially, select cell C17 to enter the formula.
- After that, select result range D5:D14 to get the output from this range.
- Now, select the day range C5:C14 and look up the day value in cell B17 to get the final output.
=TREND(D5:D14,C5:C14,B17,1)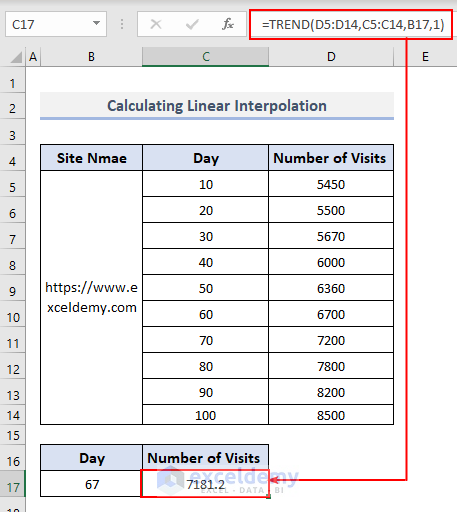
Read More: How to Do Linear Interpolation in Excel
Things to Remember
- While calculating nonlinear interpolation, make sure there is sufficient data to execute the process. Otherwise, you can’t perform the process.
- Non-linear interpolation varies with the nature of the data, so make sure you are using the correct method while executing the process.
Frequently Asked Questions
1. What is the difference between Interpolation and Linear Regression?
Ans: Interpolation is mainly used to eliminate the values of a known data point that doesn’t follow any pattern. On the other hand, linear regression is used to analyze the difference between two values.
2. What are the Advantages and Disadvantages of Non-Linear Interpolation?
Ans: Non-linear interpolation is more accurate and shows more accurate results for data that follows a non-linear pattern. On the other hand, nonlinear extrapolation is quite complex and requires complex methods to establish accuracy.
3. What Is Interpolation vs. Extrapolation?
Ans: Interpolation is the process of eliminating the known data value within the range, and extrapolation eliminates the known values that are beyond the range.
Download Practice Workbook
You can find the practice sheet Here.
Conclusion
In this article, we learned how to calculate nonlinear interpolation in Excel using different formulas. Nonlinear interpolation depends on the nature of the data. The process of interpolation is different for different data. We covered every way to calculate nonlinear interpolation and covered linear interpolation as well. Hopefully, you can solve the problem shown in this article.
Related Articles
- How to Interpolate Missing Data in Excel
- How to Do Interpolation with GROWTH & TREND Functions in Excel
- How to Do VLOOKUP and Interpolate in Excel
- How to Interpolate Between Two Values in Excel
- How to Perform Bilinear Interpolation in Excel
- How to Do Linear Interpolation Excel VBA
<< Go Back to Excel Interpolation | Excel for Statistics | Learn Excel
Get FREE Advanced Excel Exercises with Solutions!
