This is a final output:

What Is Linear Interpolation in Excel?
Interpolation is a method of finding a value from known values. In linear interpolation, you get a new data point from two known data points.
Suppose you have a point W(a,b) and V(c,d). For an unknown point of U(x,y), you want to know the y value for the known value of x. TThe equation is:
y=c + ((d - c) * (x - a) / (b - a))
Step 1- Create a Dataset
- The dataset showcases Solubility in Different Temperatures.
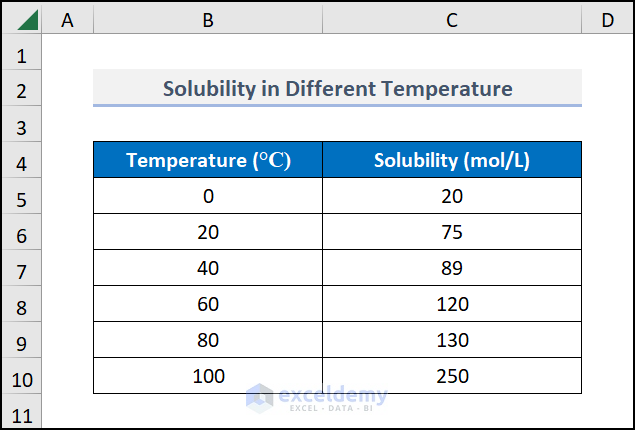
To know the solubility of a fixed temperature:
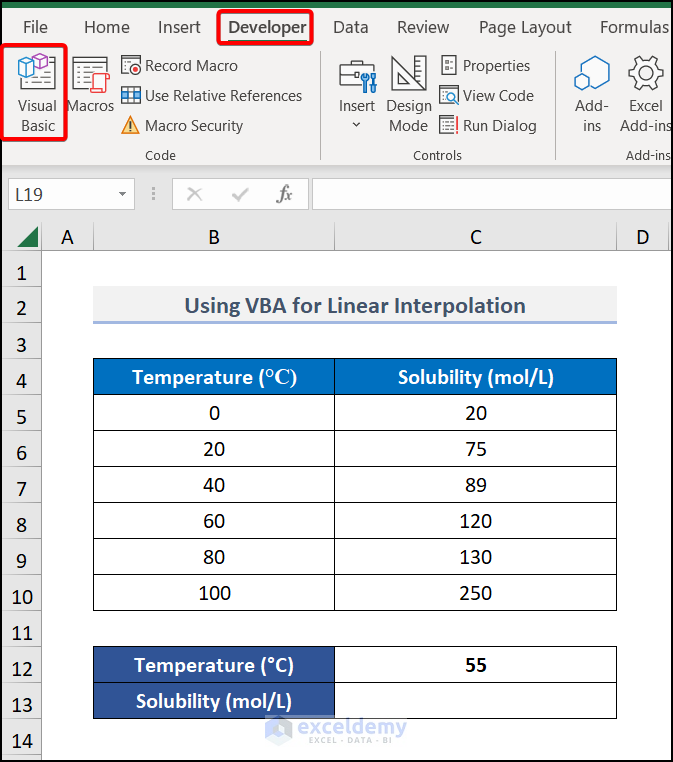
Step 2 – Open the Visual Basic Editor
- To create a User Defined Function in Excel, go to the Developer tab and select Visual Basic.
- In the Visual Basic Editor, choose Insert >> Module >> Module1.
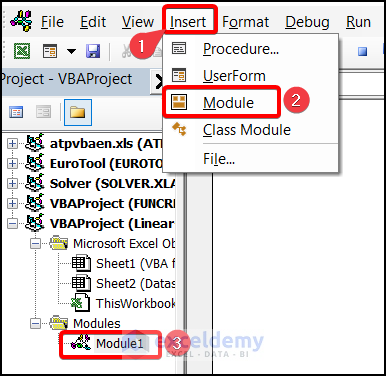
Note: You can also open the Visual Basic Editor pressing ALT + F11.
Step 3 – Enter VBA code
- In Module 1, use the following code.
Function Lin(x, w, v)
a = Application.WorksheetFunction.Index(w, Application.WorksheetFunction.Match(x, w, 1))
b = Application.WorksheetFunction.Index(w, Application.WorksheetFunction.Match(x, w, 1) + 1)
c = Application.WorksheetFunction.Index(v, Application.WorksheetFunction.Match(x, w, 1))
d = Application.WorksheetFunction.Index(v, Application.WorksheetFunction.Match(x, w, 1) + 1)
Lin = c + ((d - c) * (x - a) / (b - a))
End Function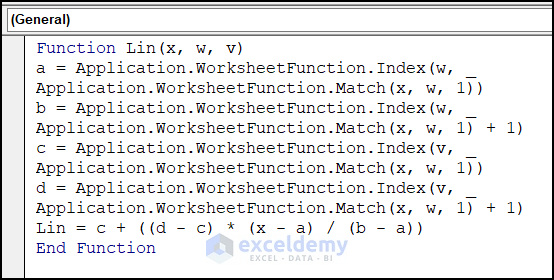
Code Breakdown
The Lin function is declared. WorksheetFunction Index and Match is called. The VBA Match function finds the relative position of the largest value of w and v which is the range of data in your dataset. The VBA Index function will return the largest value obtained by the Match function. The same formula is used for the y value of w, but +1 is inserted in the value after the largest value. c and d, which are the coordinates of point v are set.
Step 4- Use the Function
- Run the code by pressing F5.
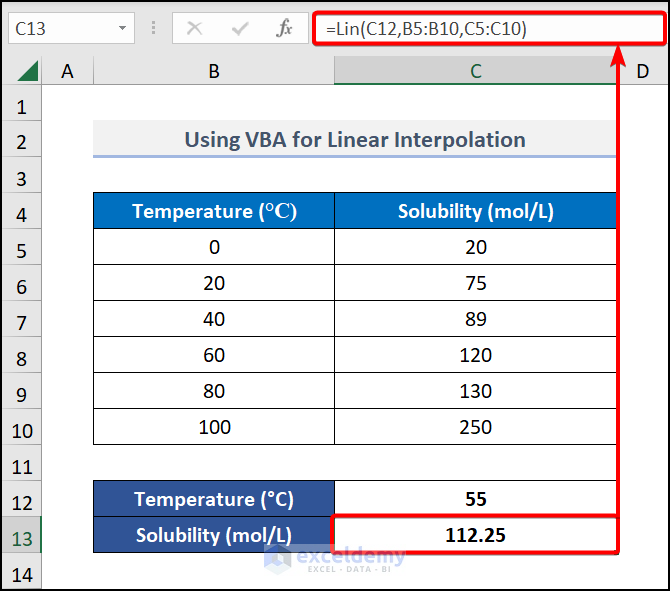
- Go to C13 and enter the formula.
=Lin(C12,B5:B10,C5:C10)C12 is the known x value. B5:B10 is the range of the w value, and C5:C10 is the range of the v value.
The custom Lin function will perform linear interpolation.
- Press ENTER.
This is the output.
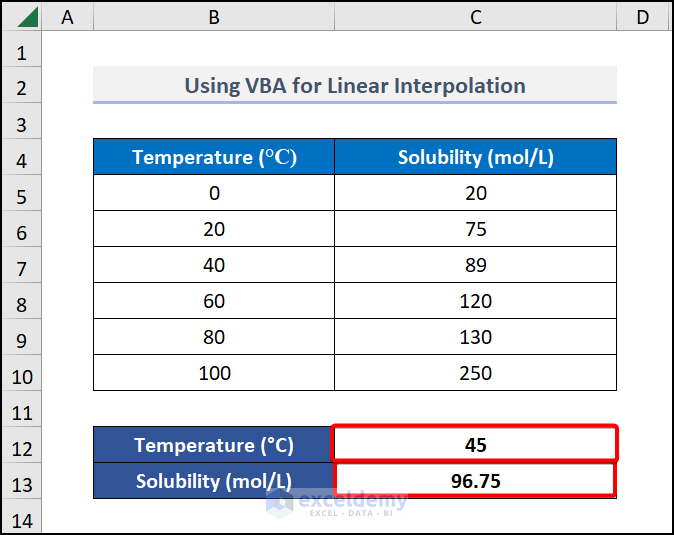
If you change the known value of Temperature, the Solubility changes. See the image below.
Read More: How to Use Non Linear Interpolation in Excel
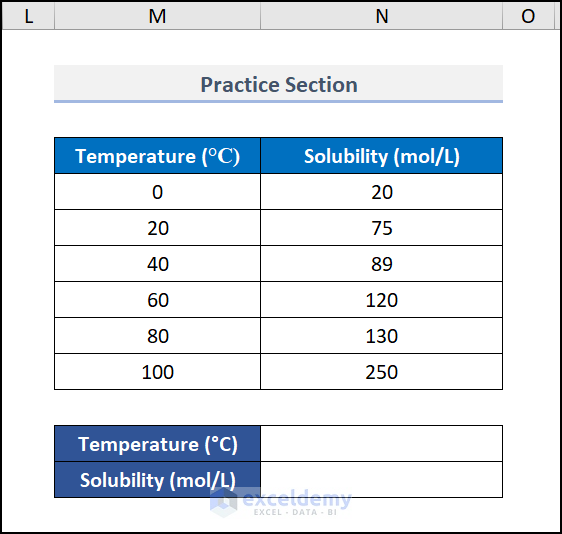
Practice Section
Practice here.
Download Practice Workbook
Download the following practice workbook.
Related Articles
- How to Interpolate Missing Data in Excel
- How to Do VLOOKUP and Interpolate in Excel
- How to Do Interpolation with GROWTH & TREND Functions in Excel
- How to Interpolate Between Two Values in Excel
- How to Perform Bilinear Interpolation in Excel
- How to Interpolate in Excel Graph
<< Go Back to Excel Interpolation | Excel for Statistics | Learn Excel
Get FREE Advanced Excel Exercises with Solutions!
