Interpolation is the process of determining the value of an unknown point that lies between two known data points. While calculating linear interpolation is an easy task in Excel, non-linear datasets can be significantly more challenging. We can use logarithmic graphs to convert a non-linear equation into a linear one, making it suitable to interpolate unknown values.
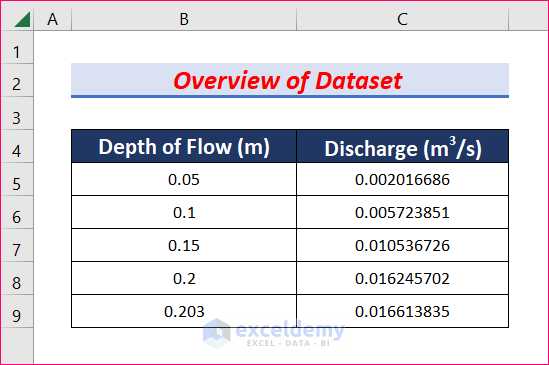
In this article, we will demonstrate two easy methods to calculate logarithmic interpolation in Excel effectively. We will use the following dataset to illustrate our methods:
Method 1 – Using a Mathematical Formula
Steps:
Let’s assume Depth of Flow = X and Discharge = Y.
- Insert two columns named LogX and LogY.
- In cell D5 enter the following formula:
=LOG10(B5)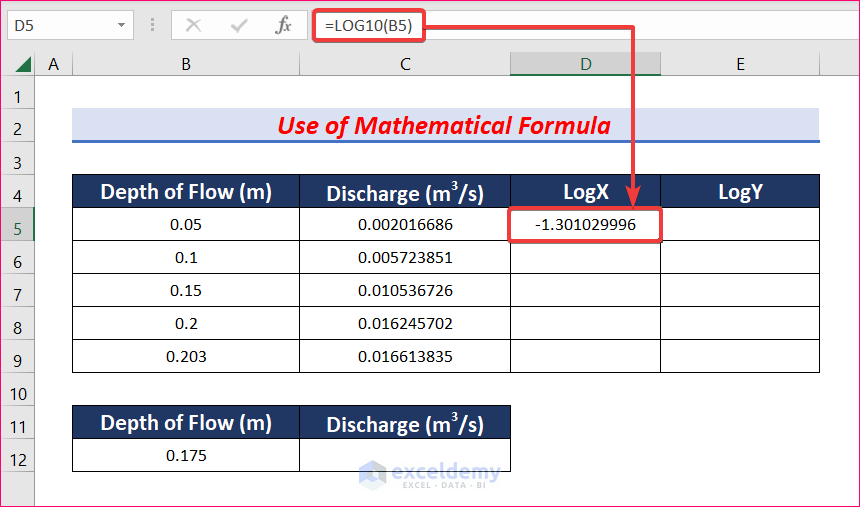
- In cell E5 enter the following formula:
=LOG10(C5)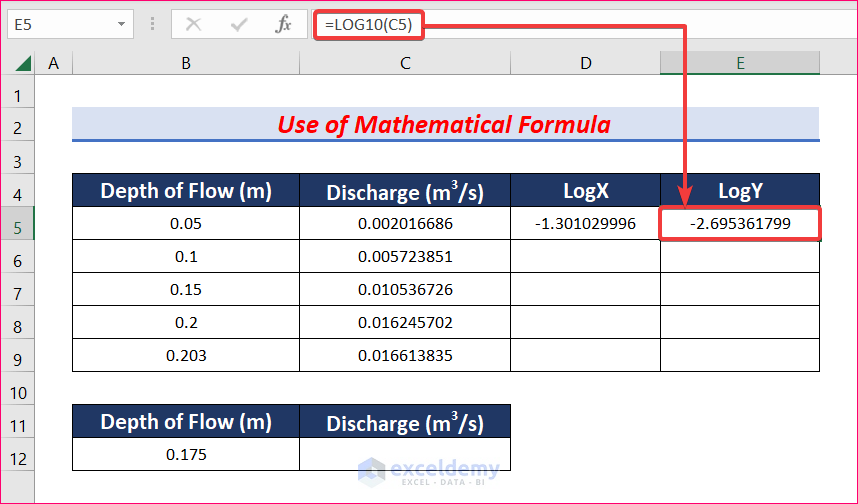
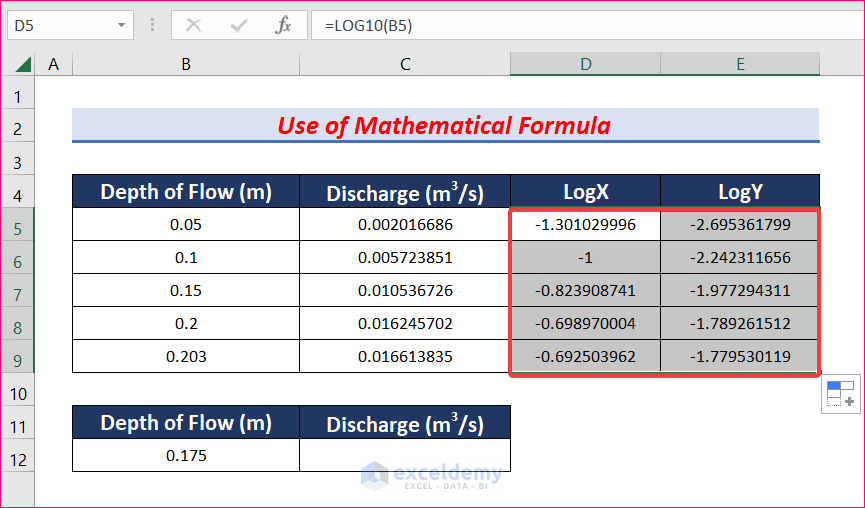
- Autofill the formula to the rest of columns D and E.
Now, we want to calculate the value of Discharge for a 0.175m Depth of Flow.
- In cell D12 enter the following formula to determine LogX for 0.175m Depth of Flow:
=LOG10(B12)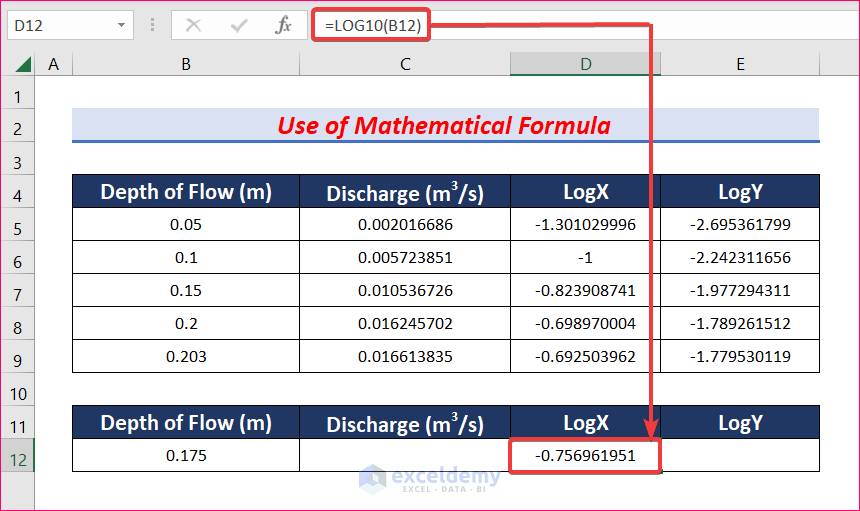
- In cell E12 enter the formula below and press Enter:
=E7+((E8-E7)/(D8-D7))*(D12-D7)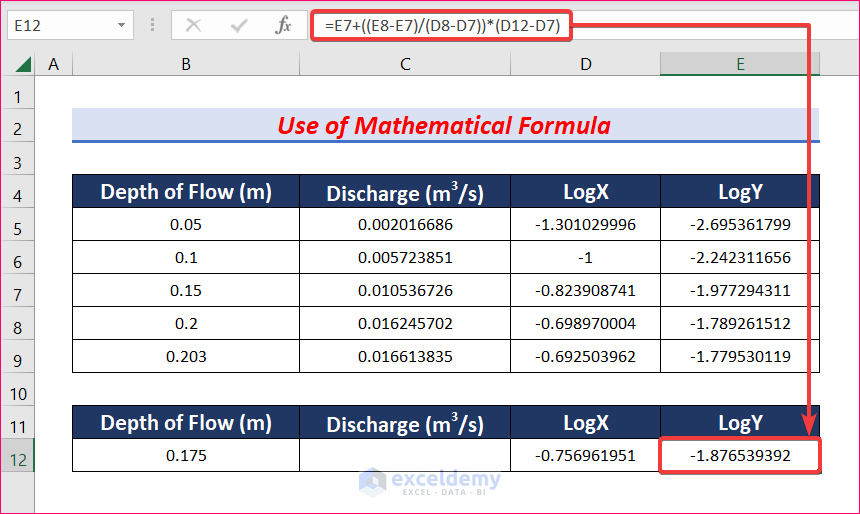
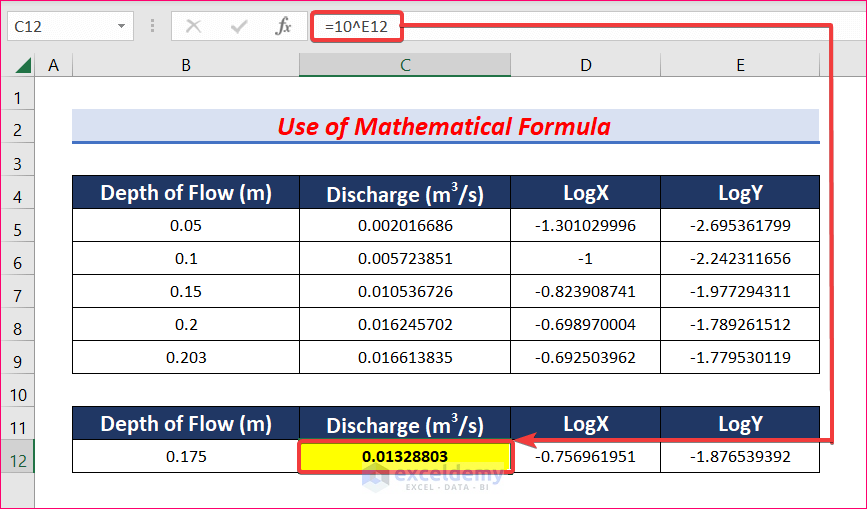
- In cell C12 enter the following formula:
=10^E12Where E12 is the value of LogY.
- Press Enter to get the interpolated Discharge value for 0.175m Depth of Flow.
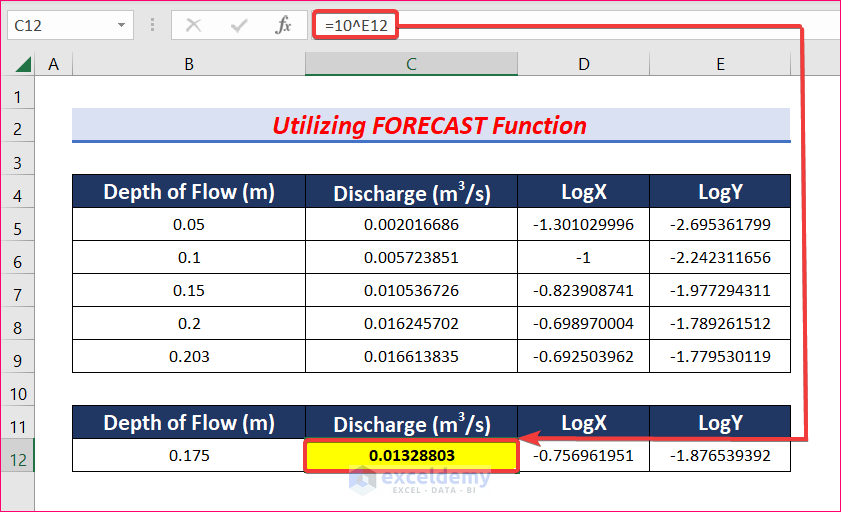
Method 2 – Using the FORECAST Function
We can also use the FORECAST function to determine logarithmic interpolation in Excel.
Steps:
- Follow the same steps as the first method up to calculating LogX for a 0.175m Depth of Flow.
- In cell E12 enter the following formula:
=FORECAST(D12,E5:E9,D5:D9)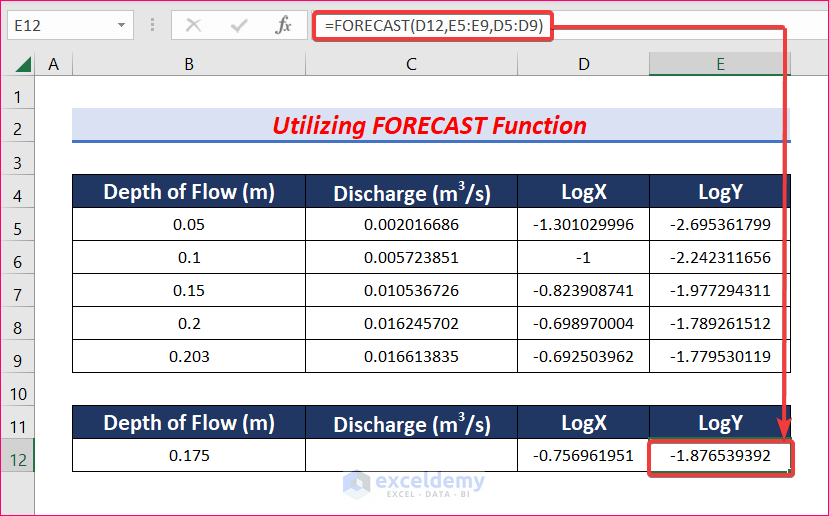
- In cell C12 enter the following formula:
=10^E12- Press Enter to get the desired Discharge value for 0.175m Depth of Flow.
- These two methods give accurate results if the LogY vs LogX graph is linear.
- Don’t forget to provide proper cell references or you won’t get the desired result.
Download Practice Workbook
Related Articles
- How to Do 2D Interpolation in Excel
- 3D Interpolation in Excel
- How to Perform Exponential Interpolation in Excel
- How to Do Polynomial Interpolation in Excel
- How to Interpolate Time Series in Excel
- How to Apply Cubic Spline Interpolation in Excel
<< Go Back to Excel Interpolation | Excel for Statistics | Learn Excel
Get FREE Advanced Excel Exercises with Solutions!
