Microsoft Excel is an intuitive tool that more than lives up to its excellent reputation. Thanks to Excel’s tools and functions, we can perform various actions on a dataset. Excel is frequently used to calculate values between two data points, and interpolation permits us to make reasonable guesses regarding potential deals. This article will explain three straightforward methods for interleaving time sequences. Use one of the following three methods if you wish to Interpolate Time Series in Excel.
What Is Interpolation?
Interpolation is predicting or calculating an unknown variable within two known volumes. In other words, interpolation is deducing a value based on the values already present in a dataset. Some interpolation techniques are simple to implement and take little time, but they can’t be relied upon to provide accurate results. However, interpolation is handy when we need to enlarge or reduce quantities. It is usually used to figure out the unknown quantities for any regionally linked sample points, including sound intensity, temperature, topography, etc.
Interpolate Time Series in Excel: 3 Suitable Ways
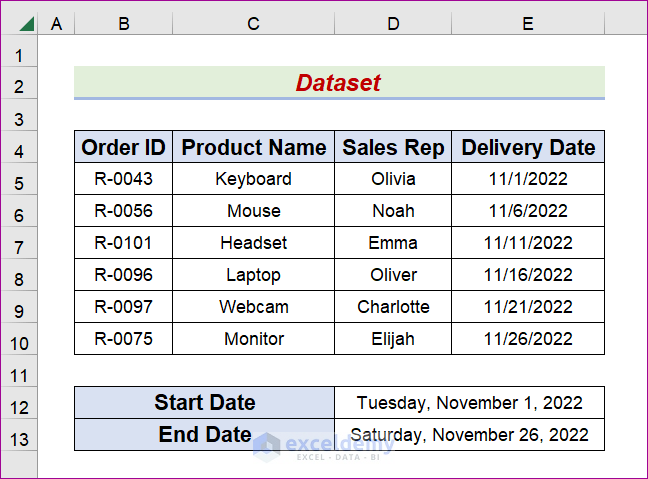
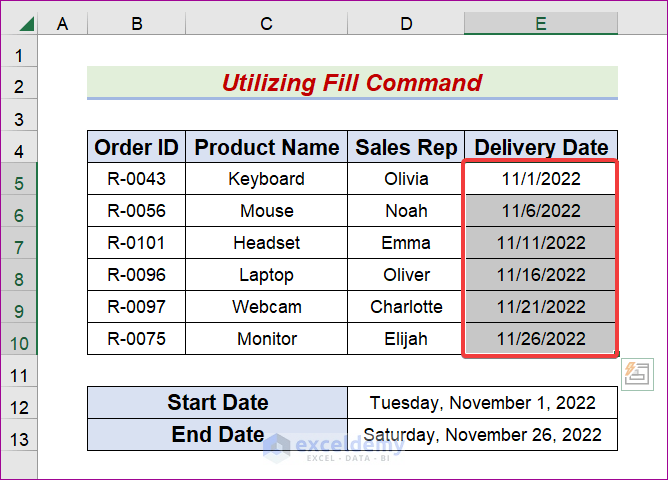
For the sake of providing an example, let’s investigate a sample dataset. For instance, the following dataset has four columns: Order ID, Product Name, Sales Rep, and Delivery Date. In addition, there are two more pieces of information named Start Date and End Date. We will use these three approaches to interpolate a time sequence throughout the Delivery Date column.
In addition, I have yet to say that I have been working with the Microsoft Excel 365 version for this post. Nevertheless, you are free to use any other edition that will provide you with the most significant amount of convenience.
1. Utilize Fill Command to Interpolate Time Series in Excel
Using Excel’s Fill Command feature, you may automatically fill a set of cells with similar content or with a collection of numbers or letters. The Fill Series feature under the Editing group on the Home tab is the quickest way to fill in the missing information. To complete the task, please refer to the instructions provided below.
STEPS:
- First, choose E5 and input the Start Date, then select E10 to type the End Date.
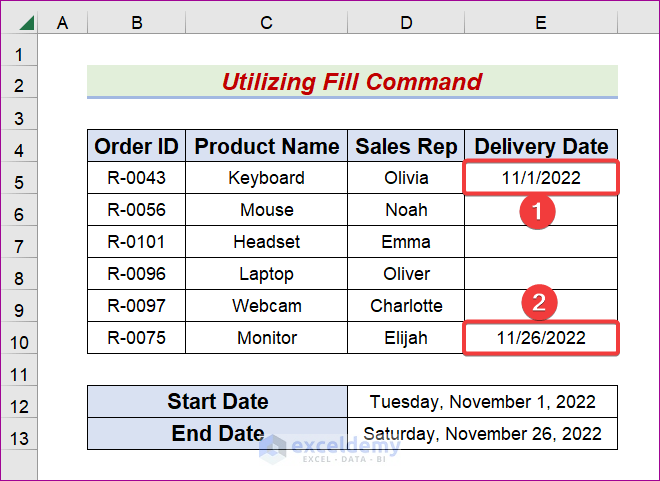
- Secondly, pick the E5:E10 range.
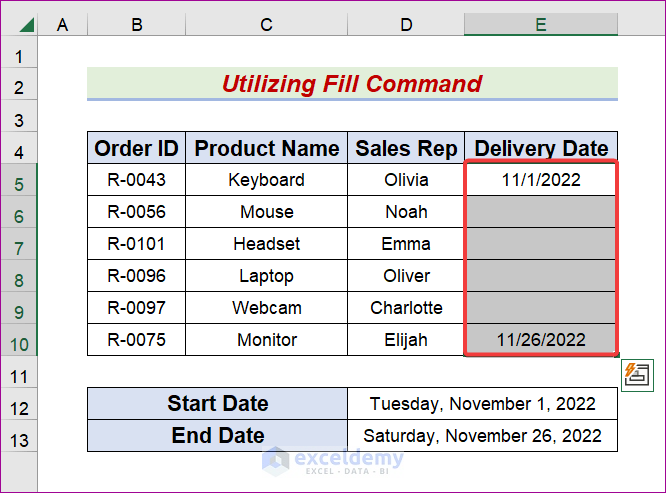
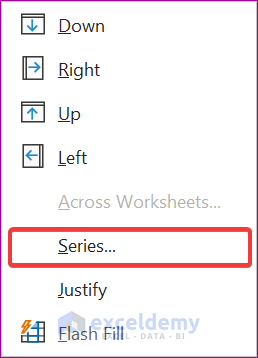
- Third, go to the Home tab and choose the Fill Command icon from the Editing group.
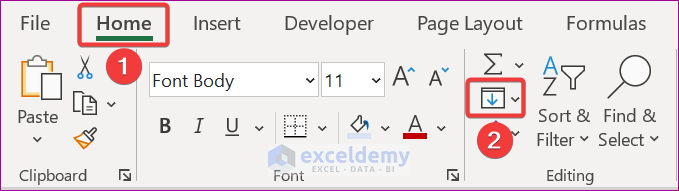
- After that, select the Series option from the drop-down.
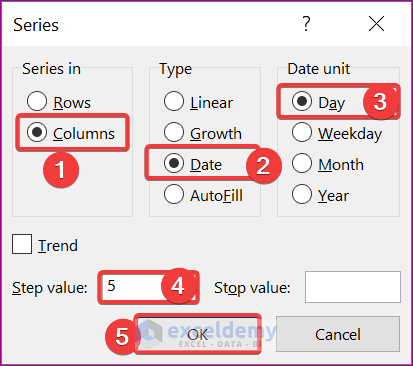
- Subsequently, the Series window will appear and check Columns, Date, and Day.
- Later, input 5 in the Step Value section and hit OK.
- Consequently, it will produce the desired output like the below one.
2. Combine SEQUENCE and DATE Functions to Interpose a Time Series
The SEQUENCE function generates a sequence of numeric values in different formats in Microsoft Excel. If we give the DATE function the day, month, and year, it will return a valid date. We will combine these functions throughout this context and generate a formula to interpose a time sequence in Excel. Please adhere to the steps described below to complete the work effectively.
STEPS:
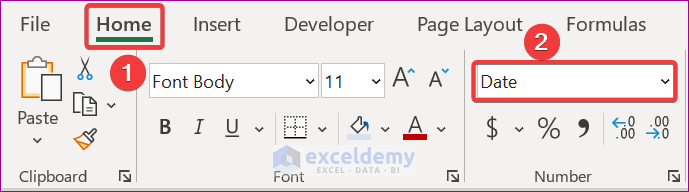
- To begin, select the E5:E10 range.
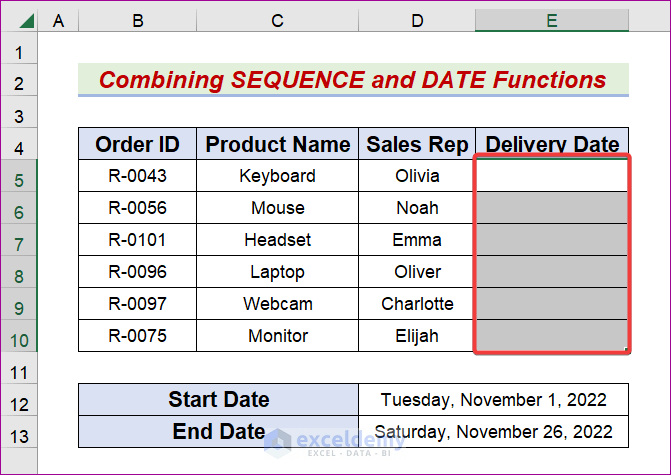
- Second, go to the Home tab and choose Date.
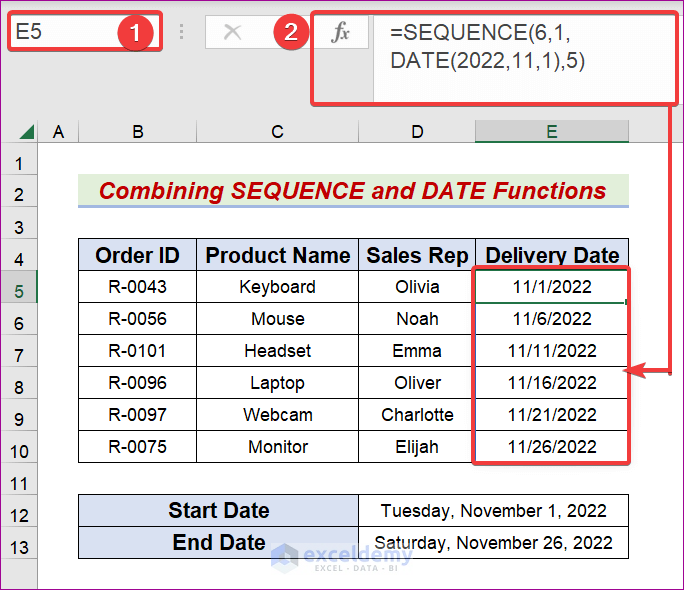
- After that, pick the E5 cell.
- Then, input the following equation in the Formula bar.
=SEQUENCE(6,1,DATE(2022,11,1),5)
- Finally, hit the Enter or Tab key to get the intended output, like the following.
=SEQUENCE(6,1,DATE(2022,11,1),5)
For this formula to make sense, you need to know how to use the following Excel functions:
SEQUENCE and DATE Functions
- DATE(2022,11,1)
When you input a date into the DATE function, it will produce a serial number corresponding to that date. In this demonstration, by involving the DATE function in the combination, we find- 44866.
- SEQUENCE(6,1,DATE(2022,11,1),5)
The SEQUENCE function constructs a numerical sequence. Therefore, we apply the Date Number format to each cell. Here, the SEQUENCE function will generate a list of 6 rows in 1 column.
Utilizing the SEQUENCE function, we get – {44866;44871;44876;44881;44886;44891}
3. Run Excel VBA Code to Interpolate a Time Sequence
Visual Basic for Applications can be abbreviated as VBA. Microsoft was the company that initially developed VBA. We can use Excel’s incompatible features if we write the appropriate code in VBA. Following this tutorial, you will learn how to interpolate a time series using the Visual Basic for Applications (VBA) tool in Excel. Please finish the task keeping these instructions in mind.
STEPS:
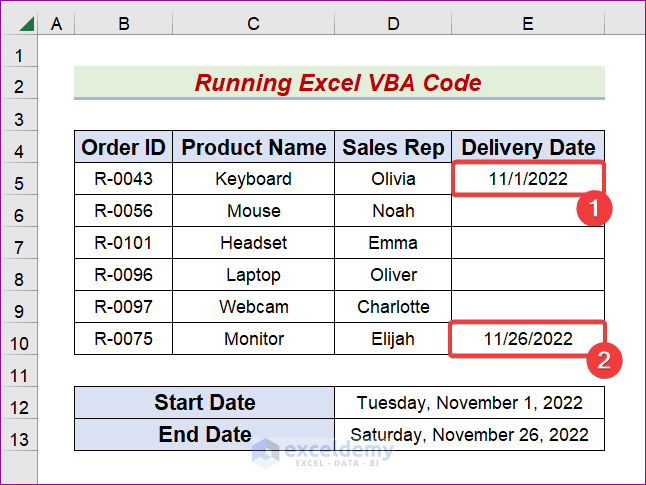
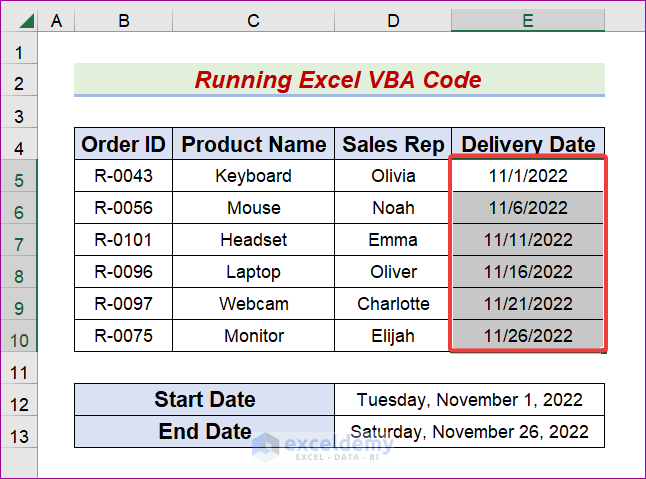
- First, pick E5 and enter the Start Date, then select E10 for the End Date.
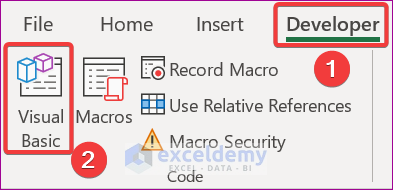
- Second, navigate to the Developer tab and choose Visual Basic.
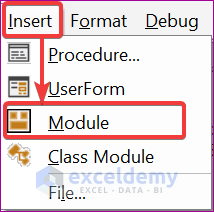
- After that, click on,
Insert → Module
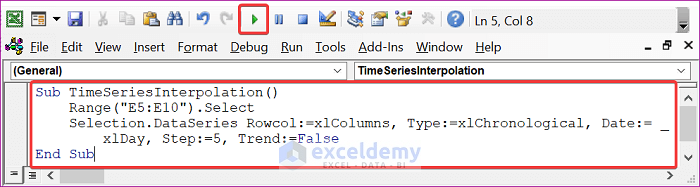
- Presently, write the code below in the Module box.
Sub TimeSeriesInterpolation()
    Range("E5:E10").Select
    Selection.DataSeries Rowcol:=xlColumns, Type:=xlChronological, Date:= _
        xlDay, Step:=5, Trend:=False
End Sub- Latterly, press F5 or click on the Save icon.
- As a result, we will get the desired output like the below one.
Download Practice Workbook
You are cordially invited to get a free copy of the example workbook used during the presentation, and we thank you in advance for accepting this invitation.
Conclusion
By following the steps we have just gone through, you will now be able to Interpolate Time Series in Excel. Further articles on the ExcelDemy Website are like this one. Continue to use them, and let us know if you come up with any new ideas or techniques for finishing the assignment. You are welcome to submit any questions, comments, or suggestions in the below-mentioned area.
Related Articles
- How to Do 2D Interpolation in Excel
- 3D Interpolation in Excel
- How to Calculate Logarithmic Interpolation in Excel
- How to Perform Exponential Interpolation in Excel
- How to Do Polynomial Interpolation in Excel
- How to Apply Cubic Spline Interpolation in Excel
<< Go Back to Excel Interpolation | Excel for Statistics | Learn Excel
Get FREE Advanced Excel Exercises with Solutions!
