


Financial analysts regularly work with revenue, expenses, budgets, investments, loans, and forecasts. Excel provides several functions that make these calculations faster and more accurate. Mastering a core set of functions dramatically improves speed, accuracy, and flexibility.
In this tutorial, we will cover 10 essential Excel functions for financial analysts with practical examples.
1. SUMIFS – Sum Financial Data with Multiple Criteria
The SUMIFS function adds values that meet multiple conditions. It is especially useful when analyzing revenue, expenses, budgets, or transactions.
Syntax:
=SUMIFS(sum_range,criteria_range1,criteria1,[criteria_range2,criteria2],...)
To calculate the total revenue generated in the East region from the category Laptop, use:
=SUMIFS(H2:H51,B2:B51,"East",C2:C51,"Laptop")
The formula sums values from column H only when the region is East and the category is Laptop.
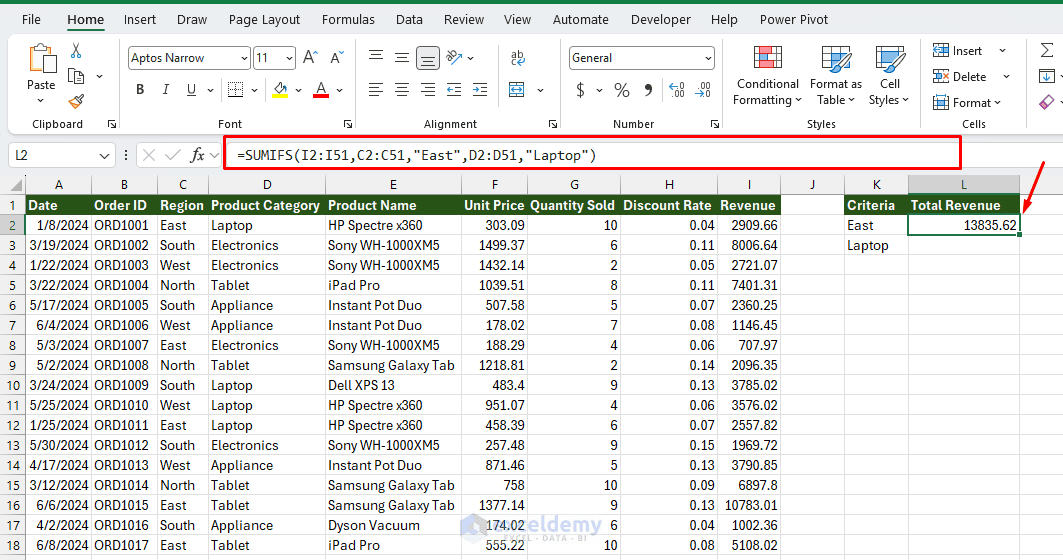
Why it matters for analysts: Budget vs. actuals analysis, departmental expense summaries, and cohort-based revenue calculations all rely on conditional aggregation. SUMIFS is faster and more transparent than array formulas or pivot table workarounds for these tasks.
2. XLOOKUP – Retrieve Financial Data Dynamically
The XLOOKUP function retrieves matching information from another table. Financial models often contain separate assumption tables for tax rates, interest rates, margins, exchange rates, or product prices.
Syntax:
=XLOOKUP(lookup_value,lookup_array,return_array,[if_not_found])
Suppose you want to retrieve the revenue of a particular product for a financial analysis, use:
=XLOOKUP(K6,B2:B51,I2:I51,"Not Found")
This looks up the value in K6 within column B and returns the corresponding value from the Revenue column. If no match is found, it returns “Not Found” instead of an error.
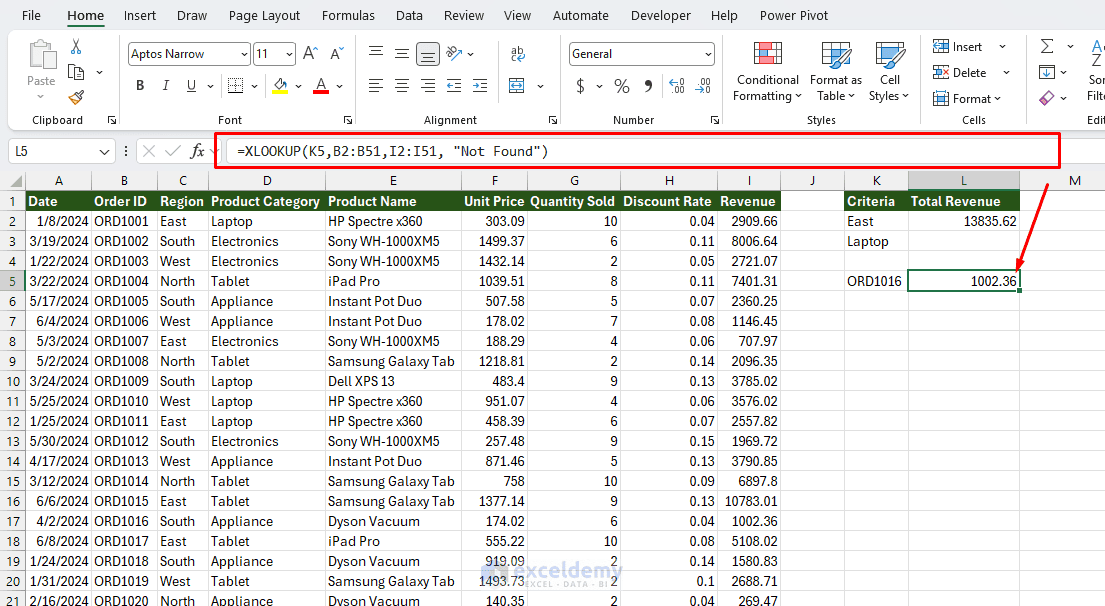
Why it matters for analysts: Unlike VLOOKUP, XLOOKUP can search left-to-right or right-to-left, doesn’t break when columns are inserted, and defaults to exact match, eliminating one of the most common sources of spreadsheet errors. It’s ideal for pulling account balances, pricing data, or employee records from reference tables.
3. AVERAGEIFS – Calculate Conditional Averages
The AVERAGEIFS function calculates the average of values that meet multiple conditions.
Syntax:
=AVERAGEIFS(average_range,criteria_range1,criteria1,[criteria_range2,criteria2],...)
Suppose you want to calculate the average revenue for the East region for Laptop.
=AVERAGEIFS(I2:I51,C2:C51,"East",D2:D51,"Laptop")
Excel averages only the amounts where the region is East and the category is Laptop.
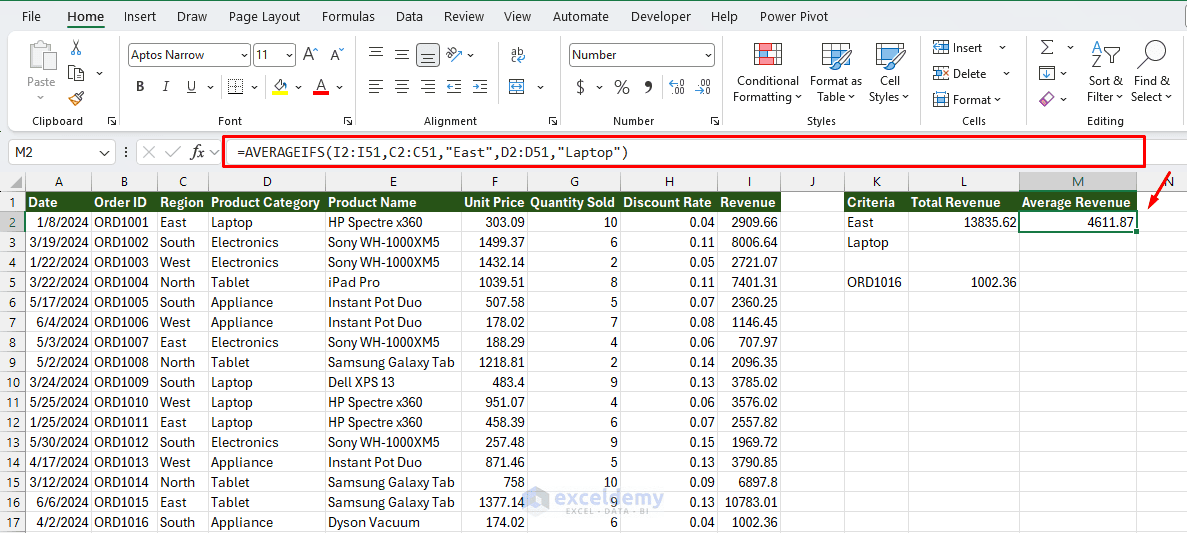
Why it matters for analysts: Average deal size by sales rep and quarter, average days sales outstanding by customer segment, average margin by product line.
4. IF/IFS – Apply Financial Decision Logic
Financial models often require different calculations depending on whether certain conditions are met. The IF and IFS functions allow analysts to build this logic directly into a worksheet.
IF Syntax:
=IF(logical_test,value_if_true,value_if_false)
=IFS(logical_test1,value_if_true1,[logical_test2,value_if_true2],...)
To classify the result as profitable or unprofitable, enter:
=IF(K2>2000,"Profit","Loss")
Using IFS for Multiple Conditions
Suppose a company’s profit margin is stored in E2, and you want to classify performance as:
- Excellent: 25% or more
- Good: 15% or more
- Average: 5% or more
- Poor: below 5%
Insert the following formula:
=IFS(L2>=25%,"Excellent",L2>=15%,"Good",L2>=5%,"Average",TRUE,"Poor")
Excel checks each condition in sequence and returns the result corresponding to the first TRUE condition.
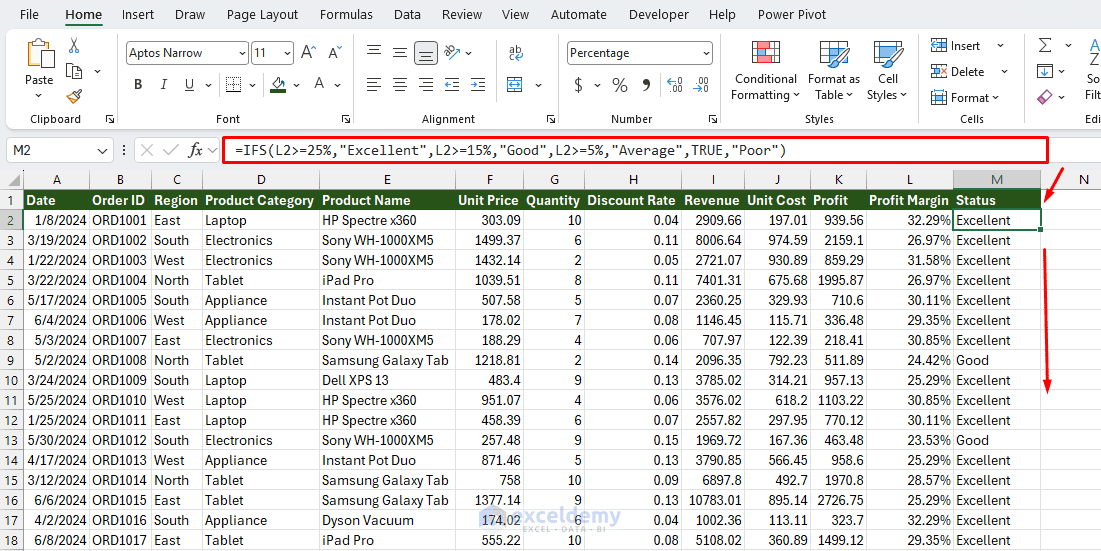
Why it matters for analysts: Classifying performance (Above/Below target), applying different discount rates, flagging covenant breaches, creating scenario switches.
5. NPV – Calculate Net Present Value
The NPV function calculates the present value of future cash flows using a specified discount rate.
Syntax:
=NPV(rate,value1,[value2],...)
Suppose a company is considering a project requiring an initial investment of $100,000 and a discount rate of 10%.
=NPV(10%,B3:B7)+B2
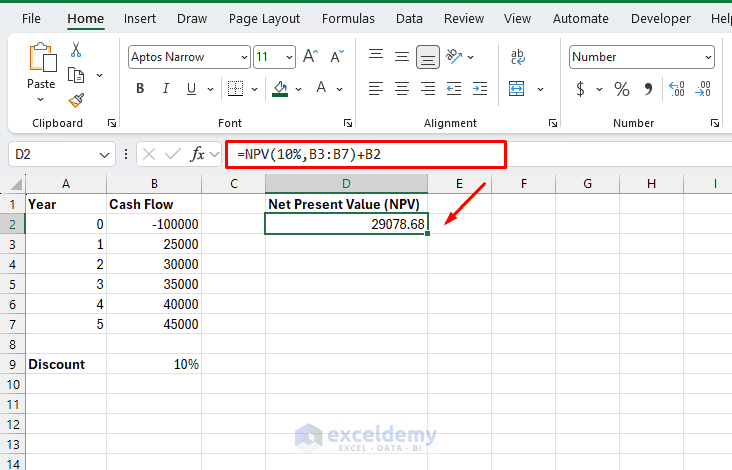
The future cash flows are included inside NPV, while the initial investment is added separately. This is because Excel assumes the values supplied to NPV occur at the end of future periods.
Interpretation:
- Positive NPV: The investment may create value.
- Negative NPV: The investment may not meet the required return.
- NPV = 0: The investment earns approximately the discount rate.
Why it matters for analysts: NPV is central to investment appraisal, DCF (discounted cash flow) valuation, and capital expenditure decisions. Understanding its quirks — especially the timing assumption — is essential to avoid a common and costly modeling mistake.
6. XNPV – Calculate NPV with Irregular Dates
The XNPV function calculates net present value using the actual dates of cash flows. Unlike NPV, it does not assume that all transactions occur at equally spaced intervals.
If the dates are in F2:F6 and cash flows are in G2:G6, enter:
=XNPV(10%,G2:G6,F2:F6)
Excel discounts each cash flow according to its exact timing.
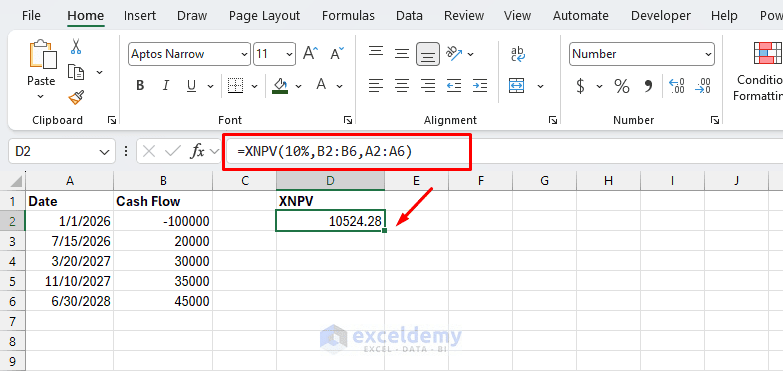
NPV vs. XNPV:
- Use NPV when cash flows occur at regular intervals.
- Use XNPV when cash flows occur on specific or irregular dates.
Why it matters for analysts: XNPV is particularly useful for real-world project cash flows, private equity distributions, venture capital, real estate investments, acquisition models, projects with irregular payments, and any analysis where timing is uneven.
7. IRR and XIRR – Calculate Investment Returns
The IRR and XIRR functions calculate the internal rate of return of an investment. The main difference is how Excel handles the timing of cash flows.
IRR:
Use IRR when cash flows occur at regular intervals.
Syntax:
=IRR(values,[guess])
Using the project cash flows in B2:B7, enter:
=IRR(B2:B7)
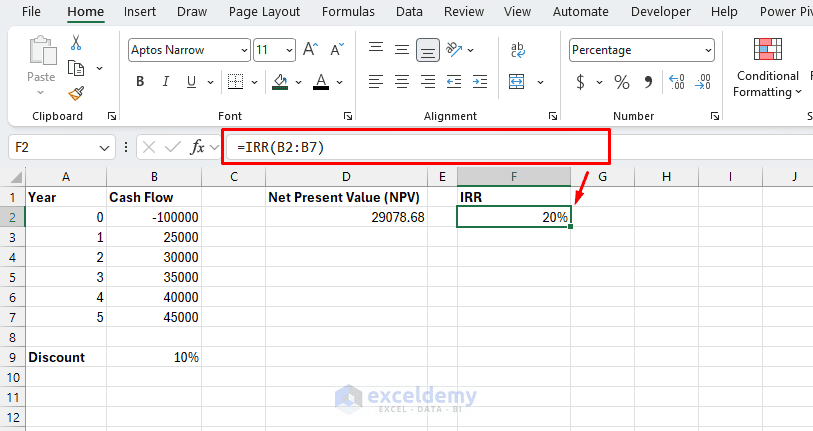
Format the result as a percentage. The IRR represents the discount rate at which the project’s NPV equals approximately zero.
XIRR:
Use XIRR when cash flows occur on specific dates.
Syntax:
=XIRR(values,dates,[guess])
Using the irregular cash-flow dataset, enter:
=XIRR(B2:B6,A2:A6)
XIRR calculates an annualized return while accounting for the exact timing of each transaction.
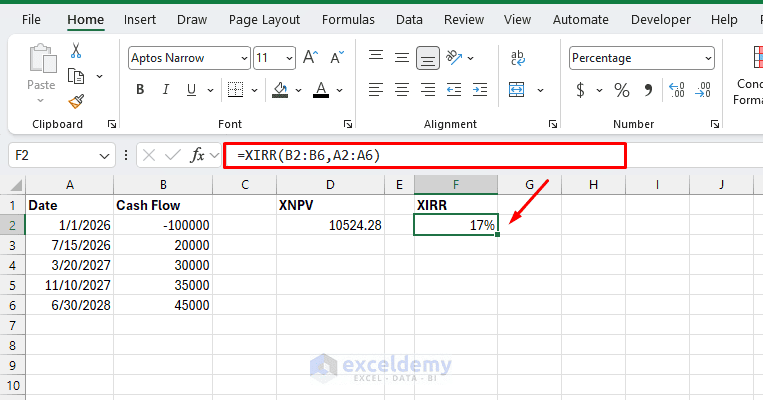
Why XIRR Is Often Better Than IRR
Suppose one investment produces a cash flow after 30 days, while another produces the same cash flow after 300 days. IRR may treat them as equivalent if both are entered as consecutive periods. XIRR recognizes the timing difference.
IRR vs. XIRR:
| Function | Best Used When |
| IRR | Cash flows occur regularly |
| XIRR | Cash flows occur on irregular dates |
8. PMT – Calculate Loan Payments
The PMT function calculates the periodic payment required for a loan with a constant interest rate.
Syntax:
=PMT(rate,nper,pv,[fv],[type])
Suppose:
- Loan amount = $200,000
- Annual interest rate = 6%
- Loan term = 10 years
- Payments are monthly
Use the following formula:
=PMT(6%/12,10*12,-200000)
=PMT(B4,B6,-B2)
Here:
- 6%/12 converts the annual rate into a monthly rate.
- 10*12 converts 10 years into 120 months.
- -200000 represents the amount borrowed.
Excel returns the required monthly payment.
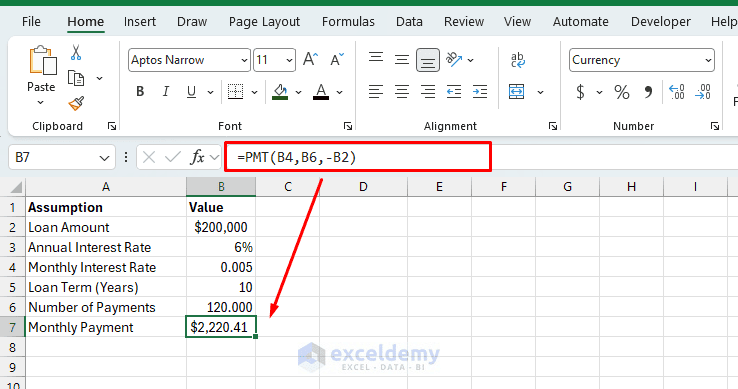
Why it matters for analysts: PMT can be used for mortgage calculations, business loans, equipment financing, lease analysis, and debt structuring — everyday tasks in corporate finance and FP&A roles.
Tip: Rate should be the periodic rate (e.g. annual rate / 12 for monthly).
9. PV and FV – Calculate Present and Future Value
The PV and FV functions are both based on the time value of money. PV converts future money into today’s value, while FV projects today’s money into a future value.
PV Function:
The PV function calculates the current value of a future amount or series of payments.
Syntax:
=PV(rate,nper,pmt,[fv],[type])
Suppose you want to have $500,000 in 15 years, assuming a 7% annual return, use:
=PV(7%,15,0,-500000)
=PV(B2,B3,B4,-B5)
Excel returns the amount that would need to be invested today.
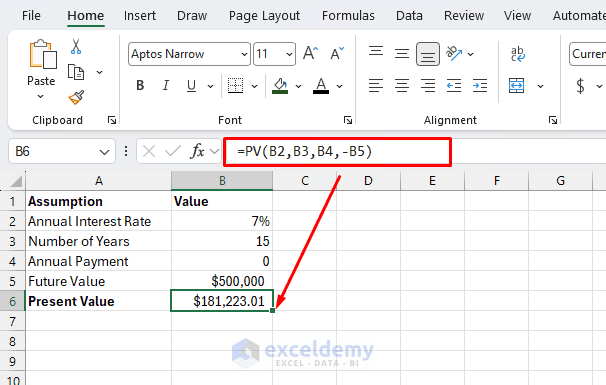
FV Function:
The FV function calculates how much an investment will grow to in the future.
Syntax:
=FV(rate,nper,pmt,[pv],[type])
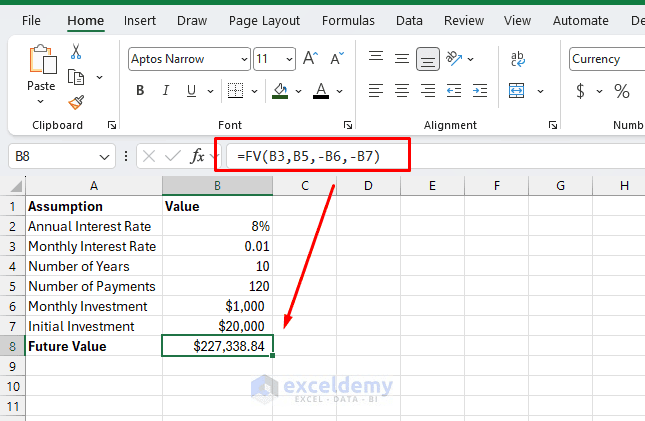
Suppose you invest $1,000 per month for 10 years and expect an annual return of 8%, use:
=FV(8%/12,10*12,-1000,0)
Excel returns the estimated future value of the investment.
If you already have an initial investment of $20,000, use:
=FV(8%/12,10*12,-1000,-20000)
=FV(B3,B5,-B6,-B7)
PV vs. FV
| Function | Purpose |
| PV | Determines what future money is worth today |
| FV | Determines what today’s money may be worth in the future |
Why it matters for analysts: PV and FV are useful for investment planning, valuing bonds or annuities, retirement planning, and determining how much a series of cash flows is worth today or will grow to in the future.
10. RATE – Determine the Interest Rate
The RATE function calculates the interest rate required for a loan or investment.
Syntax:
=RATE(nper,pmt,pv,[fv],[type],[guess])
Suppose:
- Loan amount = $100,000
- Monthly payment = $1,100
- Loan term = 10 years
Use the following formula:
=RATE(10*12,-1100,100000)*12
=RATE(B5,-B3,B2)*12
RATE first calculates the monthly interest rate. Multiplying by 12 converts it into an approximate annual nominal rate.
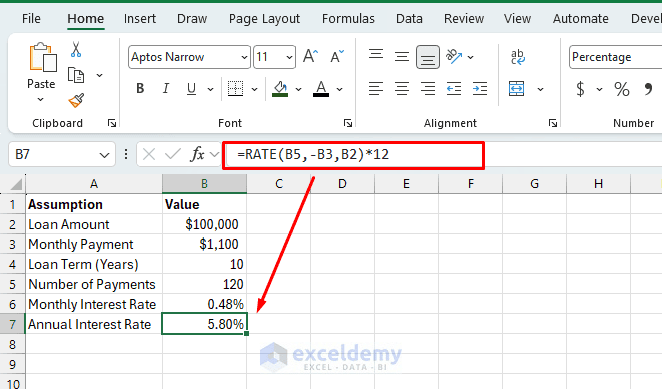
Why it matters for analysts: RATE can be used to estimate borrowing costs, compare loan offers, analyze financing arrangements, and determine investment return requirements.
Summary of Essential Excel Functions for Financial Analysts
| Function | Primary Use |
| SUMIFS | Sum financial data using multiple criteria |
| XLOOKUP | Retrieve values from financial tables |
| AVERAGEIFS | Calculate conditional averages |
| IF/IFS | Apply financial decision logic |
| NPV | Calculate net present value |
| XNPV | Calculate NPV using exact dates |
| IRR/XIRR | Calculate investment returns |
| PMT | Calculate periodic loan payments |
| PV/FV | Calculate present and future values |
| RATE | Determine interest rates |
Conclusion
These are the 10 essential Excel functions financial analysts can rely on. Excel’s financial functions are important, but financial analysts also rely heavily on general-purpose functions for summarizing and retrieving data. SUMIFS, XLOOKUP, AVERAGEIFS, and IFS are particularly useful for everyday financial analysis and reporting. NPV, XNPV, IRR, and XIRR help evaluate investments, while PMT, PV, FV, and RATE are essential for loan and time-value-of-money calculations. Learning these functions provides a strong foundation for building financial models, analyzing investments, preparing reports, and making data-driven financial decisions in Excel.
Get FREE Advanced Excel Exercises with Solutions!


Very full useful insights,excellent recaps.
Congratulations to Shamima,from the other side of the world.
Hello Javier Martinez,
You are most welcome. Thanks for your feedback and appreciation. I am glad to hear that you liked our tutorial.
Keep exploring Excel with ExcelDemy!
Regards,
ExcelDemy