


Data analysis in Excel doesn’t have to mean endless manual sorting and filtering. Excel offers hundreds of functions, but you only need a small set of powerful ones to handle most everyday data analysis tasks. Whether you are summarizing sales, filtering records, finding unique values, or looking up information, the right functions can significantly reduce manual work.
In this tutorial, we will list 10 Excel functions to simplify your data analysis. These ten functions cover lookups, aggregation, and dynamic arrays — the core toolkit for turning raw spreadsheets into real insight.
1. XLOOKUP – Find Matching Information
The modern replacement for VLOOKUP and HLOOKUP. XLOOKUP searches a range for a match and returns a corresponding value from another range, in either direction, without worrying about column order.
Syntax:
=XLOOKUP(lookup_value, lookup_array, return_array, [if_not_found])
Suppose you want to know the sales amount for a particular order from the sales dataset. If a cell contains an Order ID, use:
=XLOOKUP(K2,B2:B51,I2:I51,"Not Found")
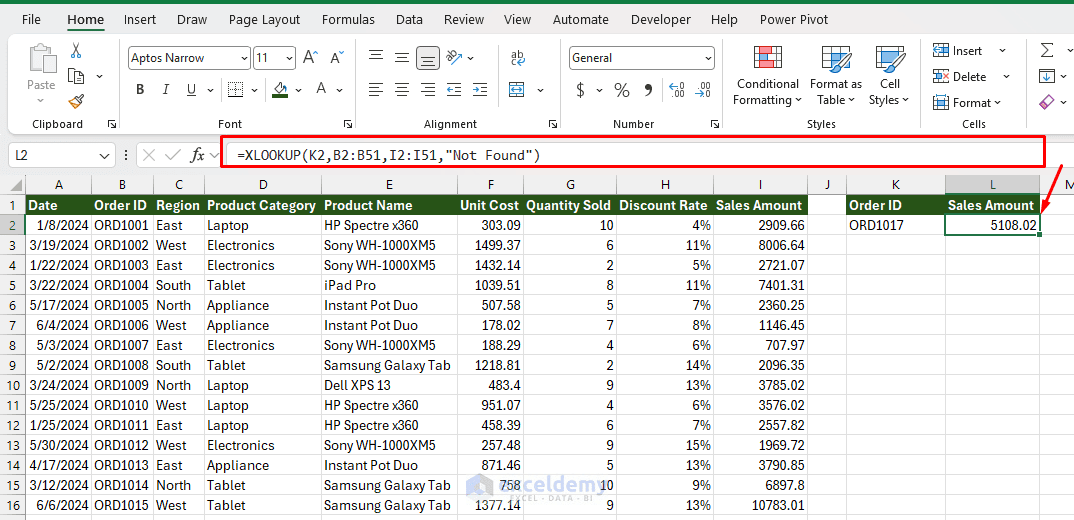
Excel finds the Order ID and returns its corresponding sales amount. Unlike VLOOKUP, XLOOKUP can search both left and right and does not require you to specify a column number.
Why it simplifies analysis: No more counting columns, no #N/A errors cluttering your sheet, and it searches left-to-right or right-to-left with equal ease.
2. INDEX/MATCH (XMATCH) – Find Matching Information (Older Version)
Before XLOOKUP, this combination was the gold standard, and it is still useful for multi-criteria lookups or when working in older Excel versions. INDEX/MATCH is a two-function combo that performs flexible lookups, still relevant even with XLOOKUP available. Excel has since introduced XMATCH as the modern upgrade to MATCH — it supports approximate and exact matching, searches from either end of a range, and works with wildcards natively.
Syntax:
=INDEX(return_range, MATCH(lookup_value, lookup_range, 0))
=INDEX(return_range, XMATCH(lookup_value, lookup_range))
You can perform a similar search operation to XLOOKUP:
=INDEX(I2:I51, MATCH(K2, B2:B51, 0))
=INDEX(I2:I51, XMATCH(K2, B2:B51))
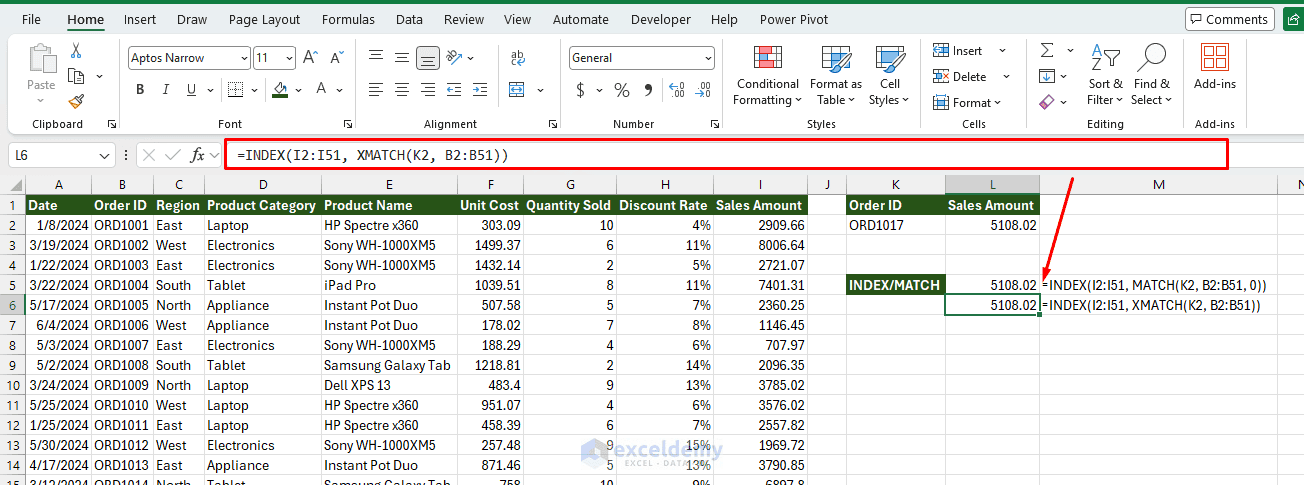
Why it simplifies analysis: It is more flexible than a single lookup function, especially when you need to match on multiple conditions by nesting MATCH with concatenated criteria. XMATCH removes the need to remember match-type codes like the old 0 for exact match.
3. FILTER – Extract Records Dynamically
One of Excel’s dynamic array functions. FILTER pulls out only the rows that meet your criteria and spills them automatically into adjacent cells.
Syntax:
=FILTER(array, include, [if_empty])
Suppose your complete dataset is in A2:I51 and the Region column is in column C. To extract only records belonging to the East region, use:
=FILTER(A2:I51,C2:C51="East","No Records")
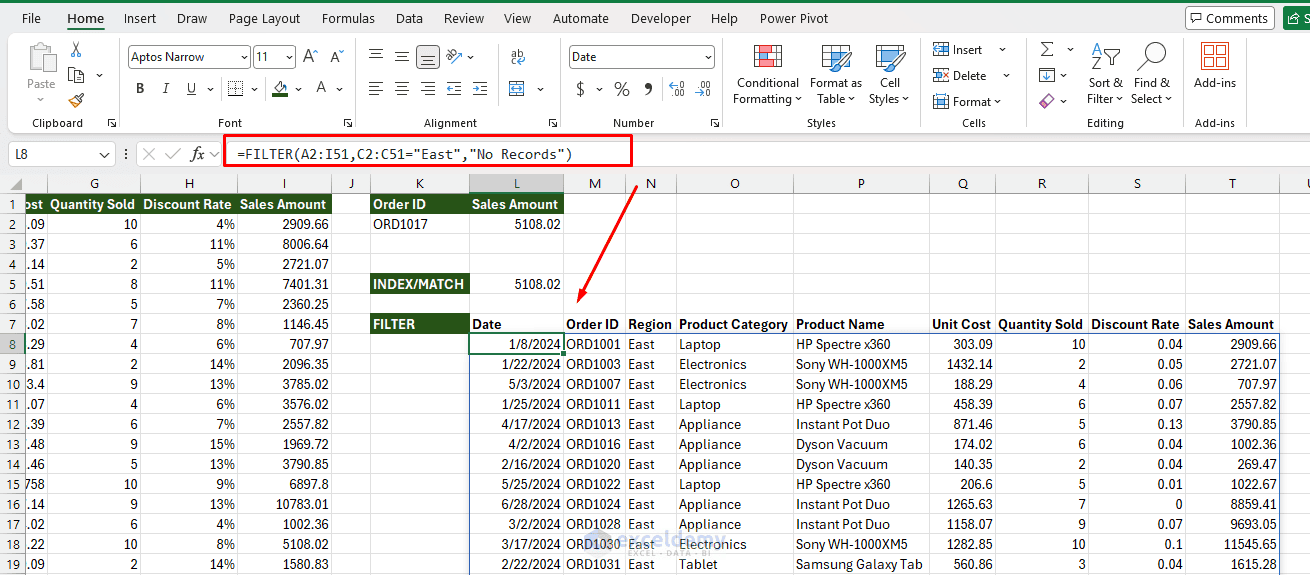
The matching rows spill automatically into neighboring cells. If the source data changes, the filtered results update automatically.
Why it simplifies analysis: It replaces manual AutoFilter clicks or helper columns with a single live formula that updates as your source data changes.
4. UNIQUE – Create a List of Distinct Values
UNIQUE extracts a list of distinct values from a range — no pivot table or manual deduplication required.
Syntax:
=UNIQUE(array, [by_col], [exactly_once])
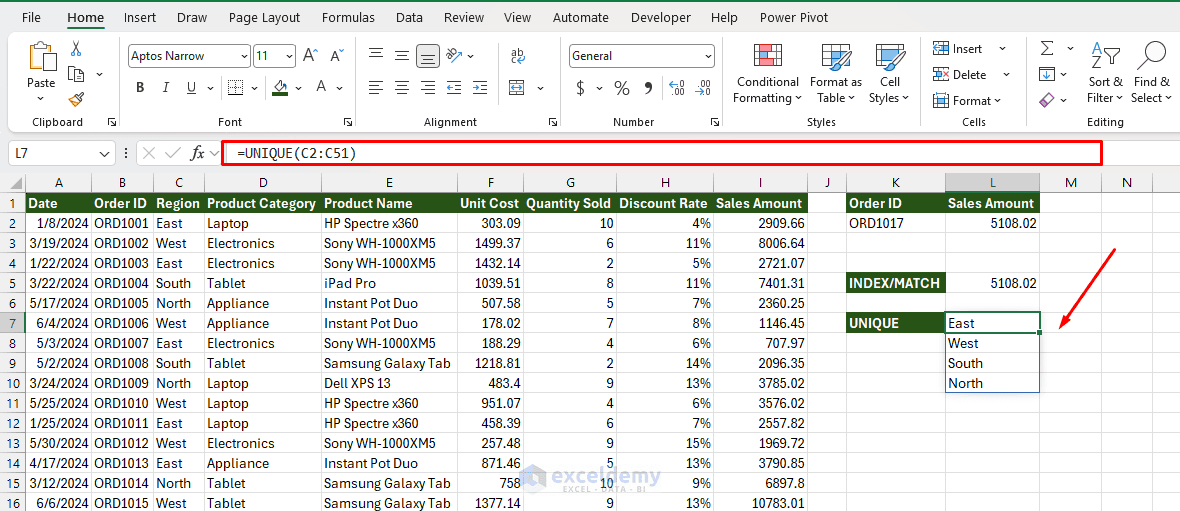
If region names appear repeatedly, use this formula to extract distinct values:
=UNIQUE(C2:C51)
This returns a unique list of all regions.
Why it simplifies analysis: Pair it with FILTER or COUNTIF to quickly build distinct category lists, deduplicated customer lists, or labels for a dashboard dropdown. It lets you create clean lists of categories, customers, or products for summaries, dropdowns, or further analysis.
5. SORT / SORTBY – Organize Data Automatically
SORT arranges data by a column’s values; SORTBY lets you sort one range based on the values in a completely different range.
Syntax:
=SORT(array, [sort_index], [sort_order])
=SORTBY(array, by_array1, [sort_order1], ...)
You can sort your dataset based on any column you want. For example, to sort by the fifth column in descending order:
=SORT(A2:I52,5,-1)
Here:
- 5 specifies the fifth column
- -1 sorts the values in descending order
The highest-revenue records therefore appear first.
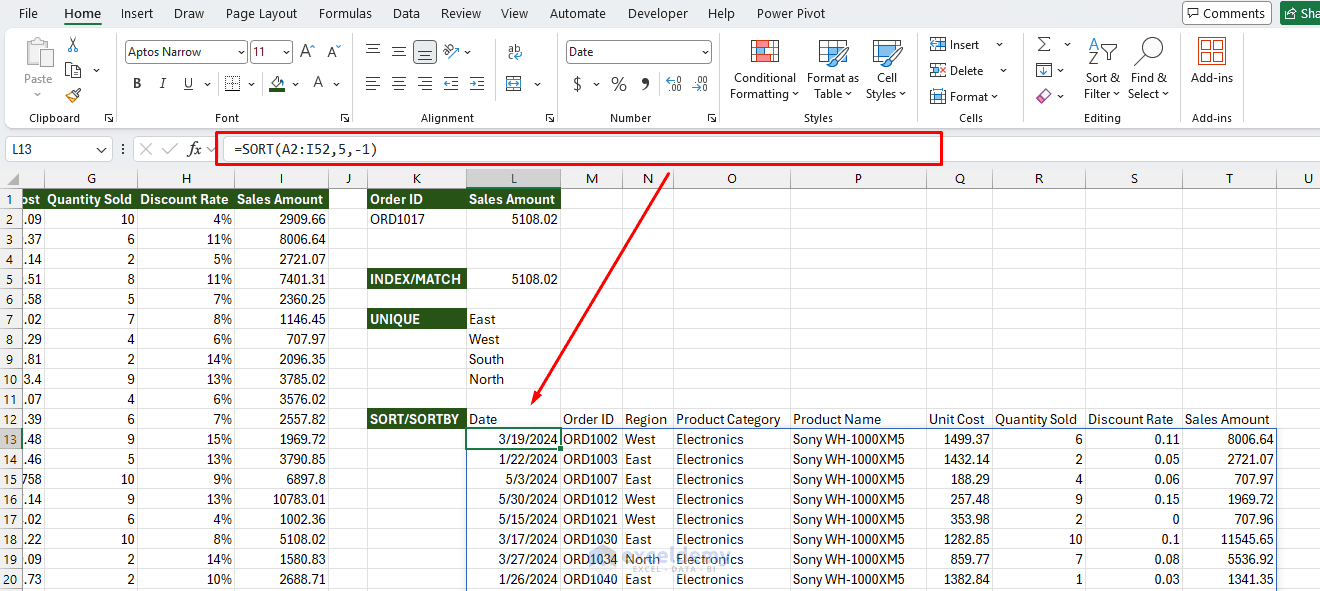
Why it simplifies analysis: Dynamic sorting means your ranked lists — top performers, largest expenses — update automatically instead of requiring a manual re-sort every time data changes.
6. SUMIFS – Sum Values Based on Multiple Criteria
SUMIFS adds values that meet one or more conditions across different ranges.
Syntax:
=SUMIFS(sum_range, criteria_range1, criteria1, ...)
Suppose you want to calculate total laptop sales in the East region:
=SUMIFS(I2:I51,C2:C51,"East",D2:D51,"Laptop")
This returns the total sales for laptops in the East region.
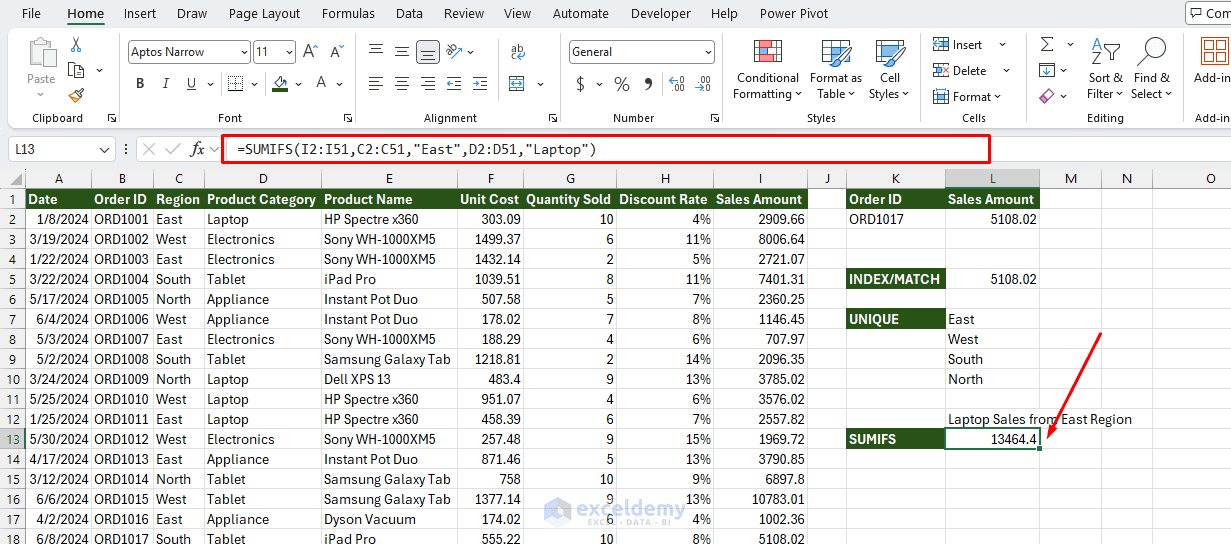
This function is especially useful for analyzing sales, expenses, revenue, and other numerical data by category.
Why it simplifies analysis: It lets you build summary tables directly from raw data without needing a pivot table for every slice you want to see. Best for conditional totals and summary reports.
7. COUNTIFS – Count Records That Meet Multiple Conditions
COUNTIFS counts cells that satisfy multiple conditions.
Syntax:
=COUNTIFS(criteria_range1, criteria1, ...)
For example, to count how many sales transactions occurred in the East region with sales greater than $1,000:
=COUNTIFS(C2:C51,"East",I2:I51,">1000")
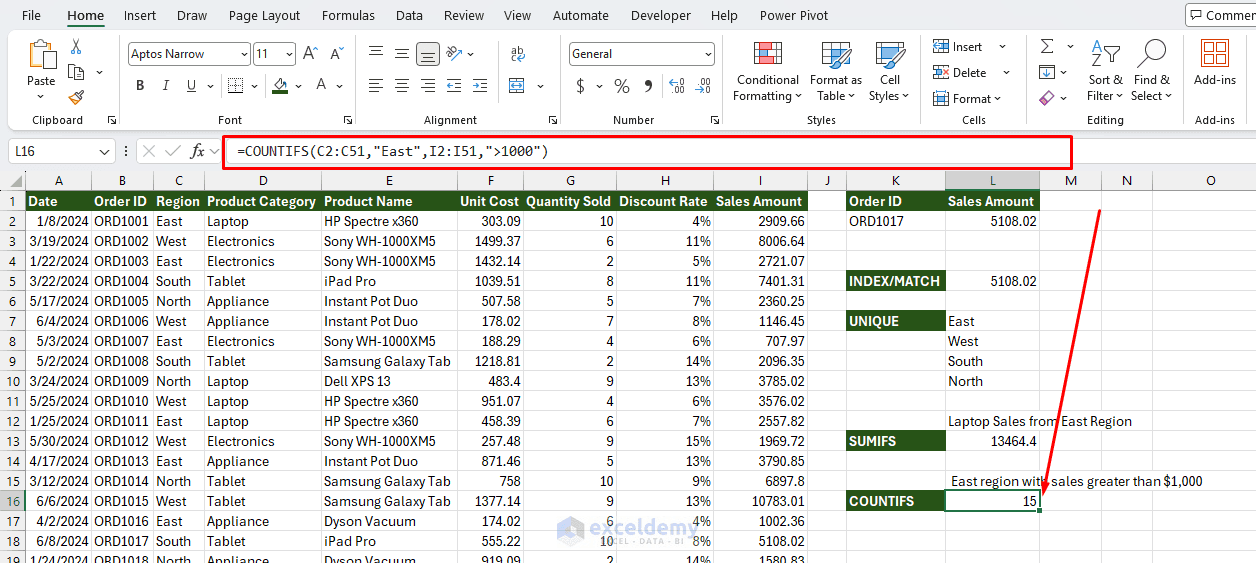
Instead of manually filtering and counting rows, COUNTIFS gives you the answer instantly.
Why it simplifies analysis: It quickly measures frequency — how many orders met certain criteria, how many customers fall into segments — for distribution analysis. Use it for counting orders, employees, customers, transactions, or other records based on conditions.
8. AVERAGEIFS – Calculate Conditional Averages
AVERAGEIFS calculates the average of values that meet one or more conditions.
Syntax:
=AVERAGEIFS(average_range,criteria_range1,criteria1,...)
For example, to calculate the average sales amount for the North region:
=AVERAGEIFS(I2:I51,C2:C51,"North")
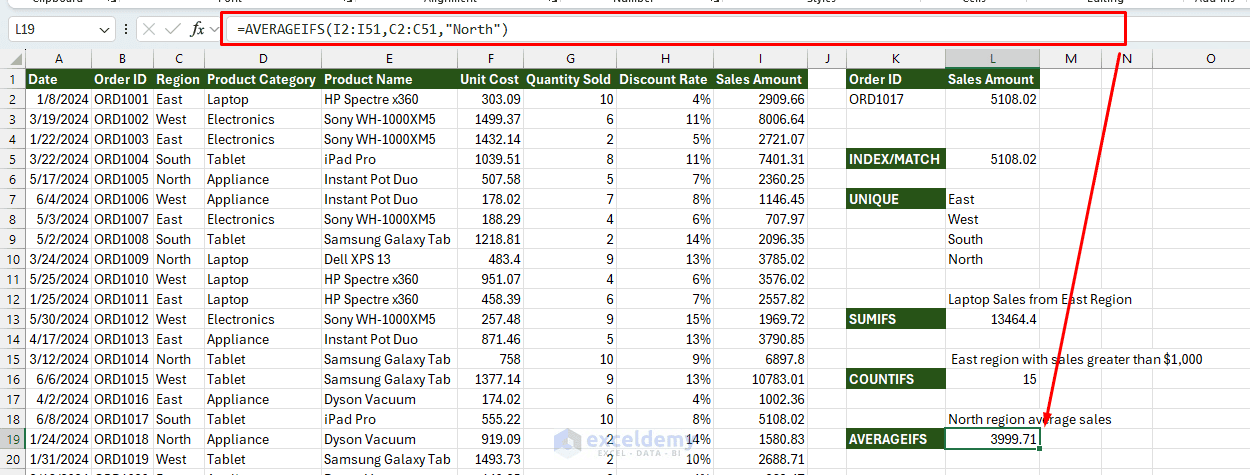
You can also add more conditions:
=AVERAGEIFS(I2:I51,C2:C51,"North",D2:D51,"Laptop")
This returns the average laptop sales amount for the North region.
Why it simplifies analysis: It computes meaningful averages — average deal size by region and product line — while excluding irrelevant data. Best for calculating average sales, scores, costs, response times, or performance metrics by category.
9. IFS – Categorize Data Based on Conditions
The IFS function checks multiple conditions and returns the result associated with the first TRUE condition. It is often easier to read than several nested IF functions.
Syntax:
=IFS(logical_test1,value_if_true1,logical_test2,value_if_true2,...)
Suppose you want to classify sales into High, Medium, and Low categories:
=IFS(I2>=5000,"High",I2>=2500,"Medium",I2<2500,"Low")
The formula evaluates conditions from left to right. If sales are at least $5,000, Excel returns High. Otherwise, it checks whether sales are at least $2,500 and returns Medium. Any value below $2,500 returns Low.
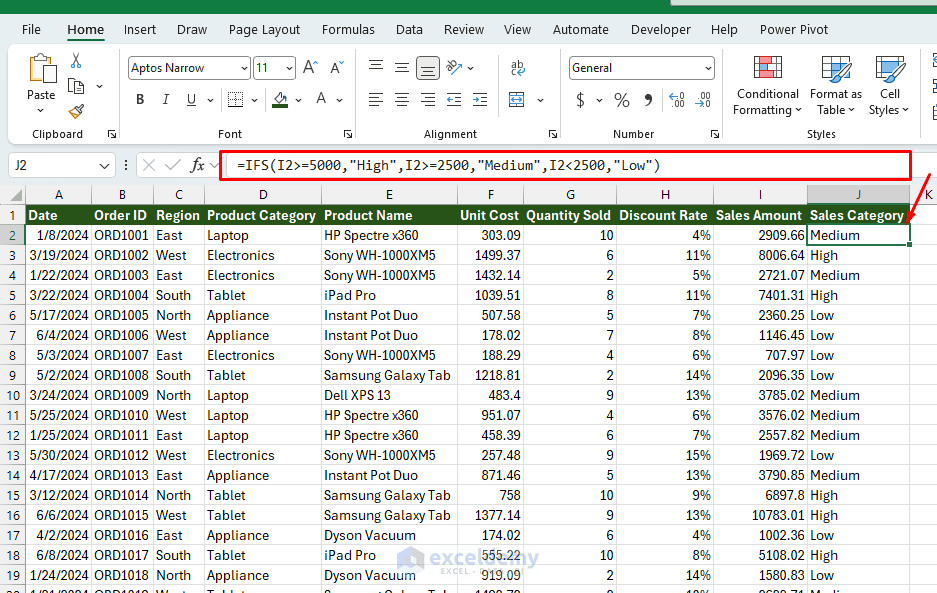
You can also use TRUE as the final condition to create a default result:
=IFS(I2>=5000,"High",I2>=2500,"Medium",TRUE,"Low")
This approach is useful when you have several categories or thresholds to evaluate.
Why it simplifies analysis: It creates nested decision logic cleanly — scoring, categorization, status flags — without deeply nested IF statements. Best for grading systems, performance levels, sales categories, risk levels, and other multi-condition classifications.
10. LET – Simplify Complex Formulas
The LET function lets you assign names to calculations inside a formula, making long analytical formulas easier to read and more efficient to compute.
Syntax:
=LET(name1,value1,calculation)
LET becomes especially valuable when the same calculation appears several times inside a larger formula.
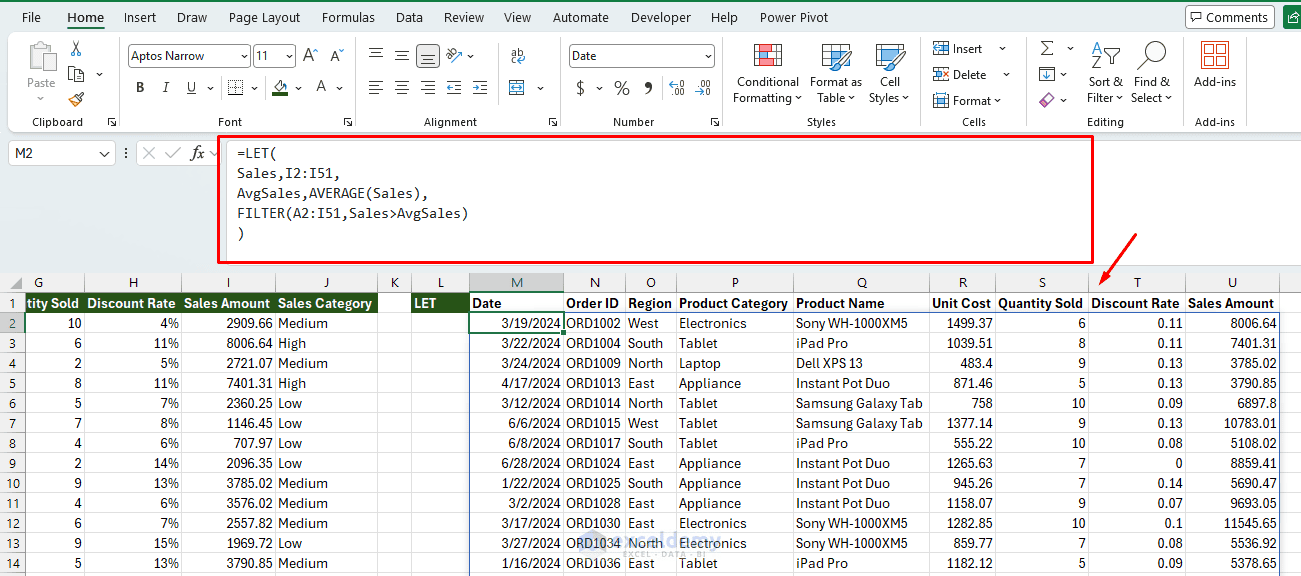
For example:
=LET(
Sales,I2:I51,
AvgSales,AVERAGE(Sales),
FILTER(A2:I51,Sales>AvgSales)
)
This formula calculates average sales and then returns all records with above-average sales.
Why it simplifies analysis: Instead of repeatedly referencing or recalculating the same values, LET makes the formula more readable. It is useful for making advanced formulas shorter, clearer, and easier to maintain.
Bonus: Text Functions (LEFT, RIGHT, MID, TRIM, SUBSTITUTE)
Real-world data is messy — extra spaces, inconsistent capitalization, IDs buried inside longer strings. This family of functions cleans and extracts text.
=TRIM(SUBSTITUTE(A2," ",""))
=MID(A2, FIND("-",A2)+1, 5)
Why it simplifies analysis: Clean, consistent text is a prerequisite for accurate lookups, grouping, and matching — messy strings silently break formulas downstream.
Conclusion
You do not need complicated tools for every data analysis task in Excel. Functions such as SUMIFS, AVERAGEIFS, COUNTIFS, and IFS handle many everyday calculations, while modern functions such as XLOOKUP, FILTER, UNIQUE, SORT, and LET make reports more dynamic and easier to maintain. Once you are comfortable combining these functions, you can transform raw datasets into useful summaries and reports with significantly less manual work.
Get FREE Advanced Excel Exercises with Solutions!

