


It’s common to have inconsistent reports of the same organization when multiple team members build Power BI reports. Developers may use different colors, page layouts, table names, measures, and calculation methods. As a result, reports from the same organization may look unrelated or produce conflicting results. A Power BI template helps solve this problem by giving everyone the same approved starting point. A Power BI template uses the .pbit file extension. It can preserve report pages, visual formatting, Power Query steps, parameters, relationships, calculations, and the data model structure. Unlike a regular .pbix report, a .pbit file does not include the imported data.
In this tutorial, we will show how to create and use Power BI templates to standardize reports across your team.
What a .pbit File Actually Is
A .pbix file is a full Power BI report, bundled with its data model, visuals, and a compressed copy of everything you loaded into memory. A .pbit file is almost the same package, minus the data payload. Structurally, a .pbit is a ZIP archive (you can rename one to .zip and open it) containing:
- DataModelSchema: Table structures, relationships, measures, calculated columns
- Report/Layout: Visual placement, formatting, page structure, bookmarks
- DiagramLayout: The relationship view layout in the Model view
- Metadata and Settings: Theme, version info
- A Connections file with query definitions but no cached rows
Because the data isn’t embedded, .pbit files are typically a few hundred KB to a few MB, compared to .pbix files that can balloon into hundreds of MB once real data is loaded. That size difference alone makes templates far easier to email, store in a shared repo, or version-control.
When a team member opens a .pbit file, Power BI can request parameter values and data-source credentials before loading the new report.
Step 1: Create the Master Report
Start in Power BI Desktop as you normally would, but with one difference: everything that’s specific to your data source (server name, file path, database name, folder location) should eventually become a parameter rather than a hardcoded value.
- Open Power BI Desktop and create a blank report
- Connect to a sample data source and complete the normal report-development process:
- Import the required tables
- Clean and transform the data in Power Query
- Create relationships between the tables
- Add calculated columns and measures
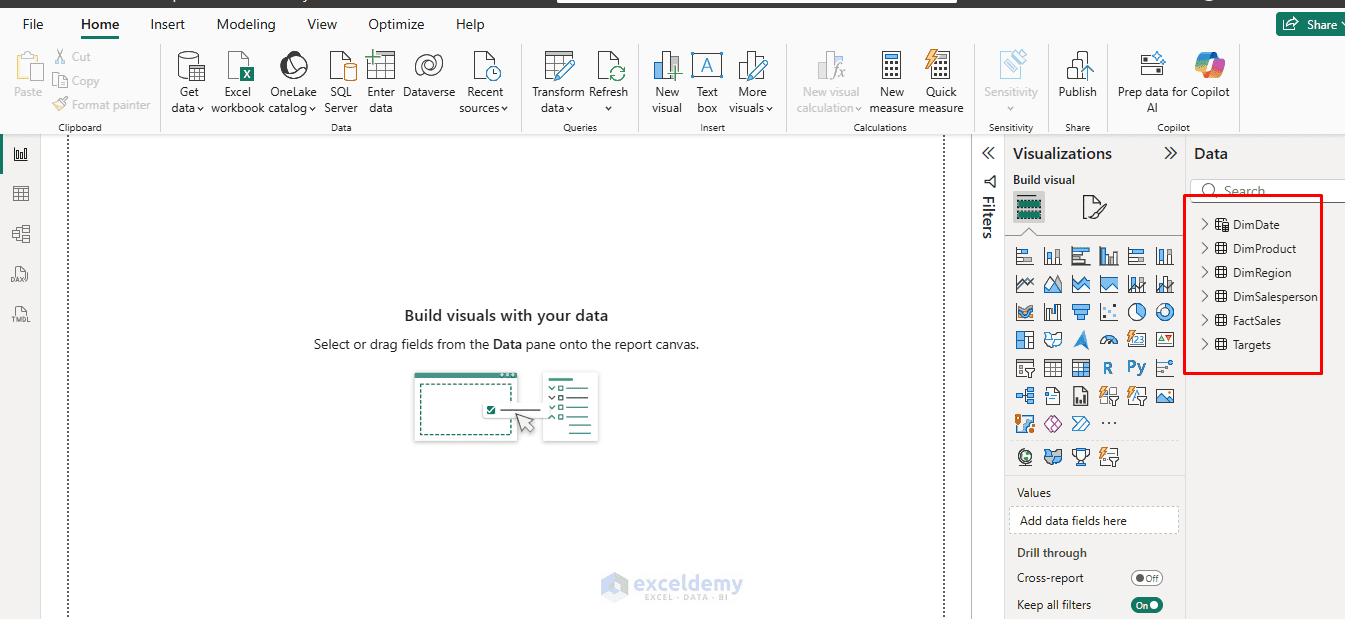
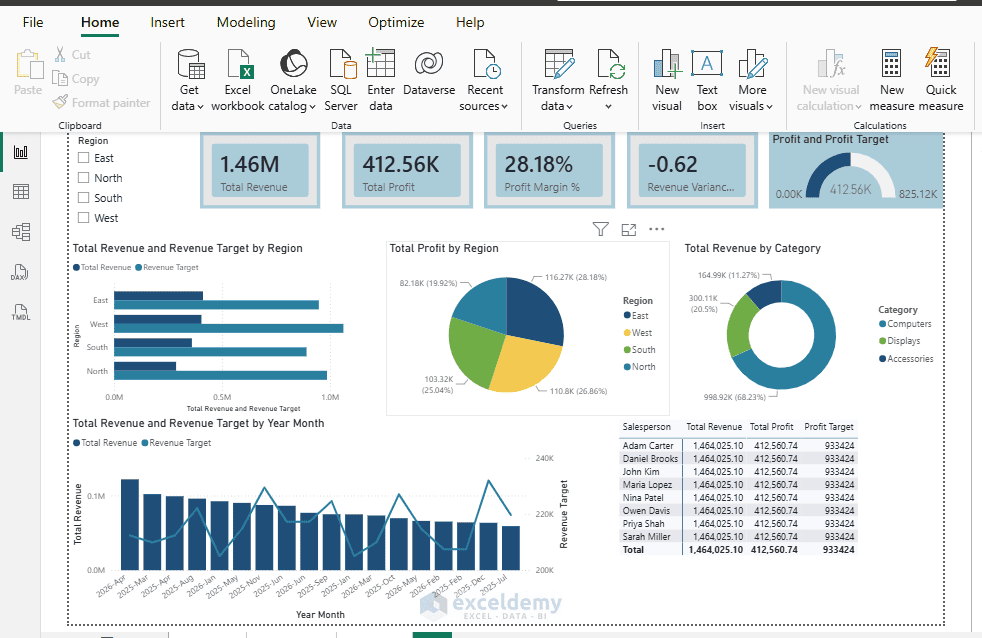
- Create the report pages and visuals
- Format the report using the approved design
- Use clear page names rather than names such as Page 1 and Page 2
Add Standard Measures:
Include calculations that every report developer should use. For example:
Total Revenue = SUM(FactSales[Revenue])
Total Cost = SUM(FactSales[TotalCost])
Total Profit = [Total Revenue] - [Total Cost]
Profit Margin % = DIVIDE([Total Profit], [Total Revenue], 0)
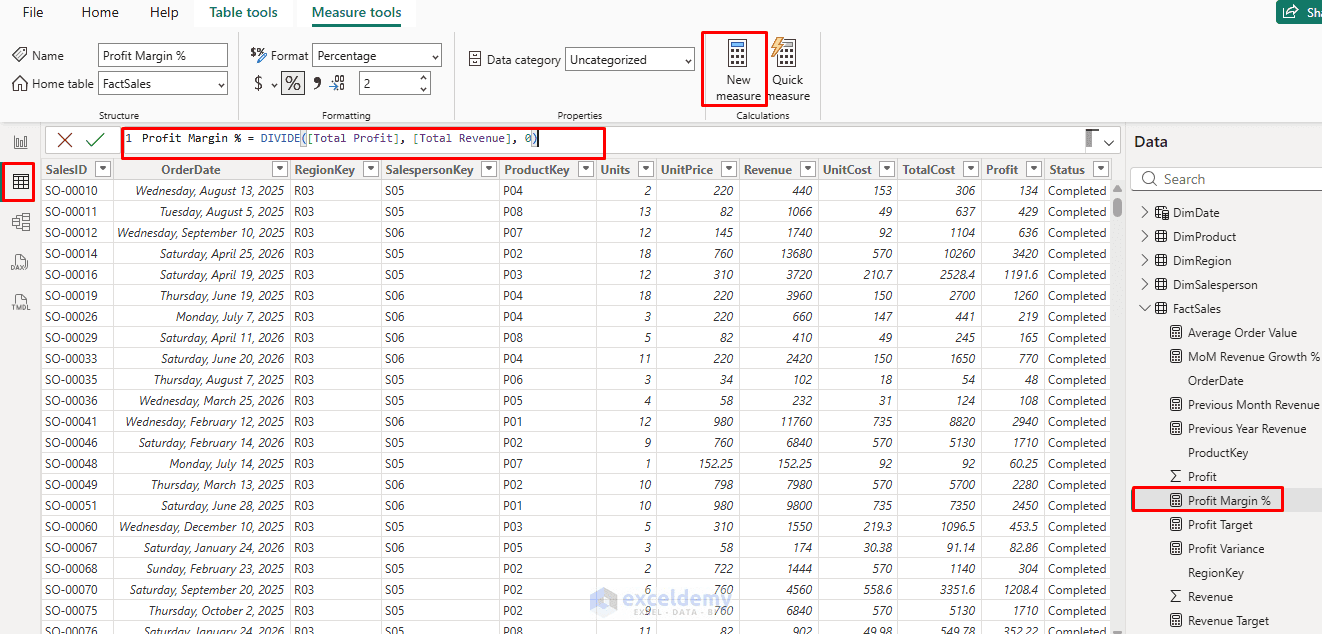
Because these measures are stored in the template, each team member starts with the same KPI definitions.
Step 2: Create a Data-Source Parameter
A template is more useful when users can connect it to different files, folders, servers, or databases. Suppose the report currently connects to this Excel file: C:\Sales Reports\North\SalesData.xlsx. If this path remains hard-coded, another user may receive a file-not-found error. Instead, create a Power Query parameter.
Create the Parameter:
- Go to the Home tab >> select Transform data
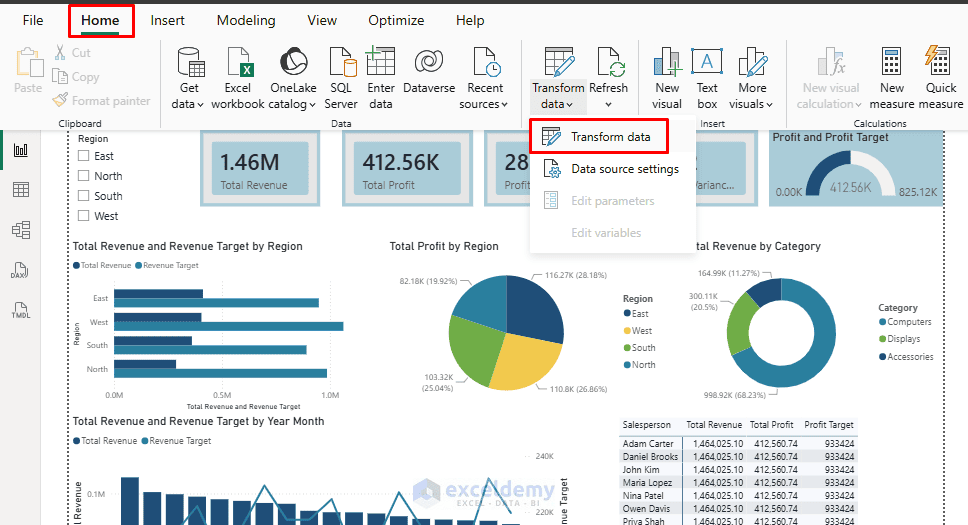
- In Power Query Editor, select the Home tab >> select Manage Parameters >> select New Parameter
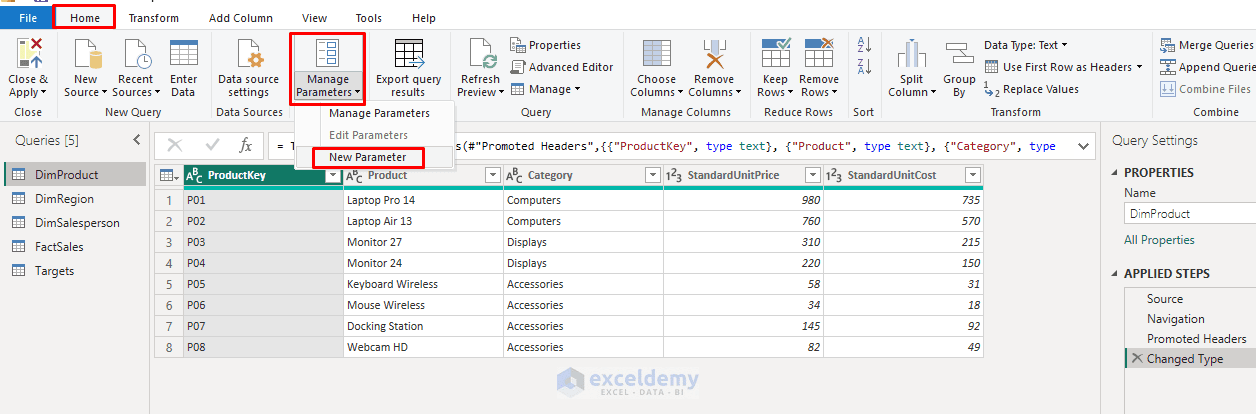
- Configure the parameter as follows:
- Parameter Name: FilePath
- Type: Text
- Suggested Values: Any value
- Current Value: Path of the sample Excel file
- Required: Checked
- Select OK
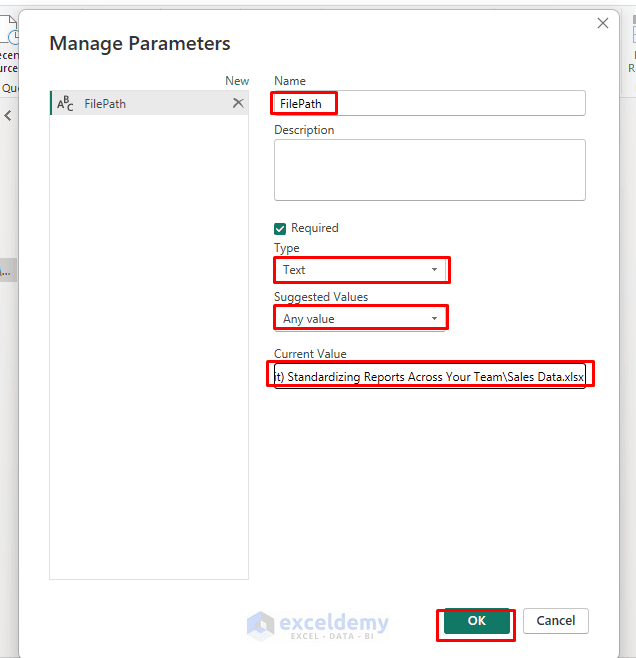
Tip: When entering the path into the parameter, remove the quotation marks.
Use the Parameter in the Query:
A normal Excel source step might look like this:
Source = Excel.Workbook(File.Contents("C:\Sales Reports\\Sales Data.xlsx"), null, true)
Replace the fixed path with the parameter:
Source = Excel.Workbook(File.Contents(FilePath), null, true)
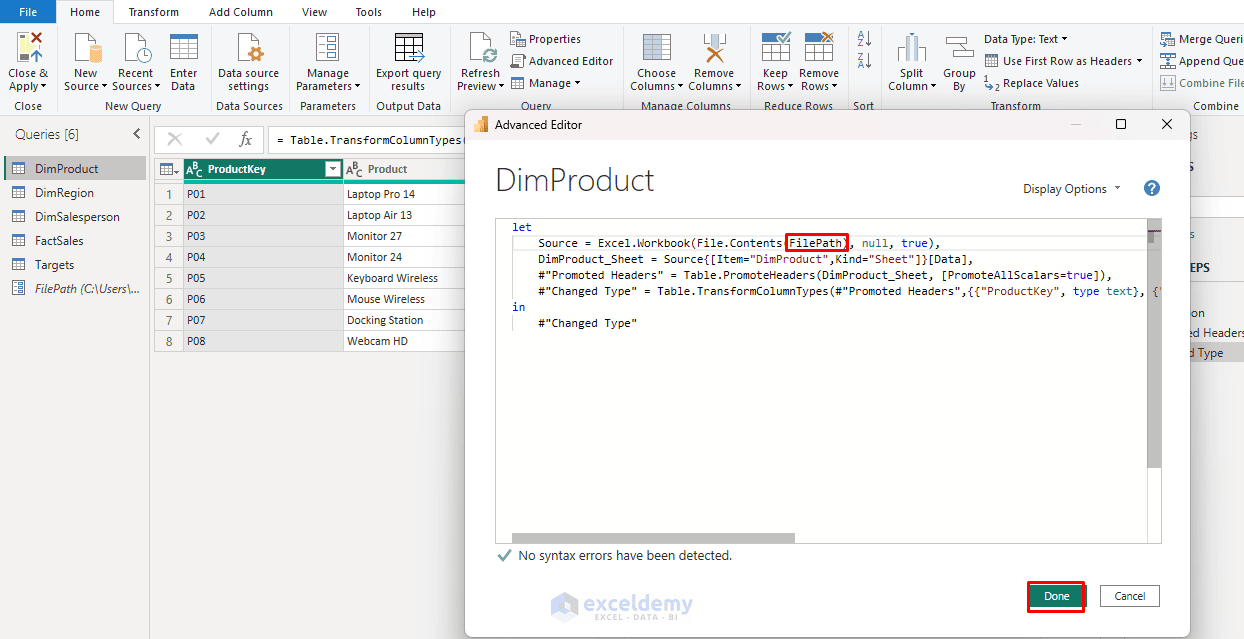
When someone opens the finished template, Power BI will ask for a value for FilePath. The user can then enter the location of their own data file. The replacement file must use the table and column structure expected by the Power Query steps. For example, if the query expects a column named Revenue, a source file containing only a column named Sales Amount will cause an error.
Step 3: Apply a Standard Report Theme
A report theme helps maintain consistent colors and formatting.
In Power BI Desktop:
- Open the View tab >> select the arrow beside Themes
- Choose Customize current theme
- Configure the approved colors, fonts, backgrounds, and visual settings
- Apply the changes
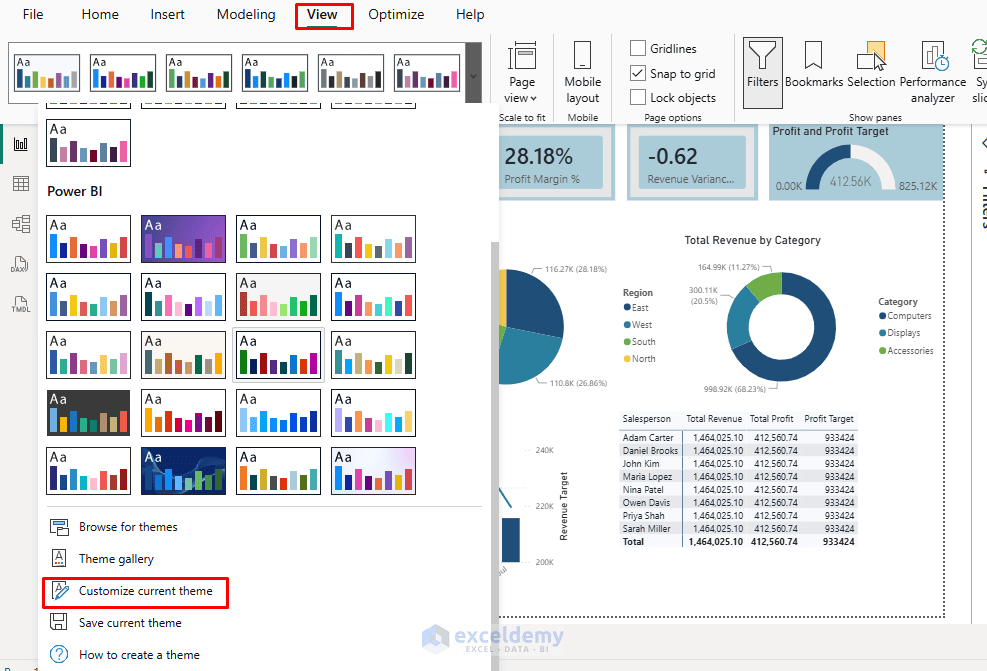
You can also import a company theme stored as a JSON file:
- Select View >> select Themes
- Select Browse for themes
- Choose the company .json theme file
- Select Open
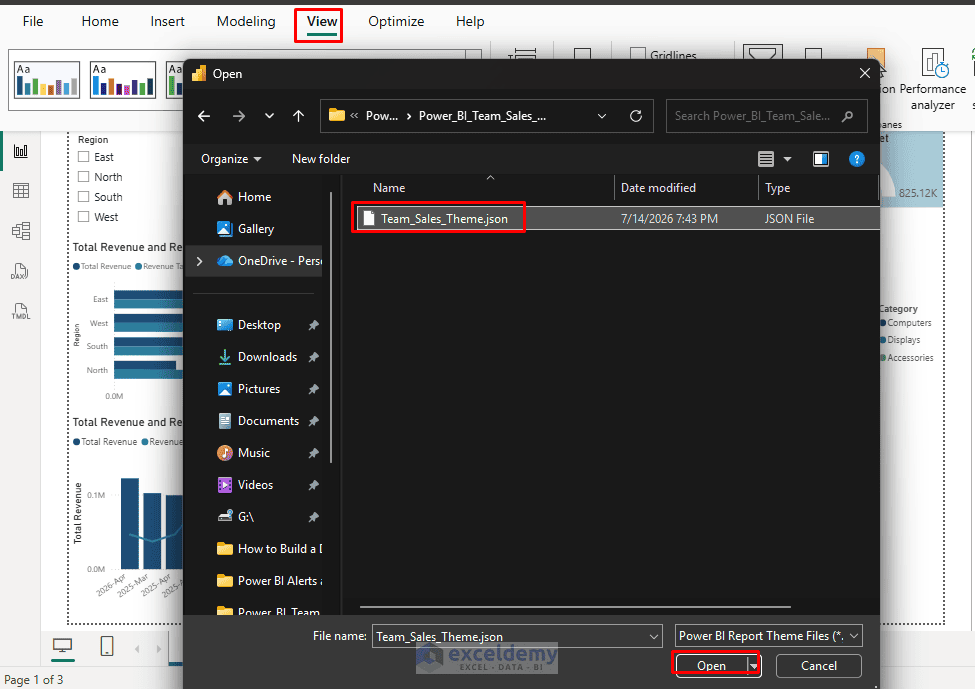
Power BI supports built-in themes, customized themes, and imported JSON theme files from the Themes menu. Whenever possible, use colors from the theme instead of manually assigning custom colors to individual visuals. Manually formatted visuals may not automatically update when a new theme is applied.
Step 4: Standardize the Report Layout
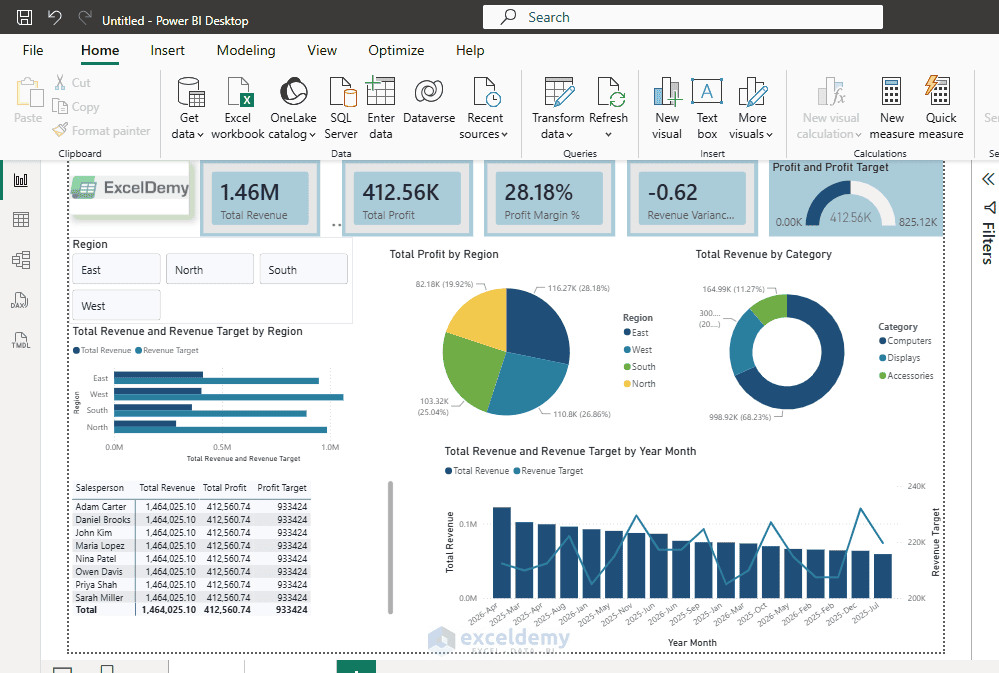
Add the common elements that should appear in every report created from the template. For example, the Executive Overview page could contain:
- A company logo and report title
- Date and region slicers
- Total Revenue card
- Total Profit card
- Profit Margin card
- Monthly revenue trend chart
- Revenue by region chart
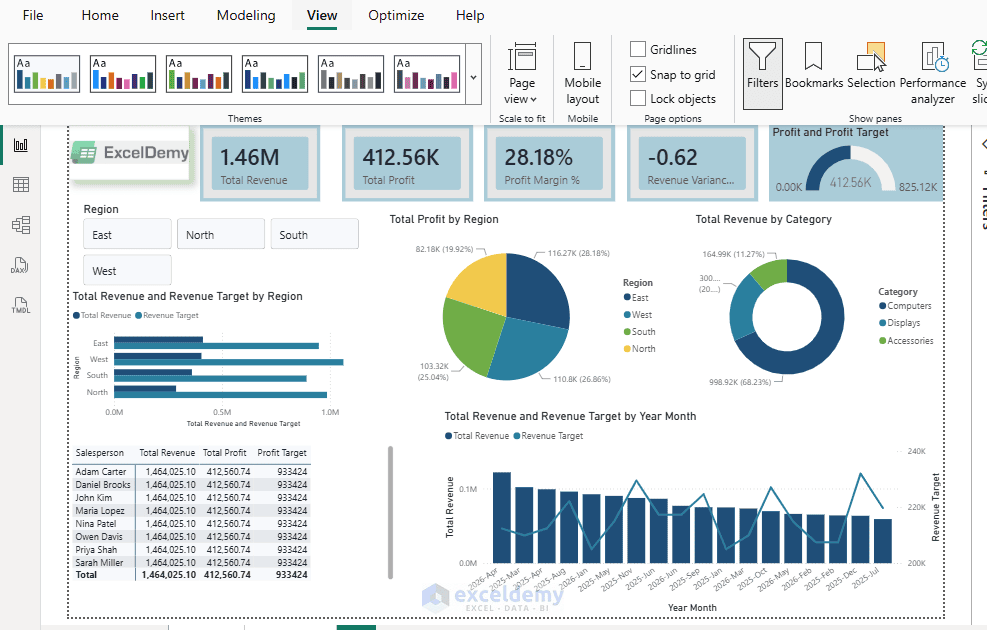
You can also add a page navigator:
- Go to the Insert tab >> select Buttons >> select Navigator >> select Page navigator
- Position the navigator at the top or side of the page
- Format it using the company theme
- Copy the navigation area to the other pages if necessary
If the exact charts will differ between departments, use text boxes and shapes as placeholders. For example: MONTHLY PERFORMANCE TREND — Place the primary time-series chart here. This keeps the layout consistent while allowing developers to insert their own fields.
Step 5: Export the .pbit Template
After completing the report:
- Go to the File tab >> select Export >> select Power BI template
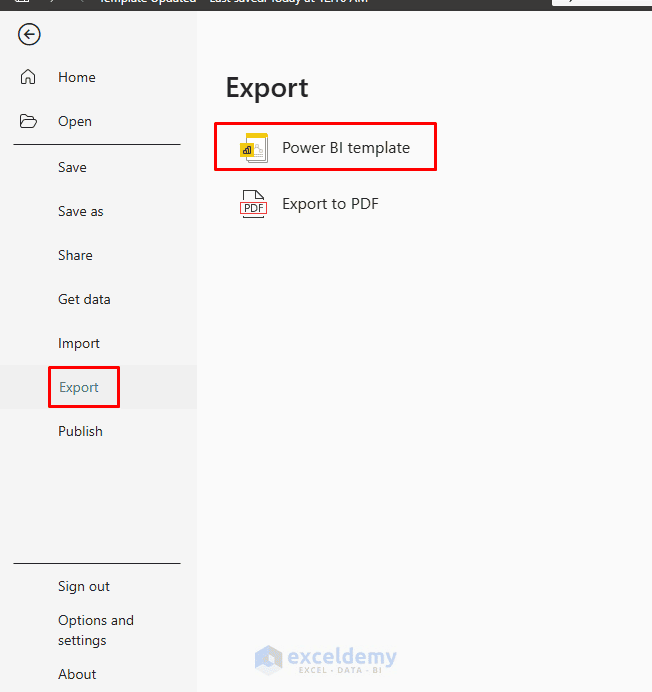
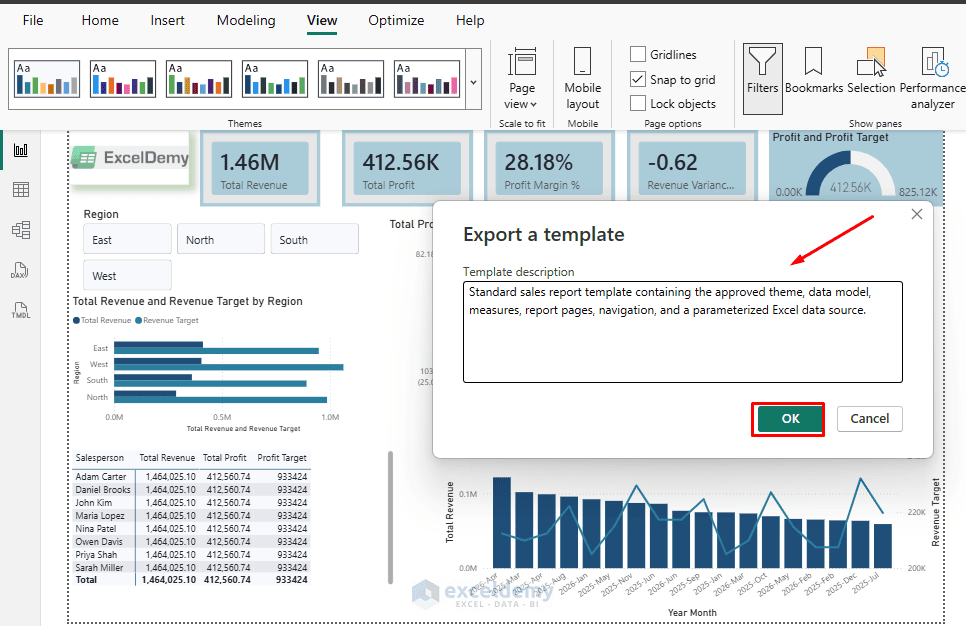
- Enter a template description: Standard sales report template containing the approved theme, data model, measures, report pages, navigation, and a parameterized Excel data source.
- Select OK
- Choose the destination folder
- Enter a descriptive file name: Company_Sales_Report_Template_v1.0.pbit
- Select Save
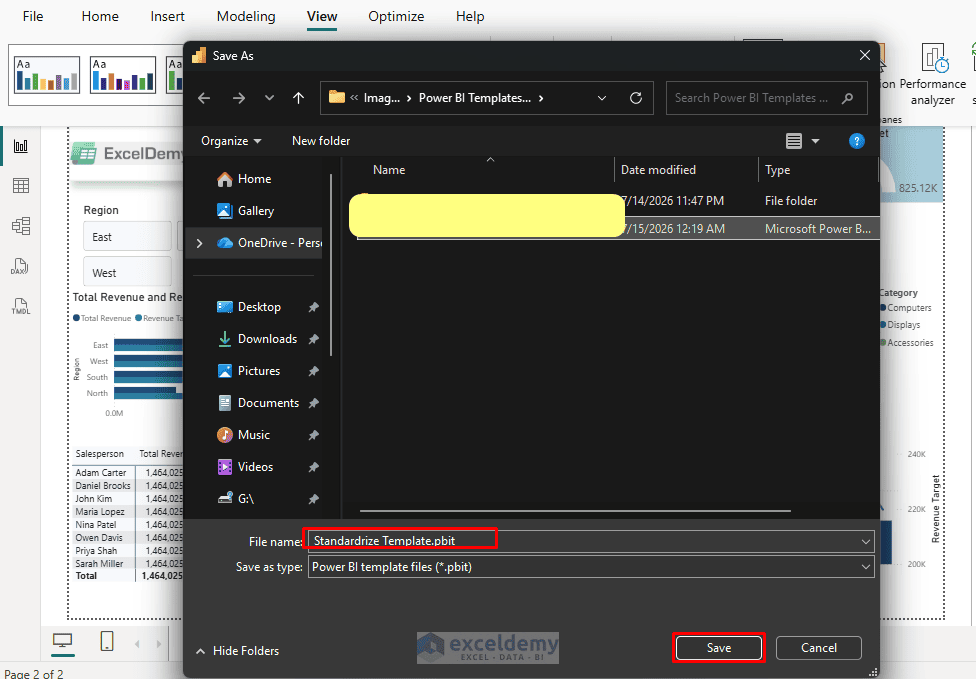
Power BI creates the .pbit file without including the imported dataset.
Step 6: Share and Use the Template
Store the template in a shared location such as:
- Microsoft Teams
- SharePoint
- OneDrive for Business
- A controlled network folder
A team member can open the template in either of these ways:
- Double-click the .pbit file
- Or open Power BI Desktop >> select File >> select Import >> select Power BI template
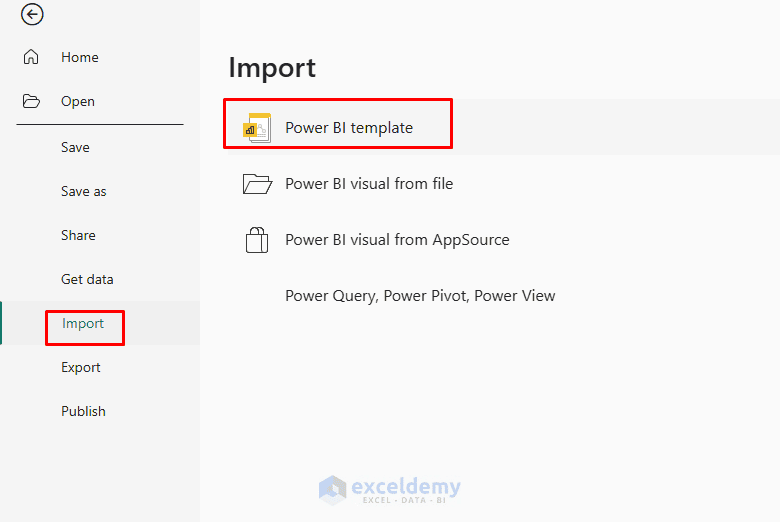
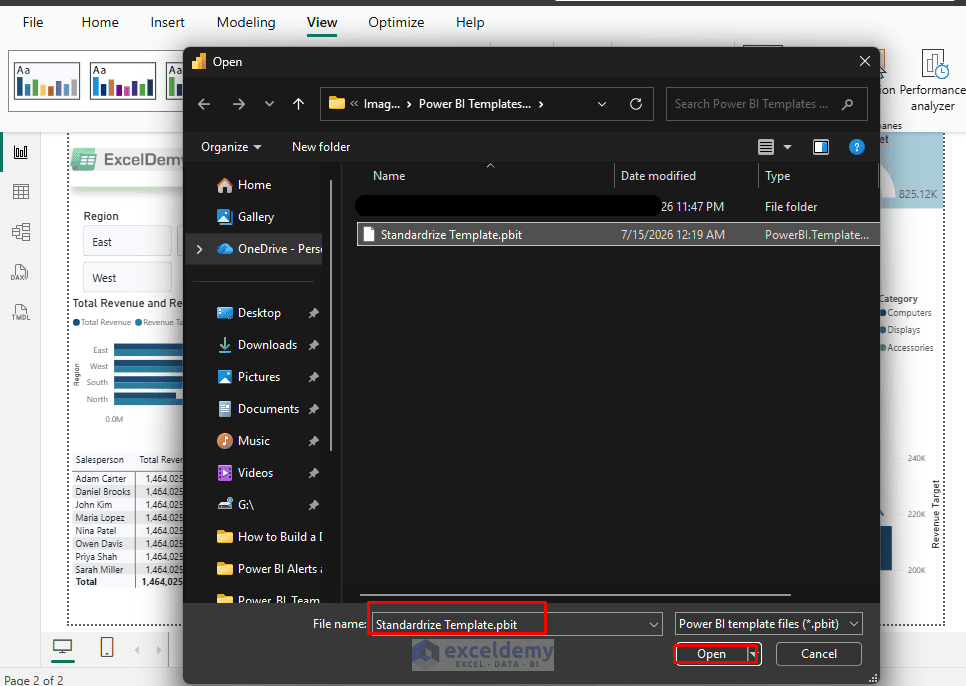
- Browse and select the template file
- Click Open
- If the template contains parameters, the user will be prompted to enter the required values
- Insert the FilePath
- Click Load
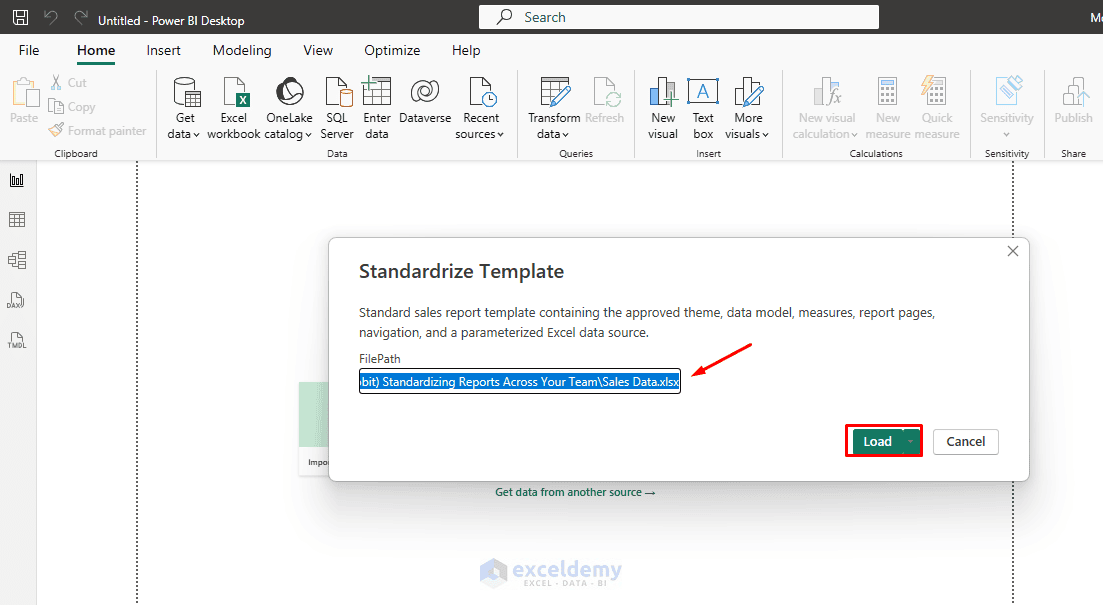
Power BI may then request the user’s data source credentials. After the data loads, the user should save the new report as a .pbix file.
The newly created .pbix report is independent of the original template. Updating the master template will not automatically update reports that were previously created from it.
Advanced Tips for Team Standardization
- Combine with Themes: Use organizational themes (admin-managed in the Power BI Service) alongside templates for broader enforcement.
- Parameters and Dynamic Content: Leverage query parameters heavily for reusable logic.
- Version Control: Name templates with versions (e.g. Sales_Template_v2.1.pbit). Document changes in a companion guide.
- What to Include (and Exclude):
- Include: Layouts, themes, core measures, query patterns, and branding.
- Consider: Pre-configured connections (but users may need to update credentials).
- Avoid in Templates: Highly sensitive or environment-specific data and models.
- Maintenance: Update the master .pbix, re-export the .pbit, and notify the team. Use the PBIP project format for more advanced team development if needed.
- Distribution: Share via a company portal with usage guidelines (e.g. “Always start new reports from this template”).
Best Practices and Pitfalls to Avoid
- Keep templates focused — avoid overly complex ones that are hard to maintain.
- Document the template: Create a companion PDF or Word guide explaining the intended use, parameters, and update process.
- Train the team: Run workshops on using templates rather than starting from scratch.
- Monitor adoption: Review published reports for compliance.
- Test across environments: Ensure templates work with different data sources (Import, DirectQuery, etc.).
- Performance: Templates with large models may need optimization.
Conclusion
By following the steps above, you can create Power BI templates (.pbit) to standardize reports across your team. A .pbit file gives report creators the same pages, visuals, theme, queries, relationships, parameters, and measures — without distributing the imported business data. By building one tested master report and exporting it as a template, an organization can reduce repeated work, maintain consistent KPI definitions, and ensure that reports from different developers follow the same design and reporting standards.
Get FREE Advanced Excel Exercises with Solutions!

