


In this article, you will learn how to create paginated reports in Power BI Report Builder and export them as pixel-perfect PDFs suitable for printing and formal document distribution.
Topics we will cover include:
- When to use paginated reports over standard Power BI reports, and what makes them the right tool for print-ready output.
- How to connect a data source, build a dataset, and construct a formatted sales table with repeating headers in Power BI Report Builder.
- How to configure page layout, add dynamic headers and footers, preview your report, export to PDF, and publish to the Power BI service.
Let’s get to it.
Interactive Power BI reports are ideal for exploring data with charts, slicers, filters, and drill-down features. However, they are not always suitable when a report must follow an exact printed layout. Paginated reports (RDL files) excel when you need pixel-perfect layouts, controlled page breaks, repeating headers/footers, and the ability to render all data across multiple pages without truncation or scrolling issues common in interactive reports. Paginated reports are created as .rdl files using Power BI Report Builder. They automatically continue long tables across multiple pages and are designed for exporting to fixed-layout formats such as PDF.
In this tutorial, we will show how to create paginated reports in Power BI when you still need a pixel-perfect PDF. Paginated reports are designed for printing and document-style distribution.
Why Choose Paginated Reports Over Standard Power BI Reports?
Use paginated reports when:
- The report must be printed or exported to PDF with exact formatting (e.g. invoices, statements, regulatory filings, financial summaries)
- Tables or matrices contain large datasets that need to flow naturally across pages with repeating headers
- You require precise control over layout (margins, page size, exact positioning in inches/centimeters)
- Parameter-driven operational reports are needed for specific users or scenarios (cascading parameters, defaults, mail-merge style)
- Compliance or archival needs demand consistent, non-interactive output
In contrast, use standard Power BI reports for interactive dashboards, drilling down, modern visuals, and data exploration. A table in a standard report shows scroll bars on screen and truncates on PDF export; a paginated table expands intelligently across pages.
Let’s build something concrete: a detailed sales report with a repeating header, a detail table, and a totals section — the kind of output that gets requested constantly in sales reporting.
Prerequisites:
- Install Power BI Report Builder
- A Power BI semantic model or another supported data source
- Build permission for the semantic model
- Access to the Power BI service if you plan to publish the report
A free Power BI license can be used to publish a paginated report to My Workspace. Publishing to other workspaces normally requires an appropriate Power BI license and workspace role.
Step 1: Create the Report and Connect the Data
For this example, we’ll connect to a Power BI semantic model, the most common scenario for teams already working in Power BI.
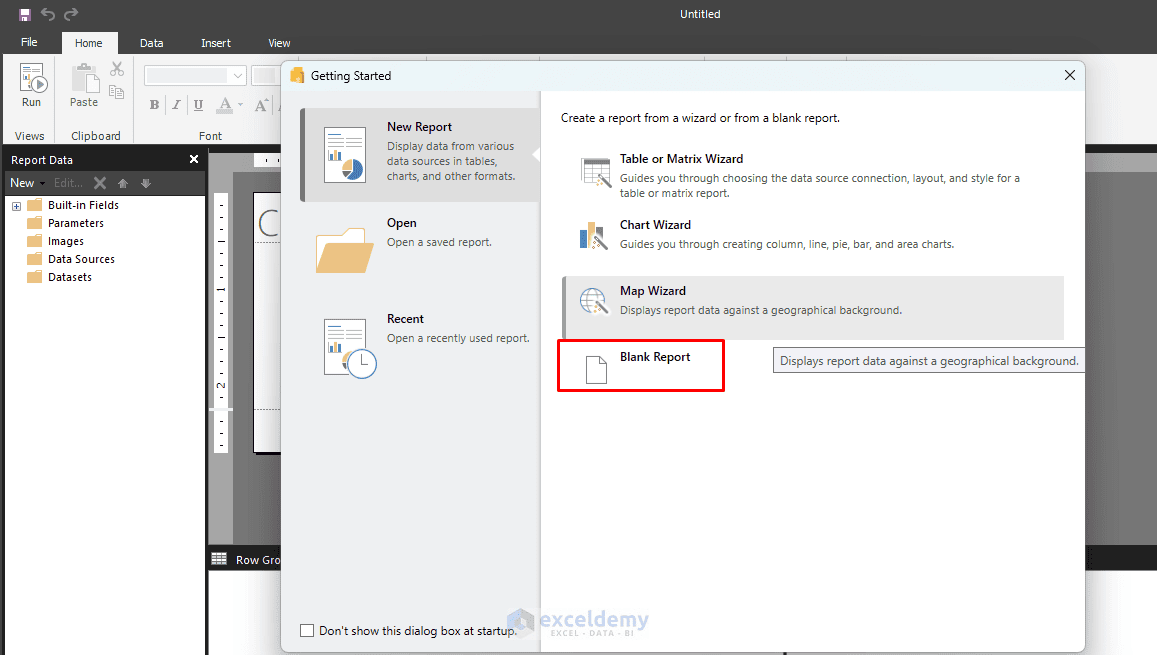
- Open Power BI Report Builder >> select Blank Report
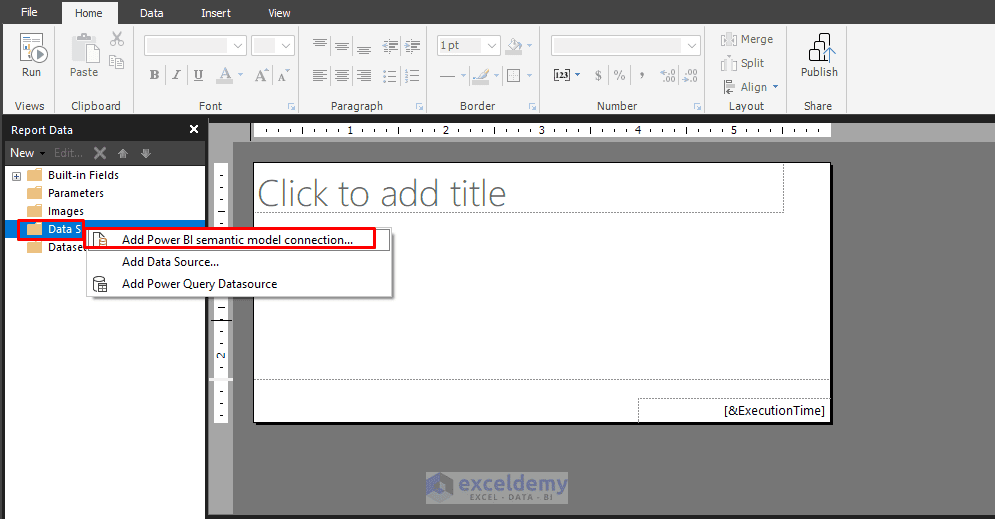
- In the Report Data pane:
- Right-click Data Sources >> select Add Power BI Semantic Model Connection
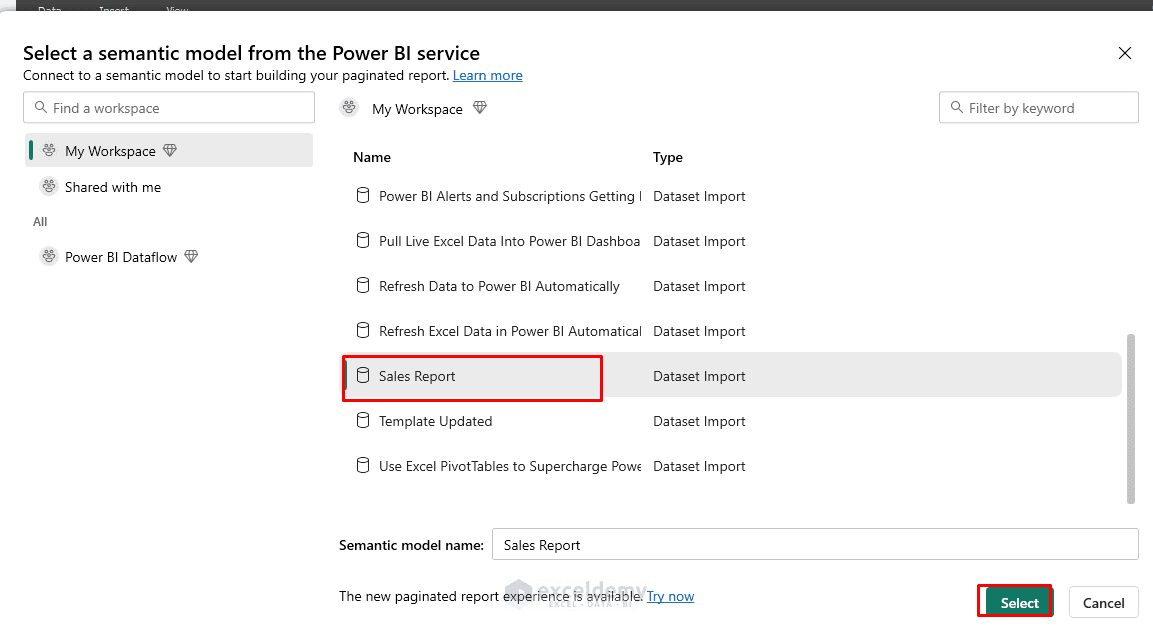
- Sign in to your Power BI account
- Select the required workspace and semantic model
- Choose Select
Report Builder can also connect to sources such as SQL Server, Azure SQL Database, Oracle, and Analysis Services. On-premises sources normally require a data gateway after publishing.
Step 2: Create the Report Dataset
A data source defines where the information comes from. A dataset defines which fields and records the report will use.
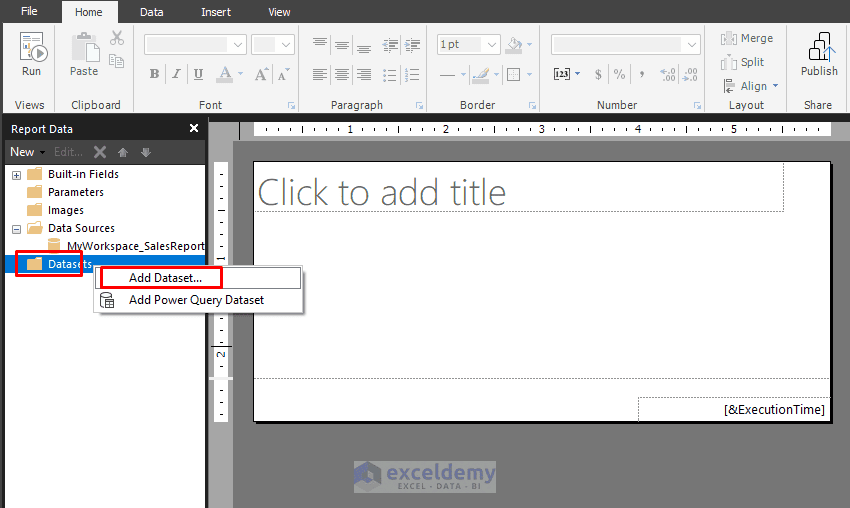
In the Report Data pane:
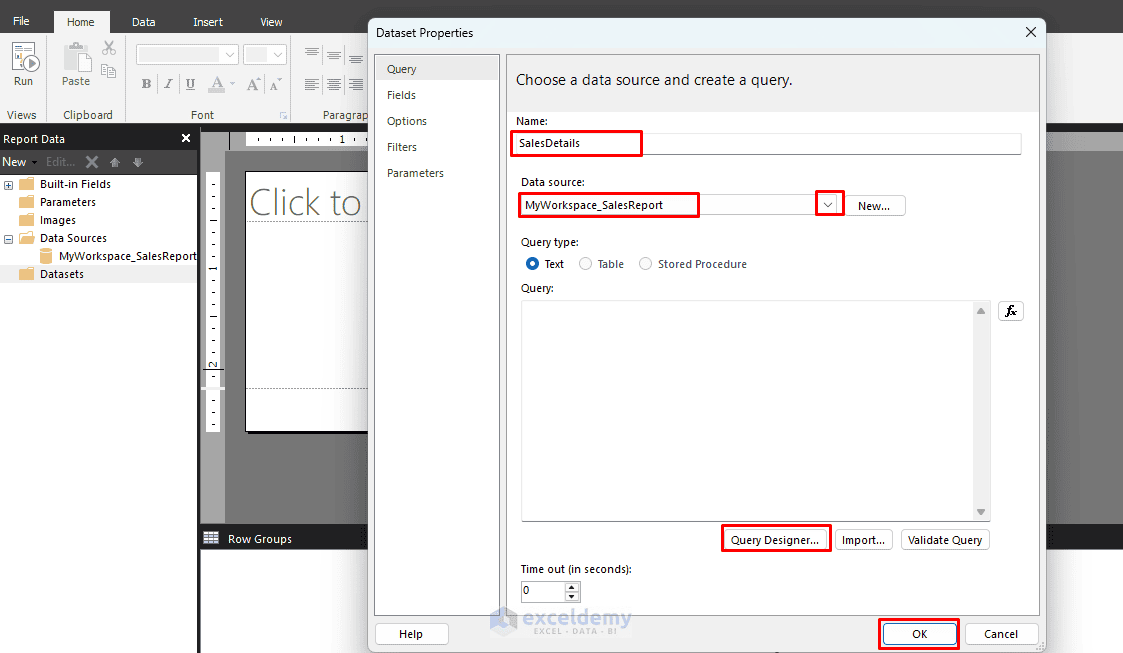
- Right-click Datasets >> select Add Dataset
- Enter a Name: “SalesDetails”
- Open the Data source: drop-down >> choose the Power BI semantic model connection
- Click Query Designer
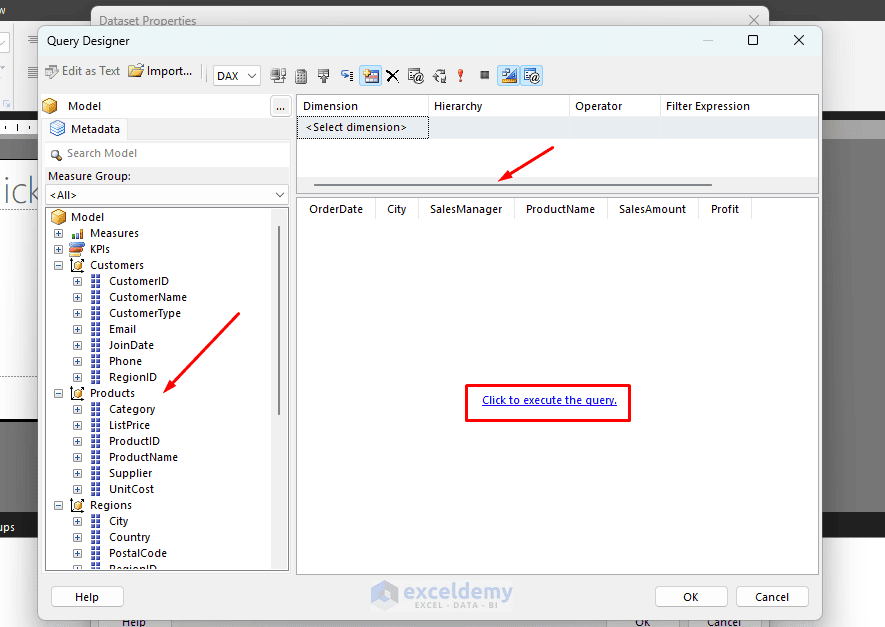
- In the Query Designer, drag the required fields:
- OrderDate
- City
- SalesManager
- ProductName
- SalesAmount
- Profit
- Select Click to execute the query or the red exclamation mark to test the query
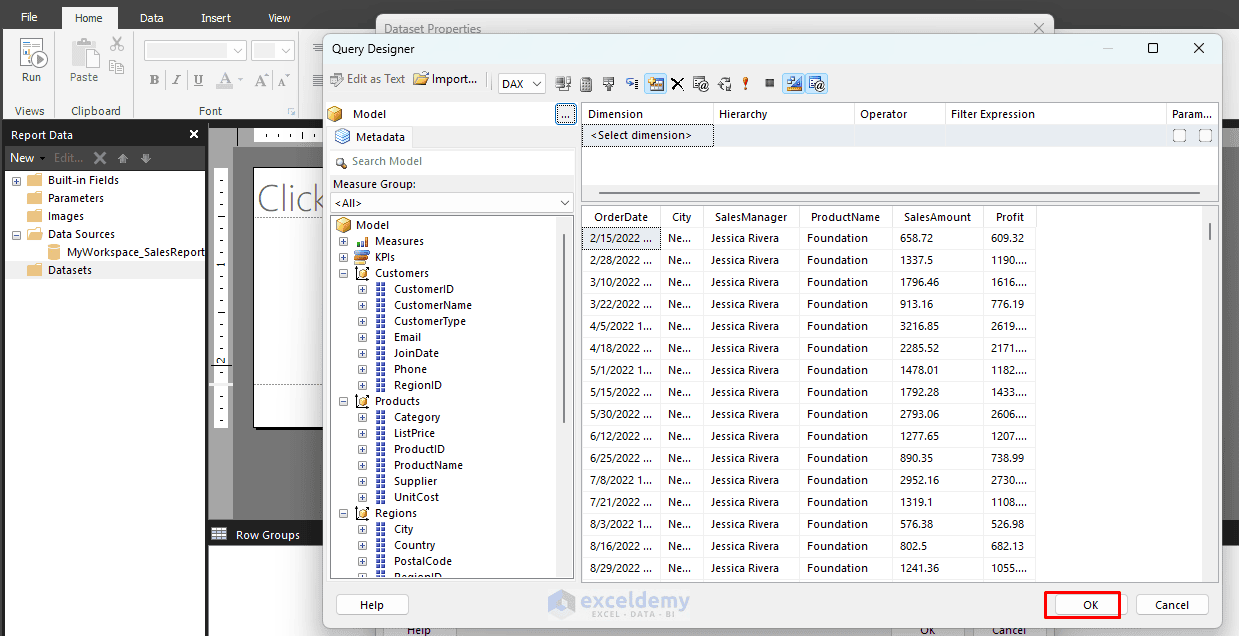
- Confirm that the expected rows appear >> select OK
- Click OK
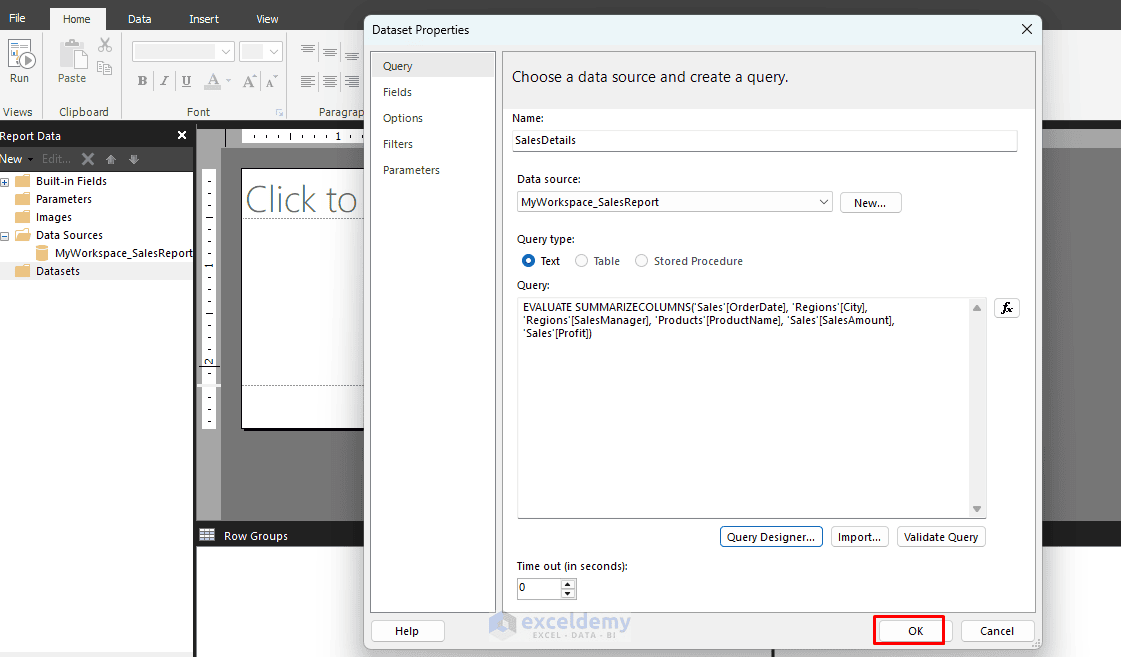
After saving the dataset, its fields appear under the dataset name in the Report Data pane.
Step 3: Build and Format the Sales Table
Paginated reports work with three structural report items you’ll use constantly:
- Tablix: The core data region. It’s a hybrid of a table and a matrix, and almost every paginated report is built around one or more of these.
- Page Header/Footer: Bands that repeat on every printed page, independent of the data.
- Text Box/Image: For static content like logos, titles, and legal disclaimers.
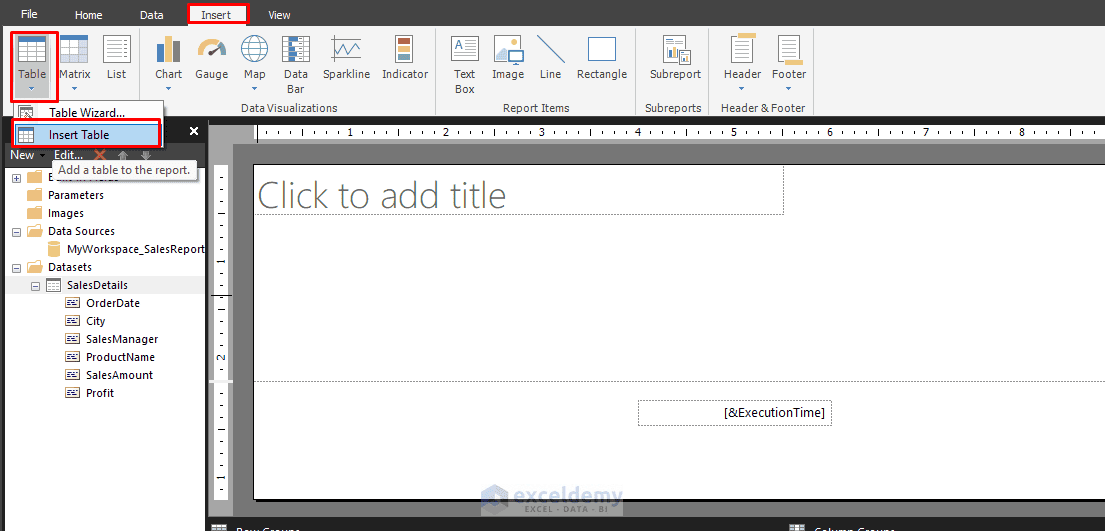
To insert a table:
- Go to the Insert tab >> select Table >> select Insert Table
- Draw the table inside the report body and add the fields in this order:
| OrderDate | City | SalesManager | ProductName | Revenue | Profit |
You can drag the fields from the Report Data pane into the table cells.
- Format the table by applying color, borders, currency formatting, etc.
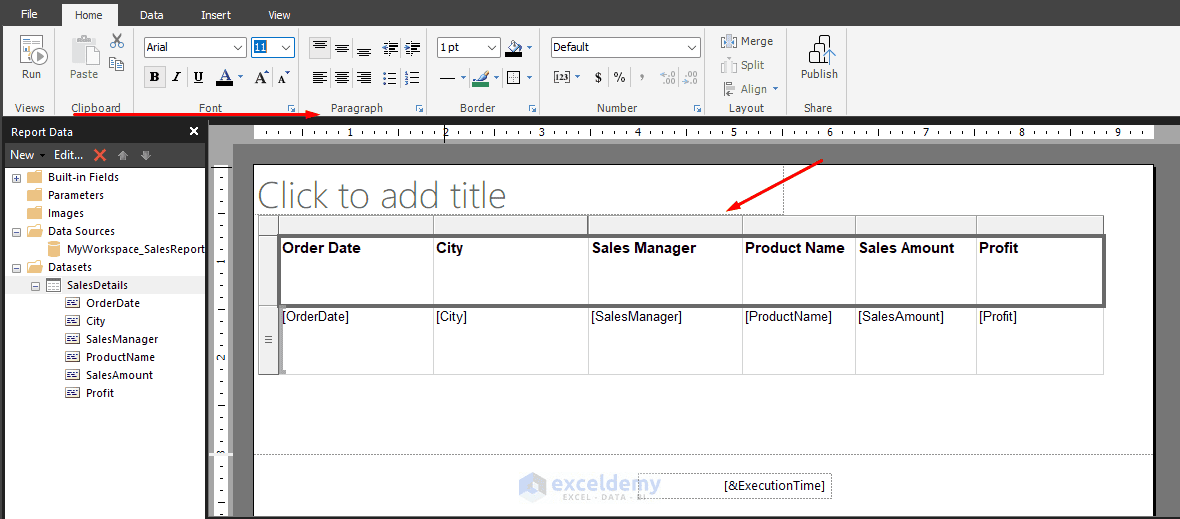
Keep the columns as narrow as possible without cutting off the values. This helps prevent the table from spilling onto extra horizontal pages in the PDF.
Step 4: Add the Report Title and Generation Date
- Insert a text box above the table >> enter Detailed Sales Report
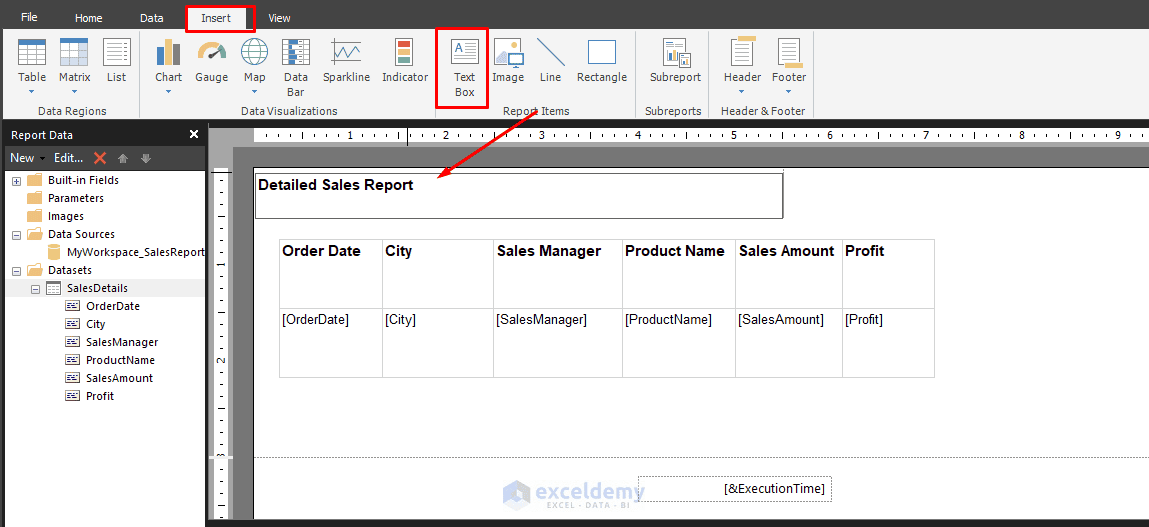
- To make the report title dynamic, use:
="Detailed Sales Report - " & Format(Globals!ExecutionTime, "MMMM yyyy")
- Add another text box for the report generation date:
="Generated on: " & Format(Globals!ExecutionTime, "dd MMMM yyyy")
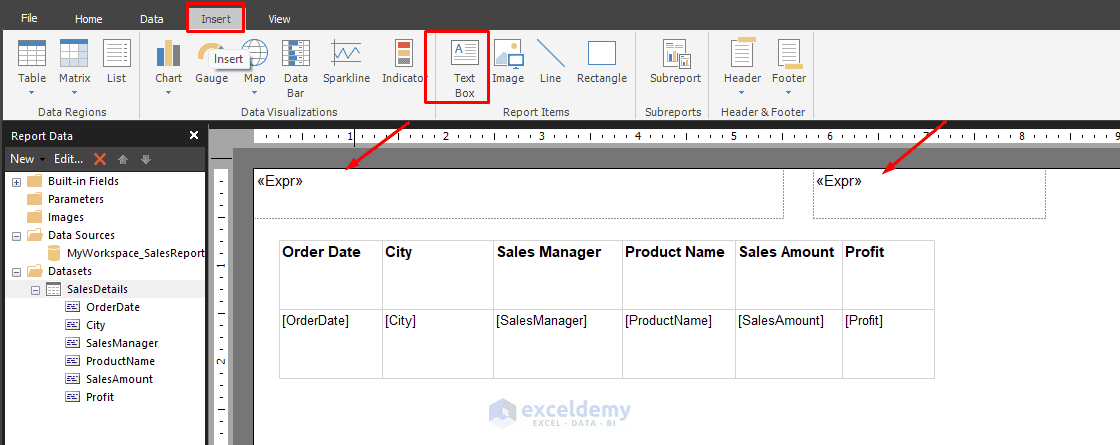
- Format the title with a larger font and bold text
Expressions in paginated reports can also be used for calculated values, conditional formatting, parameters, and dynamic headers or footers.
Step 5: Repeat the Table Headings
For long reports, the column headings should appear at the top of every page.
First, try the standard option:
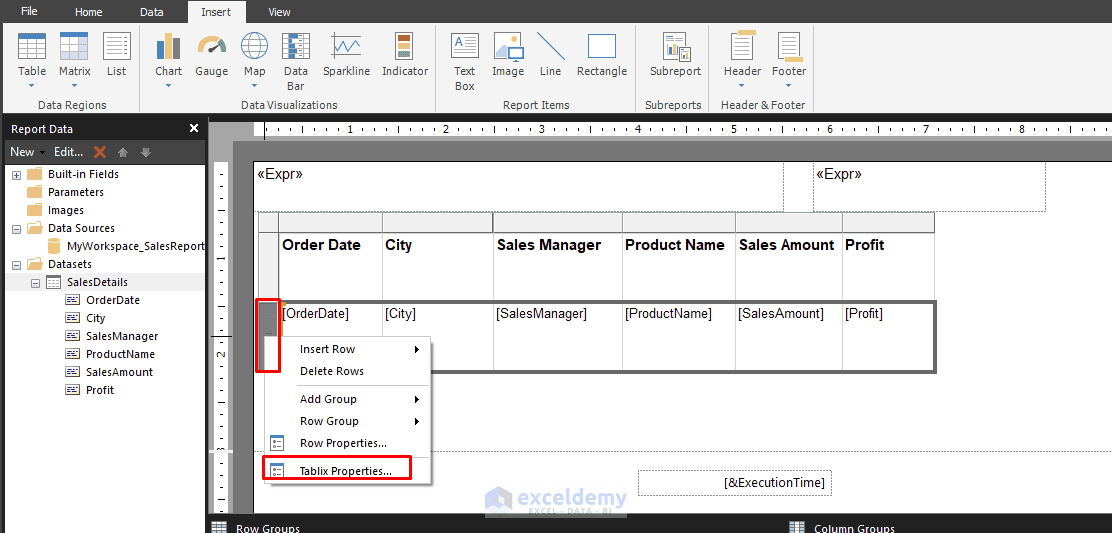
- Click anywhere inside the table
- Right-click the small gray handle at the bottom-left corner of the table
- Select Tablix Properties
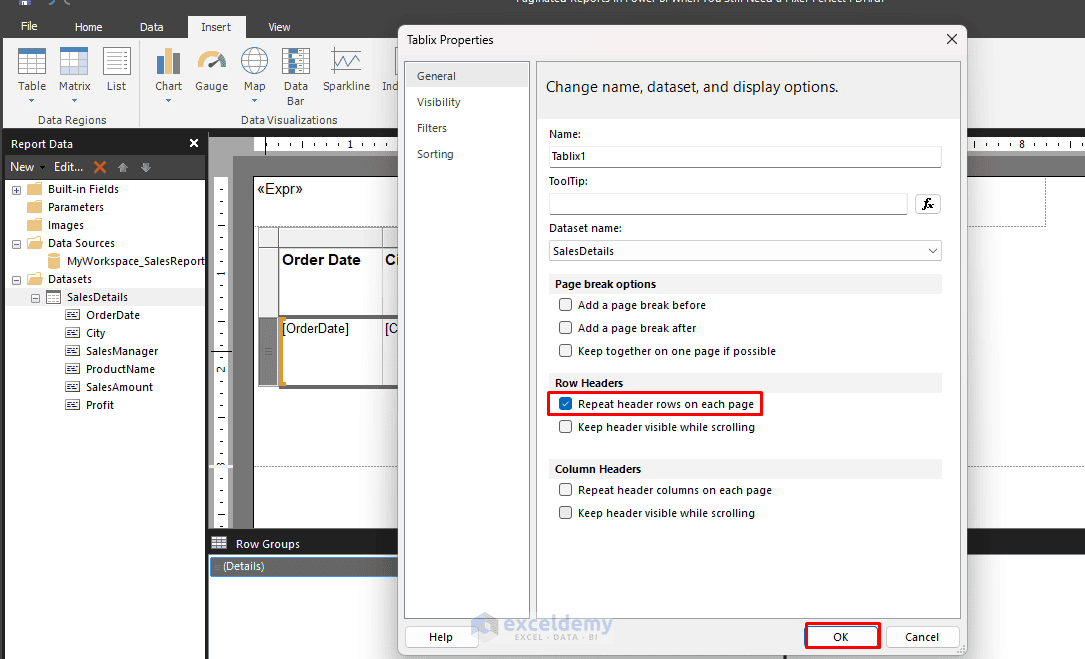
- Under Row Headers >> enable Repeat header rows on each page
- Click OK
If the heading still does not repeat:
- Select the table
- Find the small drop-down arrow on the far-right side of the entire Grouping pane, not the arrow beside (Details)
- Select Advanced Mode
- Select the static member representing the heading row
- In the Properties pane, set:
RepeatOnNewPage = True
KeepWithGroup = After
These properties keep the heading row with the table records and repeat it on each new page.
Step 6: Configure the Printed Page
- Right-click the empty area outside the report body >> select Report Properties
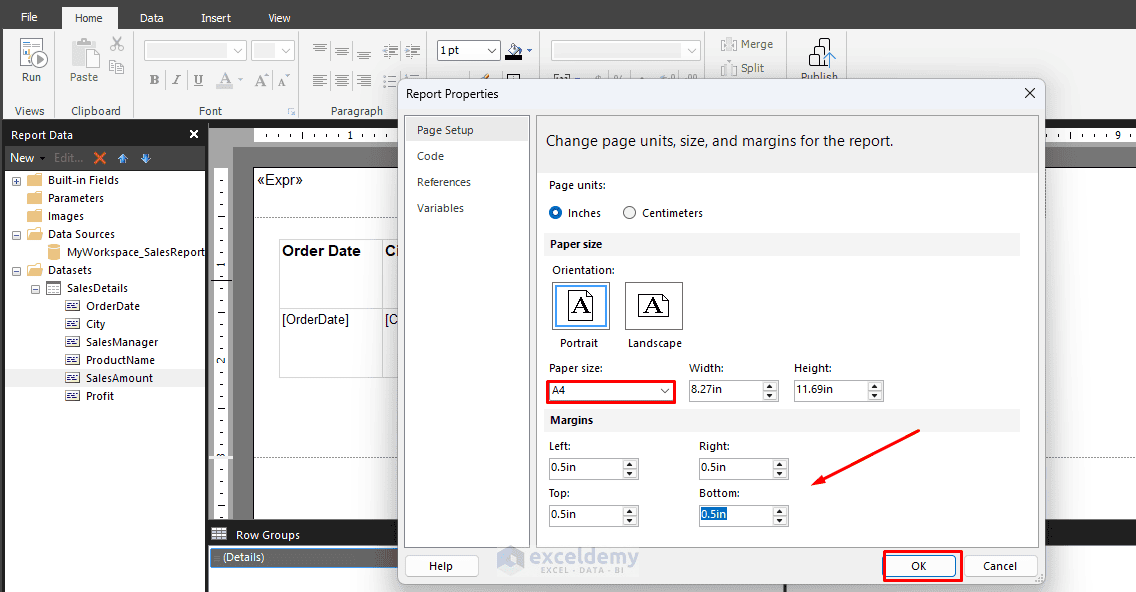
- From Paper size >> select A4
- For an A4 portrait report, use approximately:
- Page Width: 8.27 in
- Page Height: 11.69 in
- Set Left, Right, Top, and Bottom Margin: 0.5 in
- Click OK
The printable width is:
8.27 - 0.5 - 0.5 = 7.27 inches
Therefore, the report body and all report elements should remain within 7.27 inches. The following condition will create an extra or blank horizontal page:
Report body width + left margin + right margin > page width
Reduce the table width, report body width, margins, font size, or cell padding when the content does not fit.
For a wide table, switch to landscape by reversing the page width and height values.
Add a Page Footer:
- The report body automatically shows the Page Footer
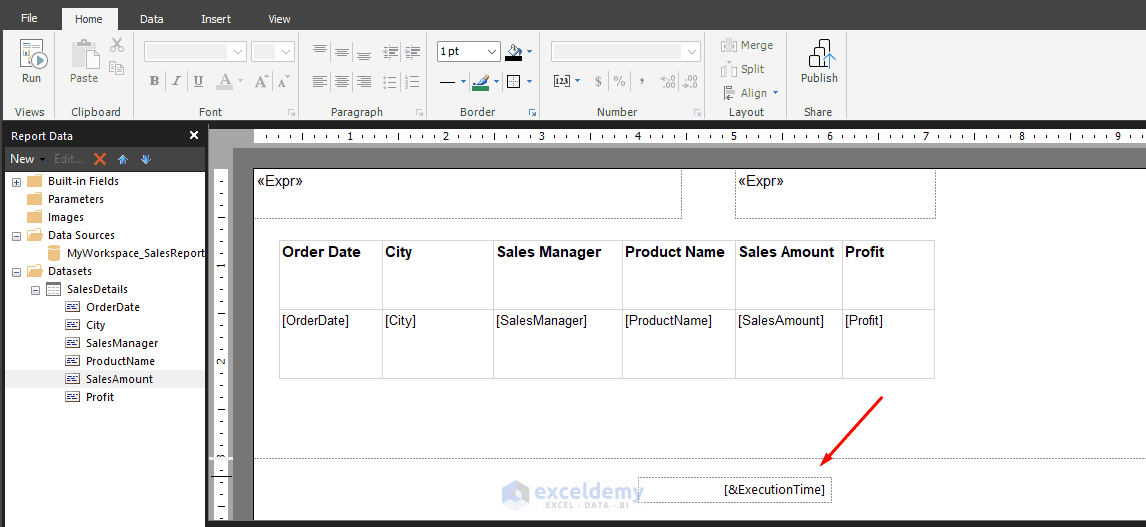
- If not, right-click outside the report body >> select Insert >> select Page Footer
- Insert a text box in the footer and enter:
="Page " & Globals!PageNumber & " of " & Globals!TotalPages
- You can also display the report name and execution date:
=Globals!ReportName & " | " & Format(Globals!ExecutionTime, "dd-MMM-yyyy")
Page numbers should normally be placed in the page header or footer.
Step 7: Preview and Export
Preview:
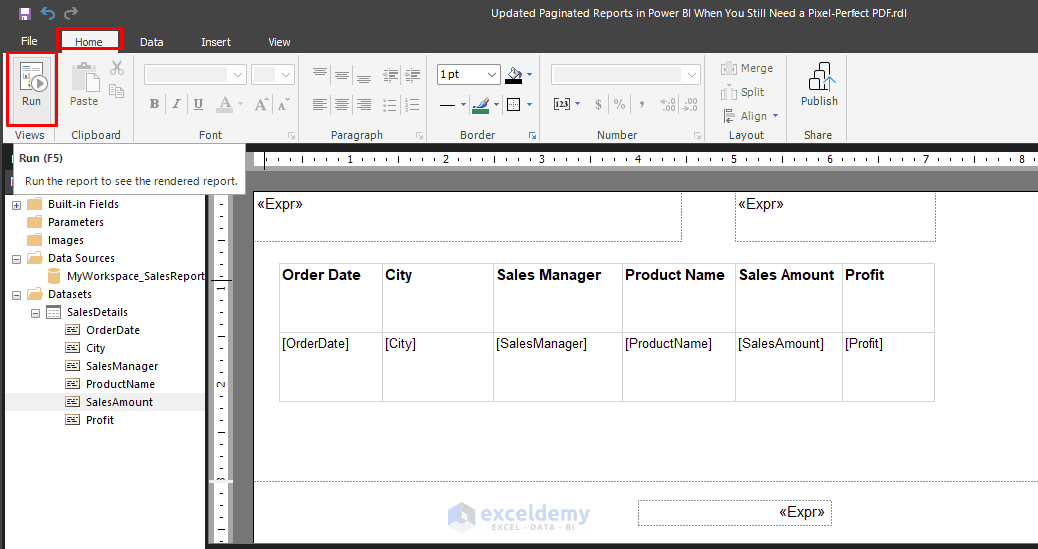
- Go to the Home tab >> select Run to preview the report
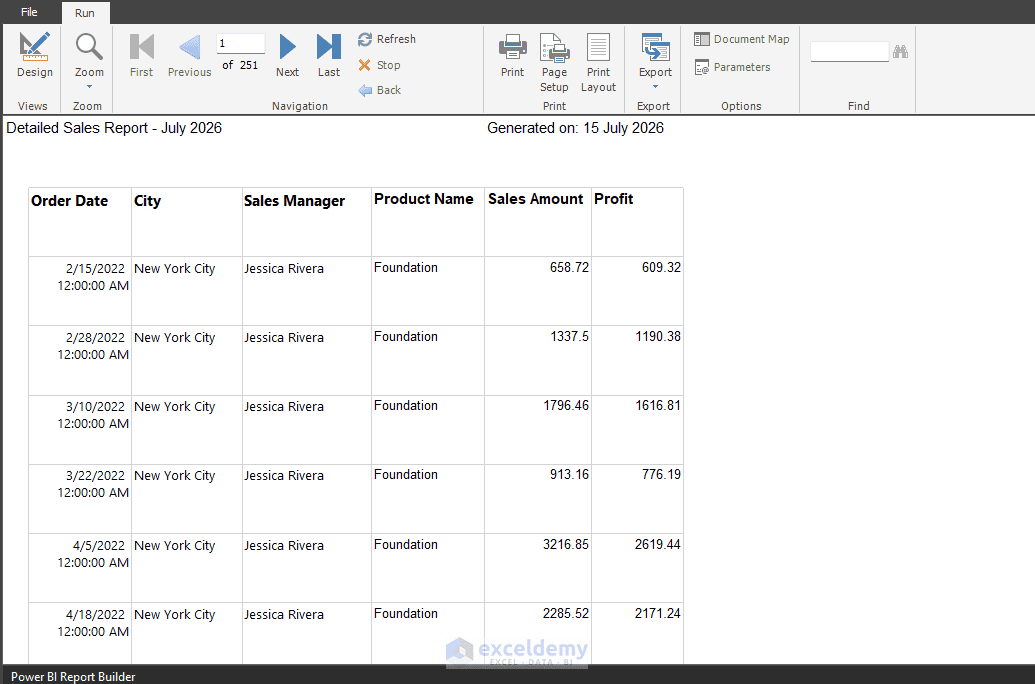
- The report will now render in the preview window
- Use Print Layout to inspect the physical pages. Check that:
- All columns fit within the page
- Column headings repeat correctly
- No unexpected blank pages appear
- Text is not cut off
- Page numbers display correctly
- The table does not overlap the footer
- Page breaks occur in sensible locations
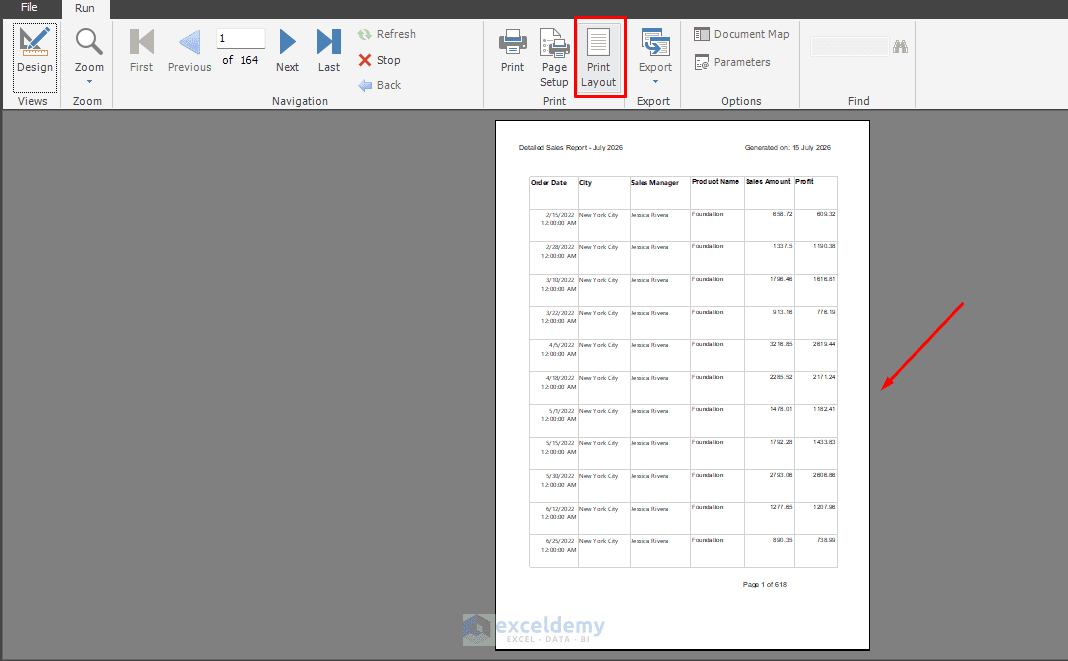
The normal preview may not show the same pagination as the final PDF, because the PDF renderer uses fixed physical page dimensions.
Export to PDF:
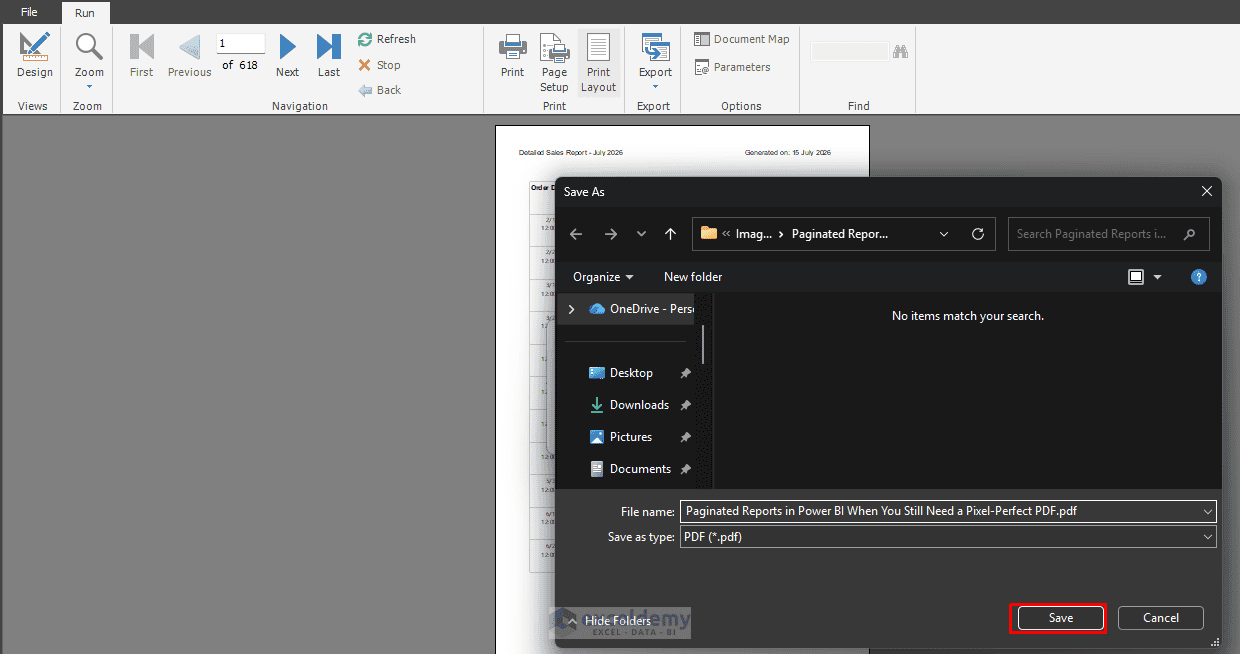
From the report preview:
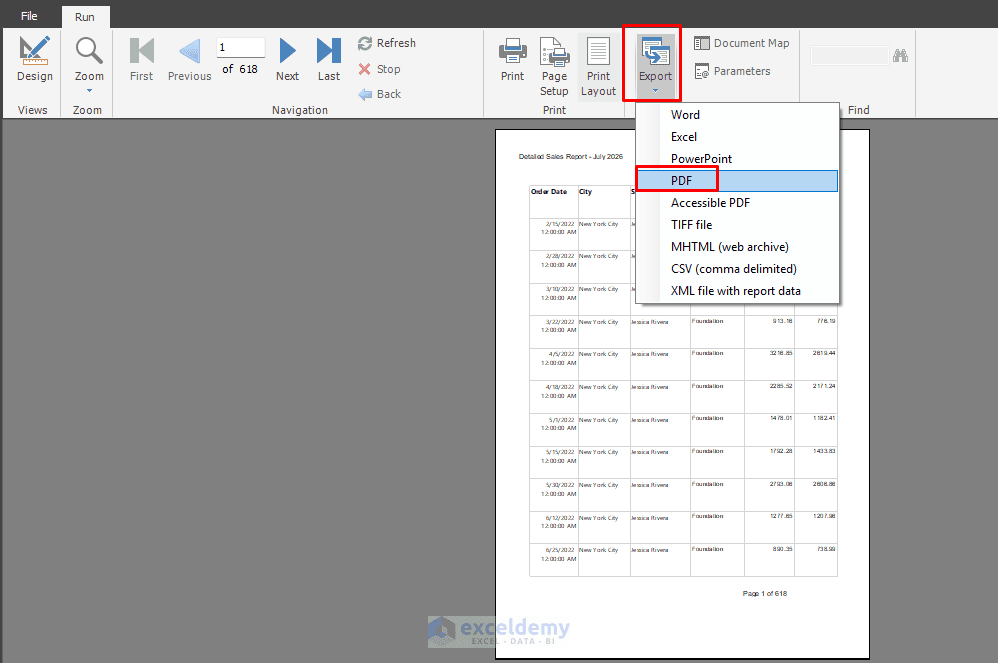
- Select Export >> choose PDF
- Select a folder >> enter a file name
- Click Save
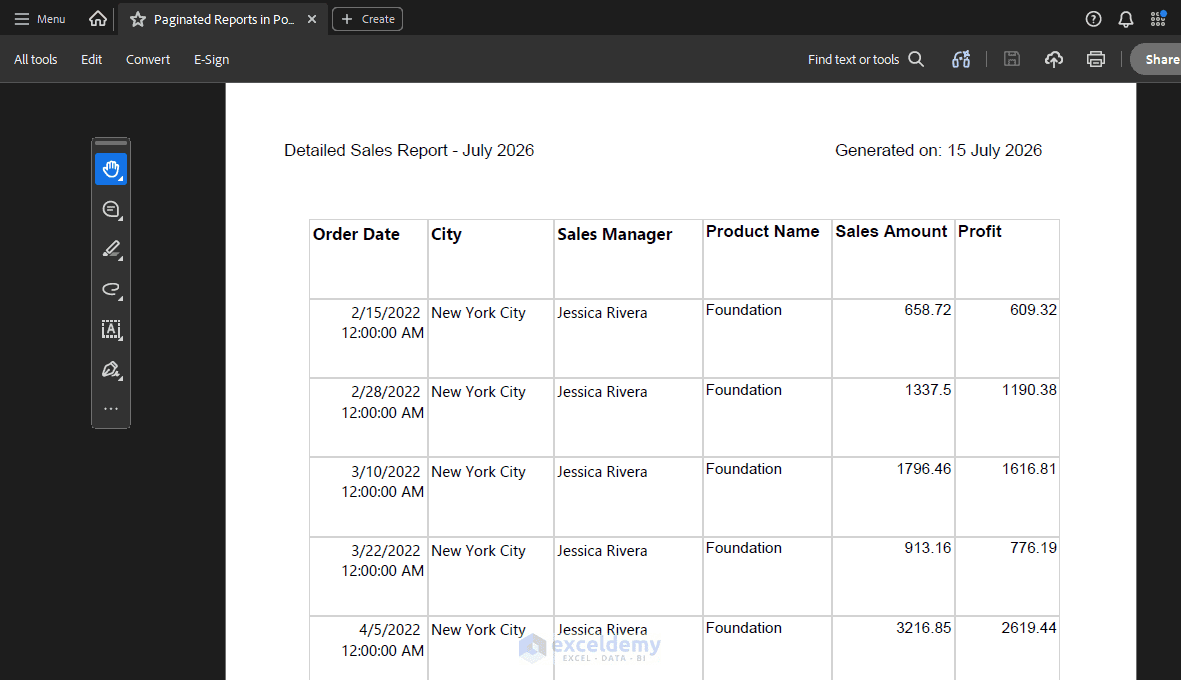
- Open the PDF
- Inspect all pages before distributing them
After publishing, users can also export the report from the Power BI service by opening the report and selecting the required format from the Export menu. Supported options include PDF, Accessible PDF, Excel, Word, PowerPoint, CSV, XML, and other formats.
Step 8: Publish to Power BI
Save the report locally as an .rdl file.
To publish it:
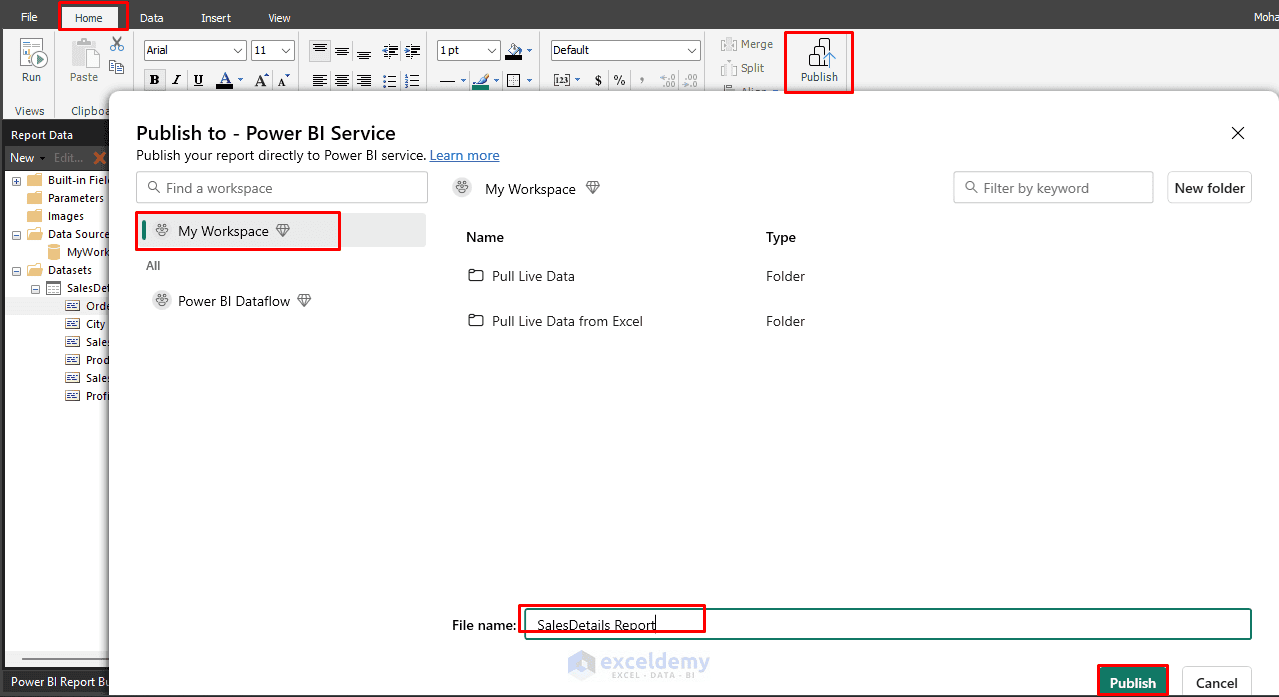
- Go to the Home tab >> choose Publish
- Sign in to Power BI
- Select the destination workspace
- Enter the report name: SalesDetails Report
- Click Publish
You can also upload the .rdl file directly from the Power BI service.
Common Problems and Solutions
- Extra Blank Pages: This normally means the report body and margins are wider than the selected page. Reduce the report body, table, and column widths, and remove unused white space.
- Table Headings Do Not Repeat: Enable Repeat header rows on each page or use Advanced Mode and set:
RepeatOnNewPage = True
KeepWithGroup = After
- Columns Appear on Another Page: Reduce the column widths, font size, padding, or page margins. Alternatively, use landscape orientation.
- Text is Cut Off: Increase the row height or enable the text box property that allows the text box to grow vertically.
- PDF and Preview Look Different: Use Print Layout and export a test PDF before publishing or distributing the report. Fixed-layout formats may paginate differently from the regular preview.
Conclusion
Paginated reports fill a critical gap in Power BI for scenarios where a consistent, pixel-perfect PDF is non-negotiable. Start simple with the Report Builder wizards, experiment with the sample reports, and gradually incorporate advanced features like parameters and subreports. Use standard Power BI reports when users need interactive analysis, filtering, drill-down, and dashboards. Use paginated reports when the output must behave like a professionally formatted document — they are especially well suited to invoices, account statements, purchase orders, audit reports, and similar deliverables.
Get FREE Advanced Excel Exercises with Solutions!

