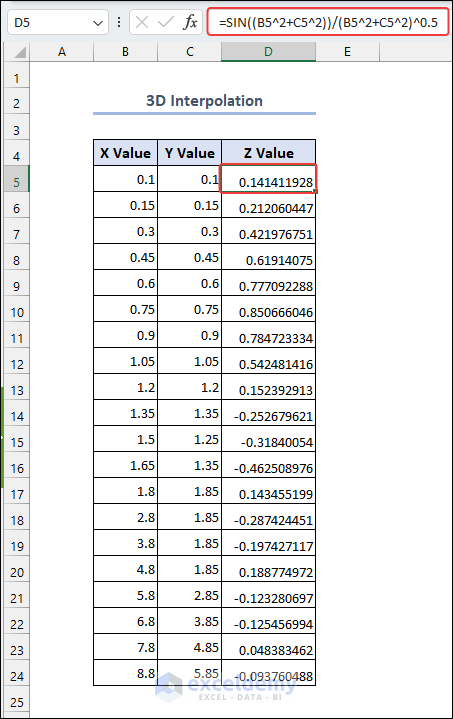
Method 1 – Finding the Value of Z
- Find out the value of the Z from the Z = SIN(x2+y2)/√(x2+y2) equation. We used the following formula in the D5 cell to apply the equation.
=SIN((B5^2+C5^2))/(B5^2+C5^2)^0.5
- B5= X value
- C5=Y value
The formula resembles the Mexican Hat function. The SIN function returns the sine of given values.
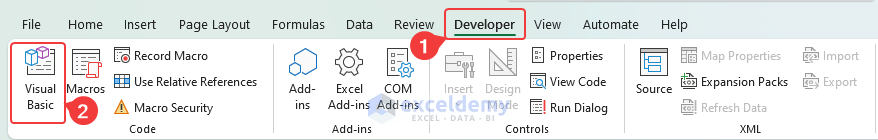
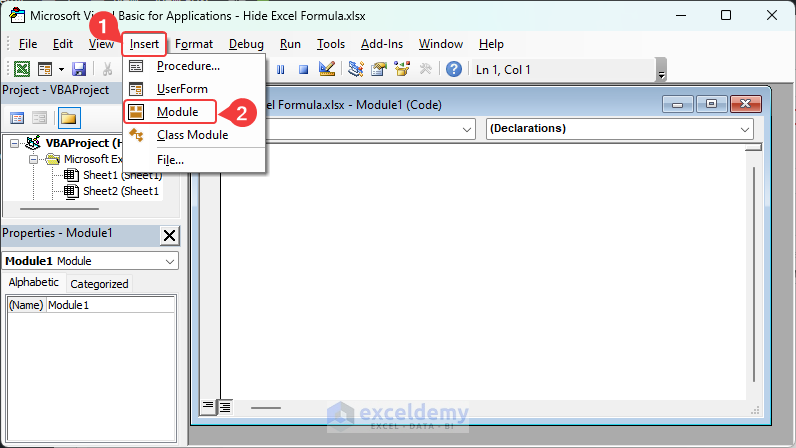
Method 2 – Creating UDF with VBA
- Demonstrate how we have written the function.
- Select Developer >> Visual Basic.
- Select Insert >> Module.
- Write down the code below.
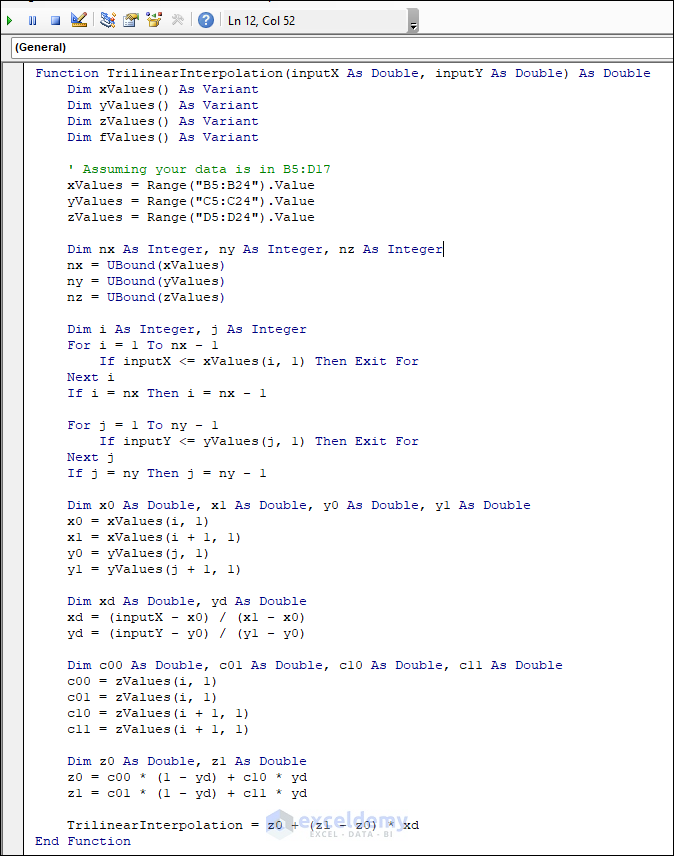
- Copy the code from here.
Function TrilinearInterpolation(inputX As Double, inputY As Double) As Double
    Dim xValues() As Variant
    Dim yValues() As Variant
    Dim zValues() As Variant
    Dim fValues() As Variant

    ' Assuming your data is in B5:D17
    xValues = Range("B5:B24").Value
    yValues = Range("C5:C24").Value
    zValues = Range("D5:D24").Value

    Dim nx As Integer, ny As Integer, nz As Integer
    nx = UBound(xValues)
    ny = UBound(yValues)
    nz = UBound(zValues)

    Dim i As Integer, j As Integer
    For i = 1 To nx - 1
        If inputX <= xValues(i, 1) Then Exit For
    Next i
    If i = nx Then i = nx - 1

    For j = 1 To ny - 1
        If inputY <= yValues(j, 1) Then Exit For
    Next j
    If j = ny Then j = ny - 1

    Dim x0 As Double, x1 As Double, y0 As Double, y1 As Double
    x0 = xValues(i, 1)
    x1 = xValues(i + 1, 1)
    y0 = yValues(j, 1)
    y1 = yValues(j + 1, 1)

    Dim xd As Double, yd As Double
    xd = (inputX - x0) / (x1 - x0)
    yd = (inputY - y0) / (y1 - y0)

    Dim c00 As Double, c01 As Double, c10 As Double, c11 As Double
    c00 = zValues(i, 1)
    c01 = zValues(i, 1)
    c10 = zValues(i + 1, 1)
    c11 = zValues(i + 1, 1)

    Dim z0 As Double, z1 As Double
    z0 = c00 * (1 - yd) + c10 * yd
    z1 = c01 * (1 - yd) + c11 * yd

    TrilinearInterpolation = z0 + (z1 - z0) * xd
End Function
Code Explanation Function Definition: The code defines a function called TrilinearInterpolation that takes two input arguments (inputX and inputY) of type Double and returns a Double value as the result of the trilinear interpolation. Declaring Variables: Several arrays (xValues, yValues, zValues, and fValues) and other variables are declared to hold the input data and intermediate values during the interpolation process. Assigning Data: The code assumes that the data for the interpolation is stored in the Excel sheet’s range B5:D24. The data in columns B, C, and D is copied into the respective arrays (xValues, yValues, and zValues) using the Range().Value method. Determining Array Sizes: The variables nx, ny, and nz store the upper bound of the arrays xValues, yValues, and zValues. These values represent the number of data points available along each axis. Finding the Interval for X: The code uses a loop to find the interval where inputX falls between xValues(i, 1) and xValues(i+1, 1). It iterates over the array xValues and compares inputX with each element until it finds the interval where inputX lies. It then stores the index I, representing the lower bound of the interval. If inputX is greater than or equal to the last element of xValues, i is set to nx – 1. Finding the Interval for Y: The code uses another loop to find the interval where inputY falls between yValues(j, 1) and yValues(j+1, 1). It iterates over the array yValues and compares inputY with each element until it finds the interval where inputY lies. It stores the index j representing the lower bound of the interval. If inputY is greater than or equal to the last element of yValues, we set j to ny – 1. Calculating Interpolation Parameters: The code calculates interpolation parameters xd and yd for inputX and inputY, respectively. xd represents the relative position of inputX within the interval determined by xValues(i, 1) and xValues(i+1, 1). Similarly, yd represents the relative position of inputY within the interval determined by yValues(j, 1) and yValues(j+1, 1). Calculating Interpolation for Z: The code uses the trilinear interpolation method to calculate z0 and z1 by combining data from four cube corners formed by c00, c01, c10, and c11. These corner values are the zValues corresponding to the positions (x0, y0), (x0, y1), (x1, y0), and (x1, y1). The z0 and z1 values are calculated using bilinear interpolation in the x-y plane. Final Trilinear Interpolation: The code calculates the final result using xd to interpolate between z0 and z1. This step combines the interpolated values from the x and y directions to obtain the final interpolated value for the given inputX and inputY. The result is assigned to the function and returned as the output of the TrilinearInterpolation function.
Function TrilinearInterpolation(inputX As Double, inputY As Double) As DoubleDim xValues() As Variant
Dim yValues() As Variant
Dim zValues() As Variant
Dim fValues() As Variant xValues = Range("B5:B24").Value
yValues = Range("C5:C24").Value
zValues = Range("D5:D24").ValueDim nx As Integer, ny As Integer, nz As Integer
nx = UBound(xValues)
ny = UBound(yValues)
nz = UBound(zValues)
Dim i As Integer, j As Integer
For i = 1 To nx - 1
If inputX <= xValues(i, 1) Then Exit For
Next i
If i = nx Then i = nx - 1
For j = 1 To ny - 1
If inputY <= yValues(j, 1) Then Exit For
Next j
If j = ny Then j = ny - 1 Dim x0 As Double, x1 As Double, y0 As Double, y1 As Double
x0 = xValues(i, 1)
x1 = xValues(i + 1, 1)y0 = yValues(j, 1)
y1 = yValues(j + 1, 1)Dim xd As Double, yd As Double
xd = (inputX - x0) / (x1 - x0)
yd = (inputY - y0) / (y1 - y0)
Dim c00 As Double, c01 As Double, c10 As Double, c11 As Double
c00 = zValues(i, 1)
c01 = zValues(i, 1)
c10 = zValues(i + 1, 1)
c11 = zValues(i + 1, 1) Dim z0 As Double, z1 As Double
z0 = c00 * (1 - yd) + c10 * yd
z1 = c01 * (1 - yd) + c11 * yd
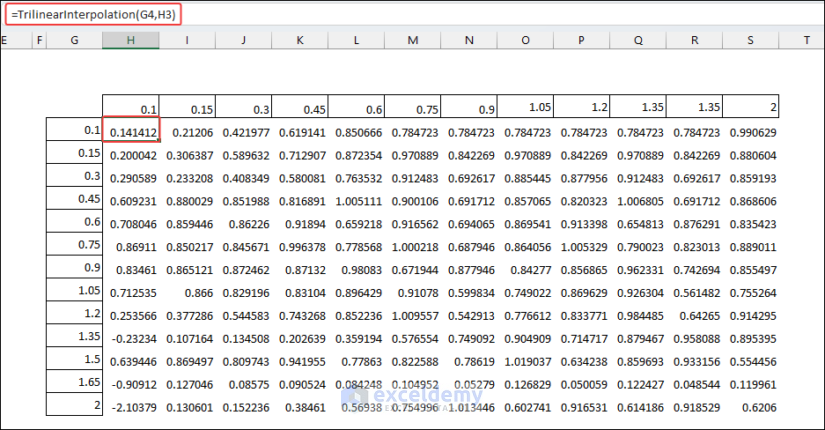
Method 3 – Prepare Dataset According to X and Y value
- You created a TrilinearInterpolation function using VBA to create 3D interpolation from the dataset. Apply the function. The formula will be in the H4
=Trilinearinterpolation(G4,H3)
G4= X values, and H3=Y values.
Method 4 – Create a 3D Interpolation Graph
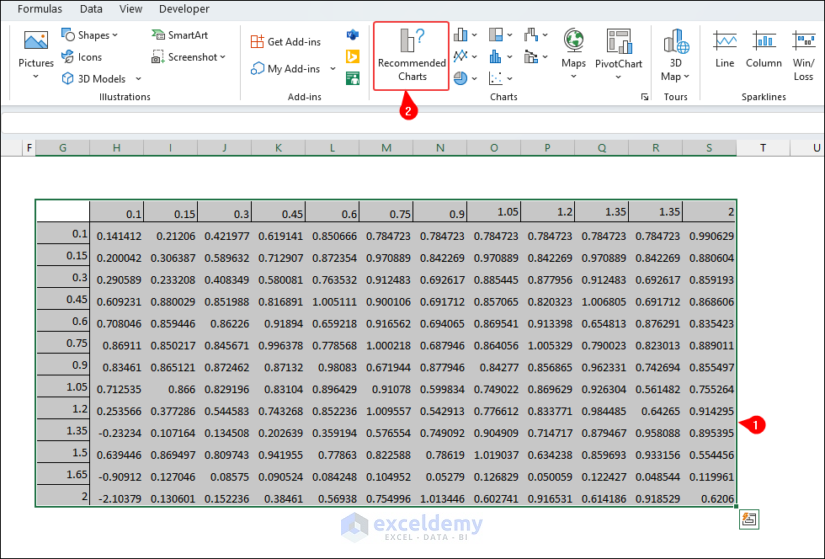
- Select the data and click on Recommend Charts.
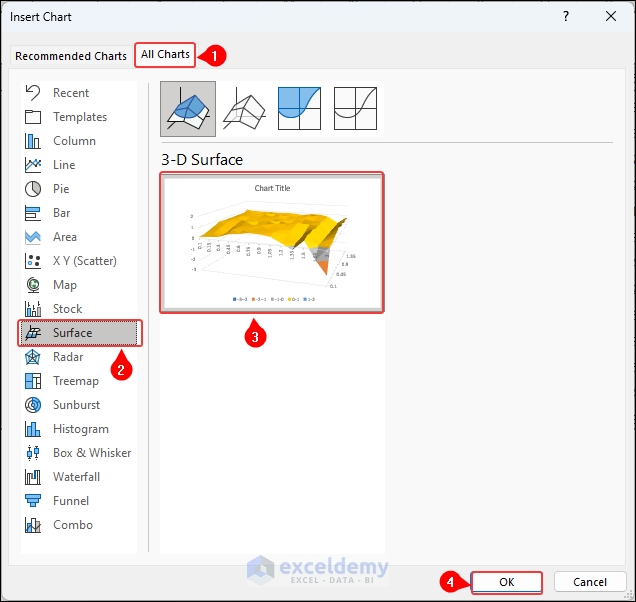
- Select All Charts >> choose Surface >> pick 3D Surface chart >> press OK.
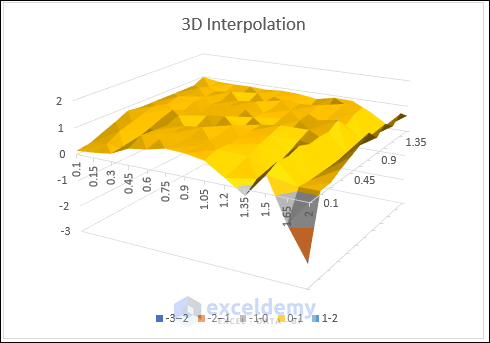
- Get the interpolated 3D graph.
Things to Remember
- Take more data points for your function to predict all the data well.
- Whenever possible, compare the interpolated results with actual data points to validate the accuracy of your interpolation. This step is essential to ensure the reliability of your predictions.
Frequently Asked Questions
1. What are the benefits of 3D interpolation in Excel?
3D interpolation allows users to fill in missing data points within a dataset, enabling a more complete analysis and visualization. It helps in making accurate predictions and provides a smoother representation of the data, particularly when dealing with sparse datasets.
2. How can I deal with outliers or noisy data in 3D interpolation?
Handling outliers or noisy data is crucial for accurate 3D interpolation. Preprocessing techniques such as data smoothing, data filtering, or outlier removal can be applied before interpolation to improve the reliability of results.
Download Practice Workbook
Related Articles
- How to Calculate Logarithmic Interpolation in Excel
- How to Interpolate Time Series in Excel
- How to Perform Exponential Interpolation in Excel
- How to Do Polynomial Interpolation in Excel
- How to Apply Cubic Spline Interpolation in Excel
<< Go Back to Excel Interpolation | Excel for Statistics | Learn Excel
Get FREE Advanced Excel Exercises with Solutions!
