Looking for ways to know how to create a bubble chart in Excel with labels? Usually, we use bubble charts to graphically visualize multiple numerical ...
Consider a sample dataset with the top 5 most popular U.S. mobile network operators and their customer reviews. We will present them in the form of a ...
Method 1 - Creating a Frequency Distribution Chart in Excel
Let’s say we have the information for Oakmont Ridge Golf Club shown in the B4:C14 cells ...
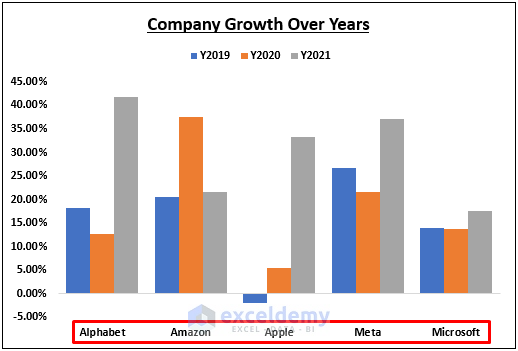
Excel is a very powerful software. We can perform numerous operations on our datasets using Excel tools and features. With the help of various charts ...